RESEARCH OUTPUTS / RÉSULTATS DE RECHERCHE
Author(s) - Auteur(s) :
Publication date - Date de publication :
Permanent link - Permalien :
Rights / License - Licence de droit d’auteur :
Institutional Repository - Research Portal
Dépôt Institutionnel - Portail de la Recherche
researchportal.unamur.be
University of Namur
Enhanced meta-analysis highlights genes involved in metastasis from several
microarray datasets
Pierre, M.; De Hertogh, Benoît; De Meulder, Bertrand; Bareke, E.; Depiereux, S.; Michiels, C.;
Depiereux, E.
Published in:
Journal of Proteomics and Bioinformatics
DOI:
10.4172/ jpb.1000164
Publication date:
2011
Document Version
Publisher's PDF, also known as Version of record
Link to publication
Citation for pulished version (HARVARD):
Pierre, M, De Hertogh, B, De Meulder, B, Bareke, E, Depiereux, S, Michiels, C & Depiereux, E 2011, 'Enhanced
meta-analysis highlights genes involved in metastasis from several microarray datasets', Journal of Proteomics
and Bioinformatics, vol. 4, no. 2, pp. 36-43. https://doi.org/10.4172/ jpb.1000164
General rights
Copyright and moral rights for the publications made accessible in the public portal are retained by the authors and/or other copyright owners and it is a condition of accessing publications that users recognise and abide by the legal requirements associated with these rights. • Users may download and print one copy of any publication from the public portal for the purpose of private study or research. • You may not further distribute the material or use it for any profit-making activity or commercial gain
• You may freely distribute the URL identifying the publication in the public portal ? Take down policy
If you believe that this document breaches copyright please contact us providing details, and we will remove access to the work immediately and investigate your claim.
Enhanced Meta-analysis Highlights Genes Involved in Metastasis from
Several Microarray Datasets
Michael Pierre1, Benoît DeHertogh1, Bertrand DeMeulder1, Eric Bareke1, Sophie Depiereux1, Carine Michiels2 and Eric Depiereux1*
1Molecular Biology Research Unit (URBM), University of Namur - FUNDP, Namur, Belgium 2Cell Biology Research Unit (URBC), NARILIS, University of Namur - FUNDP, Namur, Belgium
*Corresponding author: Eric Depiereux, Molecular Biology Research Unit (URBM), University of Namur, 61 rue de Bruxelles, 5000 Namur, Belgium, Tel: +32 81 72 44 15; Fax: +32 81 72 44 20; E-mail: [email protected]
Received November 28, 2010; Accepted February 14, 2011; Published February 17, 2011
Citation: Pierre M, DeHertogh B, DeMeulder B, Bareke E, Depiereux S, et al. (2011) Enhanced Meta-analysis Highlights Genes Involved in Metastasis from Several Microarray Datasets. J Proteomics Bioinform 4: 036-043. doi:10.4172/ jpb.1000164
Copyright: © 2011 Pierre M, et al. This is an open-access article distributed under the terms of the Creative Commons Attribution License, which permits unrestricted use, distribution, and reproduction in any medium, provided the original author and source are credited.
Keywords:
Metastasis; Hypoxia; Microarray; Meta-analysis;Statistical threshold
Abbreviations:
ADM : Adrenomedullin; AFP: Alpha-Fetoprotein; ASPM: asp (abnormal spindle) homolog, microcephaly associated (Drosophila); BCAT1: Branched Chain Amino-acid Transaminase 1, cytosolic; BCL-2: B-cell CLL/lymphoma 2; BHLHE40: Basic Helix-Loop-Helix Family, Member e40; CAV1: Caveolin 1, caveolae protein, 22kDa; CDF: Chip Definition File; DAVID: Database for Annotation, Visualization and Integrated Discovery; GCRMA: GeneChip Robust Multi-array Analysis; GEO: Gene Expression Omnibus; GLUT3, glucose transporter type 3; GPC1: glypican 1; GSE: GEO series; HBGF: Heparin-Binding Growth Factor; HMC-1: Human Mast Cell-1; KEGG: Kyoto Encyclopedia of Genes and Genomes; MAP2K1: Mitogen-Activated Protein Kinase Kinase 1; MMP: Matrix Metalloproteinase; NR4A1: Nuclear Receptor subfamily 4, group A, member 1; RGS20: Regulator of G-protein Signaling 20; SLC2A3: Solute carrier family 2 (facilitated glucose transporter), member 3; SMURF2 : SMAD specific E3 Ubiquitin protein ligase 2; TNF-β: Tumor Necrosis Factor; ZFHX3: zinc finger homeobox 3Introduction
Metastasis is the final stage of cancer and is characterized by the migration of primary tumor cells to distant organs [1]. These cells set up various mechanisms in a sequential fashion [2]. First, they lose their adherence to the other tumor cells and gain adherence to the extracellular matrix. Then, they degrade the extracellular matrix to invade the tissue. Next, they enter blood or lymph vessels and circulate in the body until they leave the bloodstream or lymphatic circulation to divide in the organ where they stop. These mechanisms involve changes in expression profiles of genes such as integrins, matrix metalloproteinases and growth factors.
Hypoxia within the primary tumor further enhances the metastatic phenotype. Hypoxia occurs at the center of the tumor because the distance between the cells and blood vessels increases as a result of tumor growth and because the new vasculature is abnormal [3]. Hypoxia selects cancer cells with a high metastatic potential [4] and triggers survival mechanisms, leading to increased radiotherapy and chemotherapy resistance [5].
Developed during the 1990s, DNA microarrays are used in an increasing number of applications in molecular biology research. Despite the technique’s ability to assess the entire transcriptome of an organism at once [6], it is associated with many difficulties in the analysis of results. Several issues can be pointed out. First, to produce statistical results, several replicates are needed. However, since several thousands of tests are performed at once, the number of false positives and false negatives rapidly becomes unmanageable [7,8]. Therefore, the only solution is to increase the number of replicates, but the cost of the analyses prevents this. Second, the chip probes do not always correspond to the genes they are expected to find, which requires regular updating of the files linking probes and genes [9,10]. Finally, the number of possible combinations of analysis methods frequently leads to inappropriate choices.
These problems and the growing number of publicly-available datasets have led the research community to try new ways to analyze DNA microarrays. Meta-analysis is one of these solutions. It consists of analyzing several related datasets at once [11-13]. This work proposes a new approach to set a statistically-significant threshold to achieve a more relevant meta-analysis. This new methodology was applied to metastasis and hypoxia datasets and the results were validated in an independent experiment in which another dataset assessing MDA-MB-231 and MCF-7 cells was used to generate expression profiles for each gene selected by the methodology. Since MDA-MB-231 cells are breast cancer cells with high metastatic potential and MCF-7 cells are
Abstract
Metastasis is the final stage of cancer and is still associated with high mortality despite breakthroughs in recent years. Hypoxia at the center of the primary tumor is a major cause of metastasis. Here, we present a new meta-analysis-based methodology to pick out genes involved in one or two biological processes from several microarray datasets using a statistic that avoids the definition of an arbitrary threshold, providing statistically-significant results. Applied to metastasis and hypoxia datasets, this methodology was able to select genes already known to be involved in these phenomena as well as new candidates for further analyses.
165 genes of interest were selected, many of which were already known to be involved in cancer, metastasis and/ or hypoxia. Moreover, some could be classified into 42 pathways, including 12 cancer pathways and 5 proliferation and cell motility pathways. Negative tests performed with random genes failed to provide such results. In additional independent validations, expression profiles were generated for the 165 genes of interest from two other datasets with MDA-MB-231, MCF-7 and L3.6pl cells and the previous results were confirmed in most cases.
Citation: Pierre M, DeHertogh B, DeMeulder B, Bareke E, Depiereux S, et al. (2011) Enhanced Meta-analysis Highlights Genes Involved in Metastasis from Several Microarray Datasets. J Proteomics Bioinform 4: 036-043. doi:10.4172/jpb.1000164
breast cancer cells with poor metastatic potential, these expression profiles validate the involvement of the genes of interest in the cell motility process. As metastasis mechanisms are the same in every type of cancer [14], this meta-analysis was run independently of the type of cancer. Certain genes involved in hypoxia were also validated by expression profiles in another independent experiment in which highly metastatic pancreatic cancer cells (L3.6pl) were exposed to normoxia or hypoxia. These results may help us to discover new targets to fight metastasis, and particularly in its upregulation by hypoxia.
Materials and Methods
Datasets, individual analyses, union intersections and
meta-analyses
All the datasets and procedures used to run the individual analyses, union intersections and meta-analyses were described in Pierre et al. [15]. The data was pre-processed with GCRMA (GeneChip Robust Multi-array Analysis) [16] and the Window Welch t test [17] was used for the processing, according to the benchmark performed by De Hertogh et al. [18]. The additional datasets, GSE (GEO series) 5823 and GSE9350, used for determining expression profiles were downloaded from GEO (Gene Expression Omnibus) (NCBI, 2000).
Intersections
33 groups of individual analyses were designed as described in Pierre et al. [15]. A threshold rank was calculated in each group with the equation (1):
1/ 1/
[1 (1 ) ]n k
r= − −P × (1)N
where r = the threshold rank, P = the fixed probability, n = the number of genes suspected to be involved in metastasis and/or in the response to hypoxia, k = the number of datasets in the group and N = the number of probe sets on the GeneChip (the largest when several GeneChip models are involved in the group). This equation is explained in the discussion.
The genes common to all datasets of the group and above the threshold were selected in each group.
Visualization
The webtool DAVID (Database for Annotation, Visualization and Integrated Discovery) [19,20], version 6.7, was used to visualize the genes of interest on KEGG (Kyoto Encyclopedia of Genes and Genomes) [21] and Biocarta (Biocarta) pathway maps. The largest number of maps was obtained by setting the stringency of the “Functional Annotation Clustering” to the lowest level.
Expression profiles
The datasets GSE5823 and GSE9350 were analyzed separately with an AffyProbeMiner’s CDF (chip definition file) [10] and pre-processed with GCRMA [16] with default parameters. The expression values of each probe set for each gene of interest in the dataset GSE5823 were then plotted for GeneChips where control MCF-7 cells or control MDA-MB-231 cells were analyzed. The expression values of genes known to be involved in hypoxia in the dataset GSE9350 were also plotted for GeneChips where L3.6pl cells were exposed to hypoxia or normoxia.
Computer and bioinformatics resources
Versions 2.4.0, 2.6.0 and 2.10.1 of the R statistical software [22] and the Bioconductor [23] and AffyProbeMiner [10] packages were used on a 64-bit computer with 4gb of DDR (biprocessor dual-core Xeon 5160 3.0Ghz, 8 x 500gb RAID).
Results
Intersections
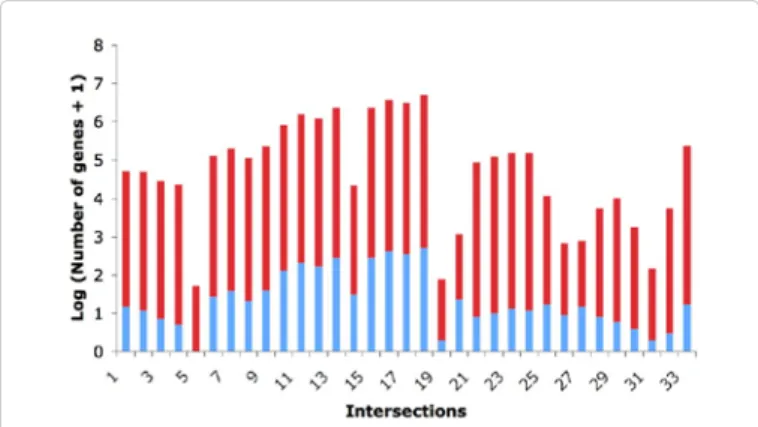
An intersection is composed of a group of datasets. For each of these datasets, the genes are ranked in ascending order of the p values of their differential expression. The intersection approach involves selecting the genes that are common to all the top lists of these datasets. To do this, the top lists must be defined and a maximal rank must be considered. A statistic was developed in order to calculate this rank to ensure that all selected genes of the intersection are selected with statistical significance [24]. This statistic takes into account the number of probe sets of the GeneChip, the number of genes potentially involved in metastasis and/ or the response to hypoxia and the number of datasets involved in the intersection. Figure 1 presents the logarithm of the threshold ranks + 1 (to avoid log (0)) as well as the logarithm of the number of selected genes + 1 (to avoid log (0)) for the 33 intersections. The 33 intersections selected 2,656 genes, among which 846 were non redundant. The number of genes selected by intersection varied between 0 and 513.
Union intersections
Since the 846 genes selected by the intersection approach are too many genes to further process, two other approaches were added. The first is the union intersection approach. Each union intersection takes the hypoxia datasets into account, comparing the group of hypoxia datasets to a group of metastasis datasets and selecting the 50 most significant genes common to at least one hypoxia dataset and to at least one metastasis dataset. Here, no statistic exists to set a threshold as in the intersection approach. Hence, an arbitrary threshold of 50 genes was set. However, unlike intersections, union intersections do not require a large maximal rank to select 50 genes as less is required for a gene to be selected. Thirty union intersections were designed and 1,500 genes (30 x 50) were selected by this approach, among which 269 are unique occurrences.
Meta-analyses
The last approach used to reduce the number of genes to be considered is the meta-analysis approach. This approach is not based on the results of individual analyses. Here, several datasets are merged
Figure 1: Threshold ranks and number of genes selected by intersections. A threshold rank was calculated for each intersection with the equation
= − −[1 (1 ) ]1/ 1/n k×
r p Nwhere p represents the probability a gene has to be selected, r the maximum rank of a gene to be selected with the probability p, N the number of genes represented on the microarray, k the number of datasets taken into account in the intersection and n the number of genes likely to be involved in the phenomenon studied. The red bars show the logarithm of the threshold ranks + 1 (to avoid log (0)). The threshold ranks selected a defined number of genes per intersection. The blue bars show the logarithm of the number of selected genes + 1 (to avoid log (0)).
into datasets. Then, classical analyses are run on these meta-datasets and the 50 most significant genes are selected. Again, no statistical threshold was set, first of all because the 50 selected genes are significant anyway and secondly because setting a threshold such as 0.05 would produce too many selected genes for the meta-analyses. Fourteen meta-datasets were designed and 700 (14 x 50) genes were selected by the meta-analysis approach, of which 406 were unique occurrences.
Combination of approaches
To select an appropriate number of genes to further validate, the three approaches (intersection, union intersection and meta-analysis) were combined. Fifteen genes were found to be common to the three approaches, 52 genes were only common to the intersections and union intersections, 71 genes were only common to the intersections and meta-analyses and 27 genes were only common to the union intersections and meta-analyses. These 165 genes were considered as genes of interest and are highlighted in a Venn’s diagram (Figure 2). Among these 165 genes of interest, 91 are already known in the literature to be involved in cancer, 41 in metastasis and 20 in the response to hypoxia (additional file 1).
Visualization
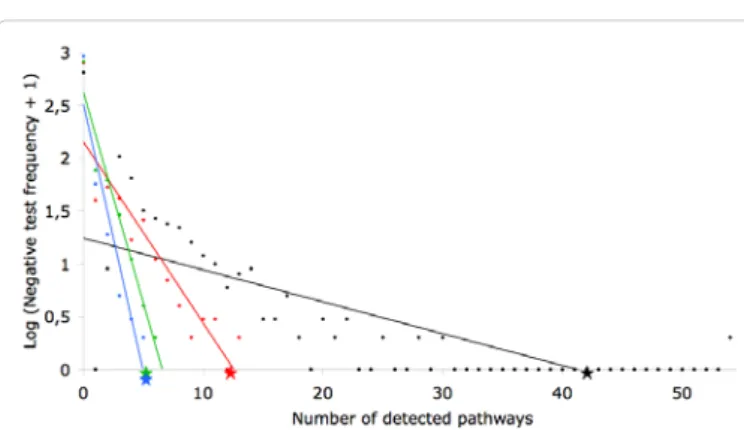
The 165 genes of interest were submitted to DAVID [19,20] to retrieve pathway maps from KEGG [21] and Biocarta (Biocarta). Forty-two different pathways were retrieved, among which 12 are directly involved in cancer and 5 are known to be involved in cell proliferation and cell motility (Table 1). To ensure that this result was not simply a chance occurrence, 1,000 groups of 165 genes selected randomly were submitted to DAVID [19,20]. Among these 1,000 tests, only one gave better results for the total number of pathways than the 165 genes of interest. For the pathways related to cancer, only one test gave better results than the 165 genes of interest. For the pathways involved in cell proliferation and cell motility, only four tests gave equal or better results than the 165 genes of interest (Figure 3). This shows that the probability to obtain the results with the 165 genes of interest by chance is less than 0.5%.
Expression profiles
The expression values of the 165 genes of interest in three samples of non-metastatic breast cancer cells (MCF-7 cells) and two samples of metastatic breast cancer cells (MDA-MB-231) were used to construct expression profiles. Because the number of probe sets varied from one to six for each gene, the 165 genes generated 354 expression profiles (additional file 2). A large portion of them provide interesting information and validate certain results. Indeed, they can directly show up- or downregulation at the transcript level of the genes of interest between cancer cells with or without a metastatic phenotype. In addition, the expression values of four genes known to be involved
in cell response to hypoxia in three replicates of metastatic pancreatic cancer cells (L3.6pl cells) incubated under hypoxia and three replicates of cells incubated under normoxia were used to construct expression profiles. They show the impact of hypoxia on the transcript level of these genes.
Discussion
The intersection approach is a promising method to perform a meta-analysis of a set of microarray datasets. It consists first of performing a classical analysis of all of the datasets, and then selecting the common genes to all the top gene lists of the datasets. This ensures that genes with high probability of differential expression are selected and that there are fewer false positives and false negatives among the genes selected. Moreover, this approach can be performed by re-exploiting archived datasets without performing new experiments. However, as far as we know and after consulting several biostatisticians, there is no statistic to calculate the probability that a gene would be selected in an intersection. Here, we have developed such a statistic. To explain it, we begin with a simple analogy [24]. We have 40 balls, among which 20 are red and numbered from 1 to 20, and we draw 10 balls. This situation is similar to a microarray experiment analysis since we select a small number of genes more or less differentially expressed (the red balls) from a larger number of genes, generally on the order of tens of thousands, that are not differentially expressed (the other balls). The probability to always draw a particular red ball in first position in the null hypothesis where a red ball has the same chance to be drawn as the other balls is equal to
10
1 40
. The probability to always draw a particular red ball in first or second position in the null hypothesis is equal to 2 10
40
. Hence, with N balls among which n are red, the probability p to always draw a particular red ball in at least r position (where r ≤ N) in the null hypothesis in k draws is equal to equation (2):
k r p N = (2) Figure 2: Venn’s diagram of the selected genes. The intersections selected
846 genes, the union intersections selected 269 genes and the meta-analyses selected 406 genes. This data was used to generate a Venn’s diagram.
Figure 3: Pathways retrieved by DAVID in negative tests. 1,000 groups of 165 randomly-selected genes were submitted to DAVID. The X axis shows the number of pathways retrieved by DAVID and the Y axis shows the logarithm of the frequency of the tests (+ 1 to avoid log (0)). The total number of retrieved pathways is represented by the black dots for the negative tests and by the black star for the 165 genes of interest. The number of retrieved cancer pathways is represented by the red dots for the negative tests and by the red star for the 165 genes of interest. The number of retrieved pathways involved in proliferation and cell motility is represented by the green dots for the negative tests and by the green star for the 165 genes of interest. Finally, the number of retrieved pathways involved in pathogen recognition and phagocytosis is represented by the blue dots for the negative tests and by the blue star for the 165 genes of interest.
Citation: Pierre M, DeHertogh B, DeMeulder B, Bareke E, Depiereux S, et al. (2011) Enhanced Meta-analysis Highlights Genes Involved in Metastasis from Several Microarray Datasets. J Proteomics Bioinform 4: 036-043. doi:10.4172/jpb.1000164
Pathways Databases Genes
Cancer
Prostate cancer KEGG CCNE2, FGFR1, HSP90AA1, IGF1, MAPK1, MAP2K1, NFKBIA, PIK3CD Pathways in cancer KEGG CTBP2, CCNE2, FGFR1, FZD1, HSP90AA1, IGF1, MAPK1, MAP2K1, NFKBIA, PIK3CD, STAT1, RALA
Melanoma KEGG FGFR1, IGF1, MAPK1, MAP2K1, PIK3CD
Pancreatic cancer KEGG MAPK1, MAP2K1, PIK3CD, STAT1, RALA Chronic myeloid leukemia KEGG CTBP2, MAPK1, MAP2K1, NFKBIA, PIK3CD
Glioma KEGG IGF1, MAPK1, MAP2K1, PIK3CD
Colorectal cancer KEGG FZD1, MAPK1, MAP2K1, PIK3CD
Endometrial cancer KEGG MAPK1, MAP2K1, PIK3CD
Non-small cell lung cancer KEGG MAPK1, MAP2K1, PIK3CD Acute myeloid leukemia KEGG MAPK1, MAP2K1, PIK3CD
Renal cell carcinoma KEGG MAPK1, MAP2K1, PIK3CD
Small cell lung cancer KEGG CCNE2, NFKBIA, PIK3CD
Proliferation and cell motility
Focal adhesion KEGG CAV1, FLNC, IGF1, MAPK1, MAP2K1, PIK3CD, SPP1 VEGF signaling pathway KEGG HSPB1, MAPK1, MAP2K1, PIK3CD
MAPK signaling pathway KEGG, BIOCARTA DUSP4, FGFR1, FLNC, HSPB1, MAPK1, MAP2K1, NR4A1, NFKBIA, STAT1 ErbB signaling pathway KEGG MAPK1, MAP2K1, PIK3CD
Regulation of actin cytoskeleton KEGG FGFR1, MAPK1, MAP2K1, PIK3CD Pathogen recognition and
phagocytosis
Toll-like receptor signaling pathway KEGG MAPK1, MAP2K1, NFKBIA, PIK3CD, SPP1, STAT1 fMLP induced chemokine gene expression in
HMC-1 cells BIOCARTA MAPK1, MAP2K1, NFKBIA
T Cell Receptor Signaling Pathway KEGG MAPK1, MAP2K1, NFKBIA, PIK3CD Fc Epsilon Receptor I Signaling pathway KEGG MAPK1, MAP2K1, PIK3CD Fc gamma R-mediated phagocytosis KEGG MAPK1, MAP2K1, PIK3CD
Other
p53 signaling pathway KEGG CCNB1, CCNE2, IGF1, RRM2, SERPINE1, SFN Oocyte meiosis KEGG CCNB1, CCNE2, IGF1, MAPK1, MAP2K1, YWHAB, YWHAZ
Cell cycle KEGG CDC6, CCNB1, CCNE2, SFN, YWHAB, YWHAZ
Glutathione metabolism KEGG GGT1, GCLM, GSTM1, GSTM2, GSTM4, RRM2 Metabolism of xenobiotics by cytochrome P450 KEGG GSTM1, GSTM2, GSTM4
Drug metabolism KEGG GSTM1, GSTM2, GSTM4
Progesterone-mediated oocyte maturation KEGG CCNB1, HSP90AA1, IGF1, MAPK1, MAP2K1, PIK3CD Aldosterone-regulated sodium reabsorption KEGG IGF1, MAPK1, PIK3CD, SFN
Neurotrophin signaling pathway KEGG MAPK1, MAP2K1, NFKBIA, PIK3CD, YWHAB, YWHAZ Cadmium induces DNA synthesis and proliferation
in macrophages BIOCARTA MAPK1, MAP2K1, NFKBIA
mTOR signaling pathway KEGG DDIT4, IGF1, MAPK1, PIK3CD NOD-like receptor signaling pathway KEGG CXCL1, HSP90AA1, MAPK1, NFKBIA B cell receptor signaling pathway KEGG MAPK1, MAP2K1, NFKBIA, PIK3CD
Chemokine signaling pathway KEGG CXCL1, MAPK1, MAP2K1, NFKBIA, PIK3CD, STAT1 NFAT and Hypertrophy of the heart (Transcription
in the broken heart) BIOCARTA IGF1, MAPK1, MAP2K1 Keratinocyte Differentiation BIOCARTA MAPK1, MAP2K1, NFKBIA
Long-term depression KEGG IGF1, MAPK1, MAP2K1
Natural killer cell mediated cytotoxicity KEGG HLA-C, MAPK1, MAP2K1, PIK3CD
Melanogenesis KEGG FZD1, MAPK1, MAP2K1
Insulin signaling pathway KEGG MAPK1, MAP2K1, PIK3CD The 165 genes of interest were classified by DAVID into 42 different KEGG or Biocarta pathway maps
Table 1: Pathways retrieved by DAVID. Hence, the probability p to not draw this ball in at least r position in
the null hypothesis is equal to equation (3): 1 k r p N = − (3) Hence, the probability p to not draw any red ball in at least r position in the null hypothesis is equal to equation (4):
1 n k r p N = − (4) In conclusion, the probability p to draw at least one red ball in at least r position in the null hypothesis is equal to equation (5):
1 1 n k r p N = − − (5) Applied to a meta-analysis by the intersection approach of a set
of microarray datasets, p represents the probability that a gene will be selected, r the maximum rank of a gene to be selected with the probability p, N the number of genes represented on the microarray, k the number of datasets taken into account in the intersection and n the number of genes likely to be involved in the phenomenon studied. Equation (5) thus calculates a maximum rank to select genes by the intersection approach with a chosen probability among several datasets (equation 6).
1/ 1/
[1 (1 ) ]n k
r= − −p × (6)N
In the meta-analysis presented in this paper, all the datasets were generated with Affymetrix platforms and, since some intersections included several GeneChip models, N in equation (6) was defined as the number of probe sets in the GeneChip model with the largest number of probe sets. This ensured calculation of the probability p. Indeed, if
N was not defined as the number of probe sets of the GeneChip model with the largest number of probe sets, this could lead to a rank r larger than the number of probe sets in some GeneChips of the intersection. We defined n as the number of genes likely to be involved in metastasis and/or in the response to hypoxia, whether or not described previously in the literature. Indeed, given the lack of evidence of the involvement of some genes in these phenomena, we were forced to estimate their number. For this, we consulted the Entrez Gene database (NCBI) to determine the number of genes already listed to be involved in metastasis and/or in the response to hypoxia. There are 710 genes responding to the keyword “metastasis”, 480 responding to the keyword “hypoxia” and 134 responding to the keywords “metastasis AND hypoxia”. Hence, we considered that there are 1,056 (710 + 480 – 134) genes known in the literature to be involved in metastasis and/or hypoxia. To obtain n, we multiplied this number by two to take into account the genes involved in metastasis and/or hypoxia still not demonstrated as such. The choice of multiplier was motivated by our observation in a previous work about cancer using a meta-analysis methodology in which we retrieved 183
genes of interest, among which 99 were already known to be involved in cancer [15]. This showed that the number of genes known to be involved in a cancer-related phenomenon can be multiplied by two to take into account those genes still not known to be involved. According to this reasoning, n was set to 2,112 (1,056 x 2) and p was set to 0.05.
The intersection approach retrieved 846 different genes. Since there are too many genes to process, we then added two supplementary approaches: union intersections and meta-analyses. In the end, 165 genes of interest were selected by the combination of the three approaches (Figure 3). Among these 165 genes, 41 were already known to be involved in the metastatic phenotype and 20 in the response to hypoxia (additional file 1). Here, we present detailed information about the up- or downregulation in metastasis or hypoxia and consistent expression profiles for 8 of the genes known to be involved in metastasis and 4 of the genes known to be involved in the response to hypoxia.
These genes include NR4A1 (nuclear receptor subfamily 4, group A, member 1) which is a nuclear receptor involved in cell differentiation,
Figure 4: Expression profiles of genes involved in metastasis. The X axis shows the two cell types compared: MCF-7 and MDA-MB-231. The Y axis shows the expression value that reflects the transcript level of the (A) NR4A1, (B) ASPM, (C) BCAT1, (D) RGS20, (E) ZFHX3, (F) CAV1, (G) GPC1 and (H) SMURF2 genes in the sample.
Citation: Pierre M, DeHertogh B, DeMeulder B, Bareke E, Depiereux S, et al. (2011) Enhanced Meta-analysis Highlights Genes Involved in Metastasis from Several Microarray Datasets. J Proteomics Bioinform 4: 036-043. doi:10.4172/jpb.1000164
proliferation and survival. Moreover, by migrating to mitochondria, NR4A1 allows BCL-2 (B-cell CLL/lymphoma 2) to trigger apoptosis. This is the reason why downregulation of NR4A1 leads to metastasis of cancer cells as they escape from apoptosis [25]. NR4A1 is clearly less expressed in MDA-MB-231 cells as shown in Figure 4A.
ASPM (asp (abnormal spindle) homolog, microcephaly associated (Drosophila)) is another gene retrieved by the methodology. Mutations of ASPM are responsible for microcephaly. Recent studies have suggested ASPM as an actor in the cell cycle and cell proliferation [26]. However, the diversity of its domains also suggests a large variety of biological functions. Overexpression of ASPM has been demonstrated to be a marker of metastasis as confirmed by the expression profile shown in Figure 4B.
BCAT1 (branched chain amino-acid transaminase 1, cytosolic) is also a gene of interest that shows clear upregulation in MDA-MB-231 cells in the expression profile in Figure 4C. BCAT1 codes for an enzyme responsible for the transamination of branched-chain alpha-keto acids to branched-chain L-amino acids occurring during cell growth. The upregulation of BCAT1 is a predictive factor for the development of metastases [27].
RGS20 (regulator of G-protein signaling 20) is a GTPase-activating protein involved in the regulation of signal transduction. A recent study showed a higher level of transcripts in metastatic melanomas than in primary melanomas [28]. The same observation was made between metastatic breast cancer cells and non-metastatic breast cancer cells in the expression profile in Figure 4D.
ZFHX3 (zinc finger homeobox 3) is another example of a gene selected by the methodology and already known to be involved in metastasis. Indeed, the protein encoded by ZFHX3 is a transcription factor that mediates cell differentiation and growth. It appears that ZFHX3 inhibits AFP (alpha-fetoprotein), which is often over-expressed in extremely malignant gastric cancers [29]. Thus, it is not surprising that transcript levels of ZFHX3 are very low in metastatic cancer cells as shown in the expression profile in Figure 4E.
CAV1 (caveolin 1, caveolae protein, 22kDa) plays a role in the formation of caveolae that are small lipid rafts responsible for vesicle trafficking, cholesterol homeostasis and signal transduction. High CAV1 levels have been linked with the metastatic phenotype as they lead to the secretion of MMP3 and MMP11 (matrix metalloproteinases 3 and 11) [30]. High CAV1 levels are also observed in MDA-MB-231 cells compared to MCF-7 cells in the expression profile in Figure 4F.
GPC1 (glypican 1) is a HBGF (heparin-binding growth factor) coreceptor found by the methodology and that shows high upregulation in metastatic breast cancer cells in the expression profile in Figure 4G. Studies have demonstrated that high levels of GPC1 lead to cancer metastasis [31].
As a last example of a gene selected by the methodology and validated by an expression profile (Figure 4H) comparing metastatic and non metastatic cancer cells, SMURF2 (SMAD specific E3 ubiquitin protein ligase 2) is an E3 ligase that induces a modification of ubiquitin to thus modulate the TNF-β (tumor necrosis factor) signal. High transcript levels of SMURF2 have been shown to be associated with high metastatic potential [32].
ADM (adrenomedullin) is the first example of a gene known to be involved in the response to hypoxia that was selected by the methodology. Figure 5A presents the upregulation of ADM under hypoxia. The ADM protein has been found in many cell types in different tissues such as the heart, lung, kidney and pancreas. Studies have shown that this protein has several functions including proliferation, differentiation, migration and regulation of blood pressure. Observations of upregulation under hypoxia, anti-apoptotic effects and promotion of angiogenesis suggest that ADM could be a major actor in the development of cancer [33].
MAP2K1 (mitogen-activated protein kinase kinase 1) is a kinase of the MAPK signal transduction pathway that is involved in various signaling of extracellular signals inside the cell. MAP2K1 can be activated through hypoxia to trigger cellular processes such as proliferation, migration and survival [34]. Figure 5B shows the upregulation of MAP2K1 under hypoxia.
Figure 5: Expression profiles of genes involved in hypoxia. The X axis shows the two conditions compared: hypoxia and normoxia in metastatic pancreatic cancer cells (L3.6pl). The Y axis shows the expression value that reflects the transcript level of the (A) ADM, (B) MAP2K1, (C) BHLHE40 and (D) SLC2A3 genes in the sample.
The transcription repressor BHLHE40 (basic helix-loop-helix family, member e40), which is a member of the bHLH leucine zipper family, shows upregulation under hypoxic condition in the expression profile (Figure 5C). This is consistent with the fact that BHLHE40 is a target of the HIF protein family and that in a lack of oxygen, overall transcription is repressed to save energy. The dimer form of BHLHE40 is involved in cell differentiation, circadian rhythms, immune regulation and carcinogenesis [35].
In conclusion, as a last example of a gene selected by the methodology and validated by an expression profile comparing hypoxia and normoxia in pancreatic cancer cells, we describe SLC2A3 (solute carrier family 2, member 3), better known as GLUT3 (glucose transporter type 3), a glucose carrier system. Surprinsingly, unlike GLUT1, GLUT3 is specific to neurons, but was picked out by the methodology. Studies have shown that the lack of oxygen or glucose is responsible for the upregulation of GLUT3, as presented in Figure 5D [36]. This upregulation allows the cell to switch from aerobic to anaerobic metabolism.
Many of the genes selected by the methodology are thus known to be involved in cancer, metastasis and/or hypoxia (additional file 1). These genes were classified into KEGG [21] and Biocarta (Biocarta) pathways by DAVID [19,20] and the same observation made at the gene level can also be made at the pathway level as many of these pathways are related to cancer or cell proliferation and motility. Indeed, DAVID retrieved 42 different pathways from the 165 genes of interest (Table 1) and a negative control composed of 1,000 tests demonstrated that there is less than a 1‰ chance of obtaining such results by chance (Figure 3). Among the 42 pathways, 12 are cancer pathways (Table 1). These 12 cancer pathways are “prostate cancer”, “pathways in cancer”, “melanoma”, “pancreatic cancer”, “chronic myeloid leukemia”, “glioma”, “colorectal cancer”, “endometrial cancer”, “non-small cell lung cancer”, “acute myeloid leukemia”, “renal cell carcinoma” and “small cell lung cancer”. All of these pathways are directly related to cancer since they reflect the molecular interactions of some types of cancer. The number of genes selected by the methodology and involved in these pathways varies between 3 and 12.
Taken together, these various arguments indicate the power of the proposed methodology. Hence, we suggest that the 74 genes (165 – 91) still not described to be implicated in cancer are potential new factors of tumor growth and particularly of metastasis induced by hypoxia. Surprisingly, DAVID [19,20] retrieved five pathways from the 165 genes of interest which are related to pathogen recognition and phagocytosis (Table 1). These pathways are “toll-like receptor signaling pathway”, “fMLP induced chemokine gene expression in HMC-1 cells”, “T cell receptor signaling pathway”, “Fc epsilon RI signaling pathway” and “Fc gamma R-mediated phagocytosis”. The first four were already discussed previously in Pierre et al. [15]. However, the Fc gamma R-mediated phagocytosis pathway was not. Fc gamma R-mediated phagocytosis is a major process set up by macrophages, neutrophils and monocytes to eliminate a pathogen threat. Following the extracellular recognition of a pathogen molecule by an Fc gamma receptor, an intracellular signal induces the development of a phagosome that then merges with lysosomes. Lysosomal proteases digest the pathogen. It is interesting to note that development of the phagosome requires regulation of the actin cytoskeleton [37,38], which was a pathway also retrieved by DAVID from the 165 genes of interest. This involvement could be the link between metastasis and Fc gamma R-mediated phagocytosis.
Though these pathways have not been previously reported to be involved in cancer, metastasis or hypoxia, they were selected by the methodology, and the 1,000 negative tests demonstrate that the
probability to obtain five pathways related to pathogen recognition and phagocytosis is equal to 1‰ since only one test gave results equal to those with the 165 genes of interest (Figure 3).
Further steps of this work include in vitro validation of the expression of the genes of interest in MDA-MB-231 and MCF-7 cell lines and functional analyses of the proteins encoded by the genes of interest. These approaches should open new doors to understand the metastasis process under hypoxic conditions.
We propose in this paper a major advance in a meta-analysis methodology. Here, we report the development and application of a statistic that sets a statistical threshold to the proposed approach, hence eliminating the need to make an arbitrary choice. In addition to our observation of results consistent with the studied phenomenon, a large negative control consisting of 1,000 random tests and two independent validations of expression profiles of the genes of interest support the ability of the methodology not only to retrieve genes already known to be involved in the phenomenon but to identify new reliable candidate genes.
Acknowledgements
M. Pierre is supported by FRIA (Belgium), B. DeMeulder is supported by Televie (Belgium) and S. Depiereux is supported by the FNRS (Belgian National Scientific Research Fund). We would like to thank P. Dagnelie for helpful discussions in the development of the intersection statistic. We would also like to thank J.J. LaPres (Biochemistry and Molecular Biology, Michigan State University, East Lansing) for providing the dataset GSE1056 and K.S. Hoek (Department of Dermatology, University Hospital of Zürich, Zürich) for providing the datasets GSE4840 and GSE4843.
References
1. Friedl P, Wolf K (2003) Tumour-cell invasion and migration: diversity and escape mechanisms. Nat Rev Cancer 3: 362-374.
2. Pantel K, Brakenhoff RH (2004) Dissecting the metastatic cascade. Nat Rev Cancer 4: 448-456.
3. Chan DA, Giaccia AJ (2007) Hypoxia, gene expression, and metastasis. Cancer Metastasis Rev 26: 333-339.
4. Sullivan R, Graham CH (2007) Hypoxia-driven selection of the metastatic phenotype. Cancer Metastasis Rev 26: 319-331.
5. Vaupel P (2004) The role of hypoxia-induced factors in tumor progression. Oncologist 9 Suppl 5: 10-17.
6. DeRisi JL, Iyer VR, Brown PO (1997) Exploring the metabolic and genetic control of gene expression on a genomic scale. Science 278: 680-686. 7. Benjamini Y, Hochberg Y (1995) Controlling the false discovery rate: A practical
and powerful approach to multiple testing. Journal of the Royal Statistical Society 57: 289-300.
8. Baldi P, Long AD (2001) A Bayesian framework for the analysis of microarray expression data: regularized t -test and statistical inferences of gene changes. Bioinformatics 17: 509-519.
9. Gautier L, Moller M, Friis-Hansen L, Knudsen S (2004) Alternative mapping of probes to genes for Affymetrix chips. BMC Bioinformatics 5: 111.
10. Liu H, Zeeberg BR, Qu G, Koru AG, Ferrucci A, et al. (2007) AffyProbeMiner: a web resource for computing or retrieving accurately redefined Affymetrix probe sets. Bioinformatics 23: 2385-2390.
11. Gur-Dedeoglu B, Konu O, Kir S, Ozturk AR, Bozkurt B, et al. (2008) A resampling-based meta-analysis for detection of differential gene expression in breast cancer. BMC Cancer 8: 396.
12. Ma S, Huang J (2009) Regularized gene selection in cancer microarray meta-analysis. BMC Bioinformatics 10: 1.
13. Ochsner SA, Steffen DL, Hilsenbeck SG, Chen ES, Watkins C, et al. (2009) GEMS (Gene Expression MetaSignatures), a Web resource for querying meta-analysis of expression microarray datasets: 17beta-estradiol in MCF-7 cells. Cancer Res 69: 23-26.
Citation: Pierre M, DeHertogh B, DeMeulder B, Bareke E, Depiereux S, et al. (2011) Enhanced Meta-analysis Highlights Genes Involved in Metastasis from Several Microarray Datasets. J Proteomics Bioinform 4: 036-043. doi:10.4172/jpb.1000164
14. Hunter KW, Crawford NP, Alsarraj J (2008) Mechanisms of metastasis. Breast Cancer Res 10 Suppl 1: S2.
15. Pierre M, DeHertogh B, Gaigneaux A, DeMeulder B, Berger F, et al. (2010) Meta-analysis of archived DNA microarrays identifies genes regulated by hypoxia and involved in a metastatic phenotype in cancer cells. BMC Cancer 10: 176.
16. Wu Z, Irizarry R, Gentleman R, Murillo F, Spencer F (2004) A model-based background adjustment for oligonucleotide expression arrays. Journal of the American Statistical Association 99: 909-917.
17. Berger F, De Hertogh B, Pierre M, Gaigneaux A, Depiereux E (2008) The “Window t test”: a simple and powerful approach to detect differentially expressed genes in microarray datasets. Central European Journal of Biology 3: 327-344.
18. De Hertogh B, De Meulder B, Berger F, Pierre M, Bareke E, et al. (2010) A benchmark for statistical microarray data analysis that preserves actual biological and technical variance. BMC Bioinformatics 11: 17.
19. Dennis G Jr, Sherman BT, Hosack DA, Yang J, Gao W, et al. (2003) DAVID: Database for Annotation, Visualization, and Integrated Discovery. Genome Biol 4: P3.
20. Huang da W, Sherman BT, Lempicki RA (2009) Systematic and integrative analysis of large gene lists using DAVID bioinformatics resources. Nat Protoc 4: 44-57.
21. Ogata H, Goto S, Sato K, Fujibuchi W, Bono H, et al. (1999) KEGG: Kyoto Encyclopedia of Genes and Genomes. Nucleic Acids Res 27: 29-34. 22. Ihaka R, Gentleman R (1996) R : a language for data analysis and graphics.
Journal of Computational and Graphical Statistics 5: 299-314.
23. Gentleman RC, Carey VJ, Bates DM, Bolstad B, Dettling M, et al. (2004) Bioconductor: open software development for computational biology and bioinformatics. Genome Biol 5: R80.
24. Dagnelie P (2007) Statistique théorique et appliquée. Bruxelles: De Boeck et Larcier.
25. Liu J, Zhou W, Li SS, Sun Z, Lin B, et al. (2008) Modulation of orphan nuclear receptor Nur77-mediated apoptotic pathway by acetylshikonin and analogues. Cancer Res 68: 8871-8880.
26. Lin SY, Pan HW, Liu SH, Jeng YM, Hu FC, et al. (2008) ASPM is a novel marker for vascular invasion, early recurrence, and poor prognosis of hepatocellular carcinoma. Clin Cancer Res 14: 4814-4820.
27. Yoshikawa R, Yanagi H, Shen CS, Fujiwara Y, Noda M, et al. (2006) ECA39
is a novel distant metastasis-related biomarker in colorectal cancer. World J Gastroenterol 12: 5884-5889.
28. Riker AI, Enkemann SA, Fodstad O, Liu S, Ren S, et al. (2008) The gene expression profiles of primary and metastatic melanoma yields a transition point of tumor progression and metastasis. BMC Med Genomics 1: 13. 29. Zhang Z, Yamashita H, Toyama T, Sugiura H, Ando Y, et al. (2005) ATBF1-a
messenger RNA expression is correlated with better prognosis in breast cancer. Clin Cancer Res 11: 193-198.
30. Du ZM, Hu CF, Shao Q, Huang MY, Kou CW, et al. (2009) Upregulation of caveolin-1 and CD147 expression in nasopharyngeal carcinoma enhanced tumor cell migration and correlated with poor prognosis of the patients. Int J Cancer 125: 1832-1841.
31. Aikawa T, Whipple CA, Lopez ME, Gunn J, Young A, et al. (2008) Glypican-1 modulates the angiogenic and metastatic potential of human and mouse cancer cells. J Clin Invest 118: 89-99.
32. Jin C, Yang YA, Anver MR, Morris N, Wang X, et al. (2009) Smad ubiquitination regulatory factor 2 promotes metastasis of breast cancer cells by enhancing migration and invasiveness. Cancer Res 69: 735-740.
33. Keleg S, Kayed H, Jiang X, Penzel R, Giese T, et al. (2007) Adrenomedullin is induced by hypoxia and enhances pancreatic cancer cell invasion. Int J Cancer 121: 21-32.
34. Wang K, Jiang YZ, Chen DB, Zheng J (2009) Hypoxia enhances FGF2- and VEGF-stimulated human placental artery endothelial cell proliferation: roles of MEK1/2/ERK1/2 and PI3K/AKT1 pathways. Placenta 30: 1045-1051. 35. Choi SM, Cho HJ, Cho H, Kim KH, Kim JB, et al. (2008) Stra13/DEC1 and
DEC2 inhibit sterol regulatory element binding protein-1c in a hypoxia-inducible factor-dependent mechanism. Nucleic Acids Res 36: 6372-6385.
36. Bruckner BA, Ammini CV, Otal MP, Raizada MK, Stacpoole PW (1999) Regulation of brain glucose transporters by glucose and oxygen deprivation. Metabolism 48: 422-431.
37. May RC, Machesky LM (2001) Phagocytosis and the actin cytoskeleton. J Cell Sci 114: 1061-1077.
38. Groves E, Dart AE, Covarelli V, Caron E (2008) Molecular mechanisms of phagocytic uptake in mammalian cells. Cell Mol Life Sci 65: 1957-1976. 39. Biocarta. Biocarta Pathways.
40. NCBI. Entrez Global Query Cross-Database Search System. 41. NCBI. 2000. Gene Expression Omnibus.