RESEARCH OUTPUTS / RÉSULTATS DE RECHERCHE
Author(s) - Auteur(s) :
Publication date - Date de publication :
Permanent link - Permalien :
Rights / License - Licence de droit d’auteur :
Bibliothèque Universitaire Moretus Plantin
Dépôt Institutionnel - Portail de la Recherche
researchportal.unamur.be
University of Namur
The effects of spatial population dataset choice on estimates of population at risk of
disease
Tatem, Andrew J.; Campiz, Nicholas; Gething, Peter W.; Snow, Robert W.; Linard, Catherine
Published in:
Population Health Metrics DOI:
10.1186/1478-7954-9-4
Publication date: 2011
Document Version
Publisher's PDF, also known as Version of record
Link to publication
Citation for pulished version (HARVARD):
Tatem, AJ, Campiz, N, Gething, PW, Snow, RW & Linard, C 2011, 'The effects of spatial population dataset choice on estimates of population at risk of disease', Population Health Metrics, vol. 9, 4.
https://doi.org/10.1186/1478-7954-9-4
General rights
Copyright and moral rights for the publications made accessible in the public portal are retained by the authors and/or other copyright owners and it is a condition of accessing publications that users recognise and abide by the legal requirements associated with these rights. • Users may download and print one copy of any publication from the public portal for the purpose of private study or research. • You may not further distribute the material or use it for any profit-making activity or commercial gain
• You may freely distribute the URL identifying the publication in the public portal ?
Take down policy
If you believe that this document breaches copyright please contact us providing details, and we will remove access to the work immediately and investigate your claim.
R E S E A R C H
Open Access
The effects of spatial population dataset choice
on estimates of population at risk of disease
Andrew J Tatem
1,2,3*, Nicholas Campiz
1, Peter W Gething
4, Robert W Snow
5,6, Catherine Linard
4,7Abstract
Background: The spatial modeling of infectious disease distributions and dynamics is increasingly being undertaken for health services planning and disease control monitoring, implementation, and evaluation. Where risks are heterogeneous in space or dependent on person-to-person transmission, spatial data on human population distributions are required to estimate infectious disease risks, burdens, and dynamics. Several different modeled human population distribution datasets are available and widely used, but the disparities among them and the implications for enumerating disease burdens and populations at risk have not been considered systematically. Here, we quantify some of these effects using global estimates of populations at risk (PAR) of P. falciparum malaria as an example.
Methods: The recent construction of a global map of P. falciparum malaria endemicity enabled the testing of different gridded population datasets for providing estimates of PAR by endemicity class. The estimated population numbers within each class were calculated for each country using four different global gridded human population datasets: GRUMP (~1 km spatial resolution), LandScan (~1 km), UNEP Global Population Databases (~5 km), and GPW3 (~5 km). More detailed assessments of PAR variation and accuracy were conducted for three African countries where census data were available at a higher administrative-unit level than used by any of the four gridded population datasets.
Results: The estimates of PAR based on the datasets varied by more than 10 million people for some countries, even accounting for the fact that estimates of population totals made by different agencies are used to correct national totals in these datasets and can vary by more than 5% for many low-income countries. In many cases, these variations in PAR estimates comprised more than 10% of the total national population. The detailed country-level assessments suggested that none of the datasets was consistently more accurate than the others in
estimating PAR. The sizes of such differences among modeled human populations were related to variations in the methods, input resolution, and date of the census data underlying each dataset. Data quality varied from country to country within the spatial population datasets.
Conclusions: Detailed, highly spatially resolved human population data are an essential resource for planning health service delivery for disease control, for the spatial modeling of epidemics, and for decision-making processes related to public health. However, our results highlight that for the low-income regions of the world where disease burden is greatest, existing datasets display substantial variations in estimated population distributions, resulting in uncertainty in disease assessments that utilize them. Increased efforts are required to gather contemporary and spatially detailed demographic data to reduce this uncertainty, particularly in Africa, and to develop population distribution modeling methods that match the rigor, sophistication, and ability to handle uncertainty of contemporary disease mapping and spread modeling. In the meantime, studies that utilize a particular spatial population dataset need to acknowledge the uncertainties inherent within them and consider how the methods and data that comprise each will affect conclusions.
* Correspondence: [email protected]
1Department of Geography, University of Florida, Gainesville, USA
Full list of author information is available at the end of the article
© 2011 Tatem et al; licensee BioMed Central Ltd. This is an Open Access article distributed under the terms of the Creative Commons Attribution License (http://creativecommons.org/licenses/by/2.0), which permits unrestricted use, distribution, and reproduction in any medium, provided the original work is properly cited.
Background
Defining the extent of infectious diseases as a public health burden and their distribution and dynamics in time and space are critical to disease monitoring, con-trol, and decision-making. The epidemiology of many diseases makes surveillance-based methods for estimat-ing populations at risk and disease burden problematic [1-3], while spatial heterogeneity in human population distribution can produce significant effects on transmis-sion [4,5]. Cartographic and spatial modeling approaches have proven to be effective in tackling these factors [6-8]. Such approaches can help characterize large-scale patterns of disease spread to evaluate intervention impact [4] and produce globally consistent measures of morbidity of known fidelity, often the only plausible method in many African countries where surveillance data are incomplete, unreliable, and inconsistent [1,9,10]. However, any approach that requires the use of modeled disease rates or dynamics to estimate risk requires reasonable information on the distributions of resident populations. Where risks and the spread of dis-eases are heterogeneous in space, population distribu-tions and counts must be resolved to reasonably high levels of spatial detail.
National census population data have often been represented as continuous gridded population distribu-tion (or count) datasets through the use of spatial inter-polation algorithms. Four differing approaches to the interpolation of census data have been used to create four different global population distribution databases at spatial resolutions of finer than 1 degree, each of which has been used in epidemiological studies. These are LandScan [11], the Gridded Population of the World (GPW) [12], the Global Rural Urban Mapping Project (GRUMP) [13], and the United Nations Environment Programme (UNEP) Global Population Databases [14]. Features of each dataset are outlined in Table 1, their
full extents are mapped in Additional file 1, Figure S1, and each is discussed in more detail below.
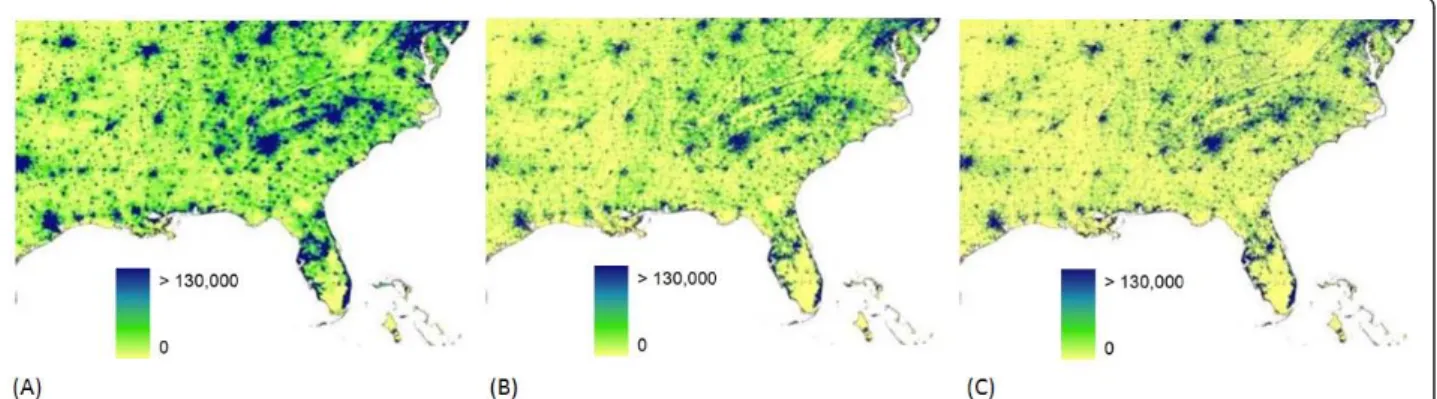
Population census data are the core inputs to spatial population databases and, for many countries, contem-porary census data collected at a high administrative-unit level exist to facilitate detailed and precise popula-tion mapping. For the majority of low-income countries of the world, however, spatially detailed, contemporary census data to facilitate such detailed mapping do not exist. This is especially true for much of Africa. Census data used for the production of global products are more than a decade old in 38 of 56 African countries and, at administrative boundary levels, just one or two levels finer than national level in 44 countries [15]. The poor quality of the inputs propagates differently through the four modeled human population distributions, as contrasted by maps of the different distributions from the southeastern United States (Figure 1) and for central Africa (Figure 2). The population distributions for the southeastern United States quantified by the GPW, GRUMP, and LandScan datasets appear very similar, where highly resolved census tract-level count data pro-vide the main input. Such detailed representations often prompt misconceptions that population distribution is now known and mapped accurately for the entire world [4,16]. The same population density datasets for central Africa highlight the differences, however, where input census data vary substantially in quality (Figure 2). The differing approaches to the spatial interpolation of poorly resolved census data produce very different spa-tial configurations of population.
Each of the four spatial population datasets has been used extensively in epidemiological studies during the past two decades (Table 2). Different authors have used different population datasets for the same purpose, yet the accuracies, variations, and effects upon results that this choice entails have yet to be examined. Applications
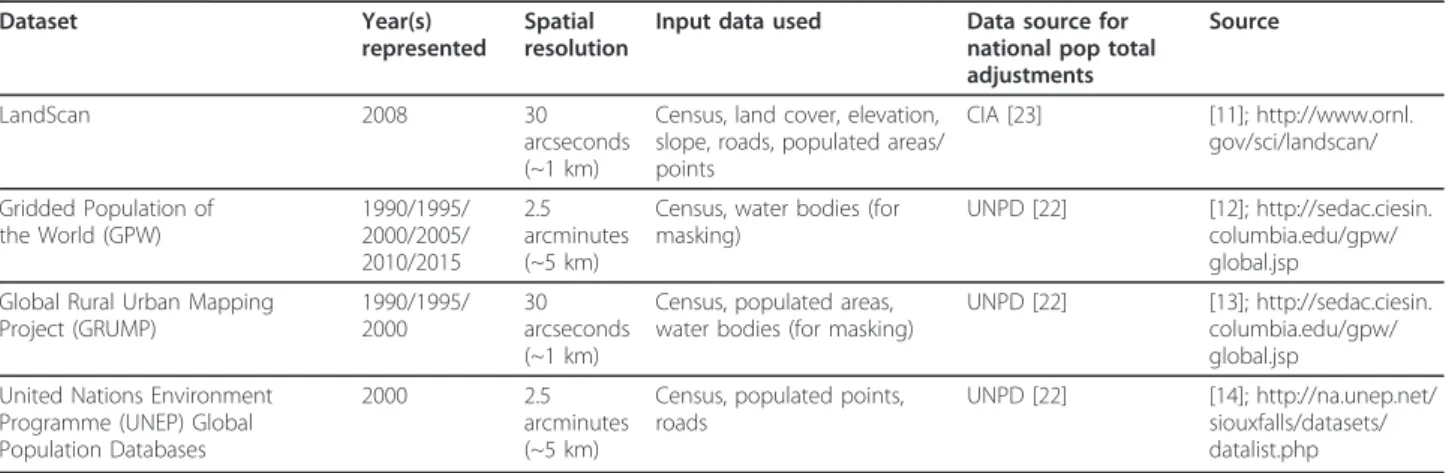
Table 1 Gridded population datasets and their characteristics
Dataset Year(s) represented
Spatial resolution
Input data used Data source for national pop total adjustments
Source
LandScan 2008 30 arcseconds (~1 km)
Census, land cover, elevation, slope, roads, populated areas/ points CIA [23] [11]; http://www.ornl. gov/sci/landscan/ Gridded Population of the World (GPW) 1990/1995/ 2000/2005/ 2010/2015 2.5 arcminutes (~5 km)
Census, water bodies (for masking)
UNPD [22] [12]; http://sedac.ciesin. columbia.edu/gpw/ global.jsp Global Rural Urban Mapping
Project (GRUMP) 1990/1995/ 2000 30 arcseconds (~1 km)
Census, populated areas, water bodies (for masking)
UNPD [22] [13]; http://sedac.ciesin. columbia.edu/gpw/ global.jsp United Nations Environment
Programme (UNEP) Global Population Databases
2000 2.5 arcminutes (~5 km)
Census, populated points, roads
UNPD [22] [14]; http://na.unep.net/ siouxfalls/datasets/ datalist.php
Figure 1 Population distribution for the southeast United States as mapped by three different datasets. The datasets shown are (A) GPW (B) GRUMP (C) LandScan. The UNEP Global Population Databases product is not represented here as it does not cover the USA. The values shown are estimates of persons per grid square.
Figure 2 Population distribution for central and east Africa as mapped by four different datasets. The datasets shown are (A) GPW (B) GRUMP (C) LandScan (D) UNEP, and the values shown are estimates of persons per grid square.
have involved estimating numbers of clinical cases, spread modeling, risk mapping, quantifying the effects of urbanization, and studying diseases ranging from den-gue and yellow fever to HIV and leprosy. The most widespread use of gridded population datasets in an epi-demiological context has been in the study of malaria (Table 2) with a variety of purposes (Additional file 1, Table S1). All four global datasets used to derive esti-mates have been used to estimate populations at risk (PAR) of malaria, forming a fundamental metric for decision-makers at national and international levels [9,17]. Here, to illustrate the effects of spatial population dataset choice in an applied epidemiological setting, we undertake a set of analyses to quantify the spatial varia-tion and sizes of absolute and relative differences in PAR of P. falciparum malaria that can be obtained through the use of differing population datasets. We then discuss how these differences arise, their likely translation to other disease systems, and approaches to dealing with the uncertainties in large-scale spatial population datasets.
Methods
Assessment of the effects of spatial population data-set choice on estimates of populations at risk of
P. falciparum is undertaken here through three steps: (i) gathering existing spatial population datasets; (ii) over-layingP. falciparum transmission maps onto each popu-lation dataset, extracting popupopu-lations at risk and quantifying the range of estimates achievable; (iii) and assessing which population modeling method results in more accurate estimates of populations at risk in three test countries where population distribution is known with greater precision than the input data used in con-struction of the datasets being tested. The datasets and methods used for each of these steps are described in detail in the following sections.
Global spatial population datasets
Analyses here focus on the four datasets most com-monly used in disease-related studies, and principally on LandScan and GRUMP, the most contemporary and widely used datasets (Table 2). These two datasets have become more widely used in epidemiology due to their finer spatial resolution than GPW and UNEP, the fact that UNEP has not been updated for more than a dec-ade, and the inclusion of urban extents in GRUMP that improves mapping precision over GPW [18]. Inputs to and outputs of the four datasets differ (Table 1, Figures 1-2). We do not consider here coarse datasets (1 degree
Table 2 Disease-related studies that have utilized large area gridded population datasets
Disease Application Population map used [Reference]
Malaria Populations at risk GPW [47-52], LandScan [53,54], UNEP [55], GRUMP [24,25,28,30-32,56-58] Clinical cases GPW [59], GRUMP [8]
Intervention coverage GRUMP [60] Funding coverage GRUMP [57,61]
Risk mapping GPW [62-64], UNEP [65], GRUMP [66] Infection movements GRUMP [29,30]
Urbanization effects GPW [67], GRUMP [15] Hookworm Populations at risk GPW [68,69]
Influenza Epidemic modeling GPW [70-73], LandScan [7,74,75], GRUMP [76] Risk mapping LandScan [77,78]
Yellow fever Populations at risk GRUMP [79] Dengue Populations at risk GRUMP [79]
Risk mapping USGS [21], LandScan [80,81] Filariasis Populations at risk UNEP [82]
Helminths Populations at risk GPW [52,83], UNEP [84] Bovine TB Risk mapping LandScan [85,86], GPW [86] Trypanosomiasis Risk mapping UNEP [87]
Onchocerciasis Populations at risk GPW [88] Leprosy Risk mapping GPW [89] HIV Prevalence analyses LandScan [90] General Trends in emerging diseases GPW [91]
Health of schoolchildren UNEP [92]
GPW = Gridded Population of the World, GRUMP = Global Rural Urban Mapping Project, UNEP = United Nations Environment Programme Global Population Databases, USGS = United States Geological Survey Population datasets.
spatial resolution or coarser), such as that outlined by Li et al [19], that have occasionally been used in disease-related studies [20,21]. Table 1 provides references and Web links for detail on each spatial population dataset, and each is shown in Additional file 1, Figure S1.
In constructing the global population datasets, the use of census counts provided by national statistics offices and resulting intercensal growth rates lead to a patch-work of datasets, methods, and total national counts that are different from widely used and standardized estimates made by international agencies [22,23]. Thus, each product is adjusted to match national totals esti-mated by one of these agencies for the product year in question. LandScan adjusts its totals to match those esti-mates made by the Central Intelligence Agency (CIA) [23], while the remaining datasets adjust to the United Nations Population Division (UNPD) estimates [22]. Dif-ferences in estimates made by these different agencies translate into differences in PAR, numbers in suscepti-ble, infected, and recovered model groups, and many other epidemiological measures. Initially, therefore, 2010 national population estimates made by the CIA and UNPD were obtained and the differences explored.
Assessing variations in global PAR ofP. falciparum malaria
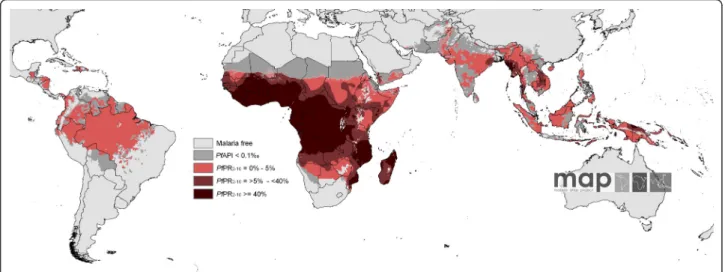
The Malaria Atlas Project has recently published revised global limits of unstable and stable P. falciparum infec-tion risk [24] and a modeled, mapped distribuinfec-tion of the intensity of P. falciparum within the stable margins of transmission based upon infection prevalence among children aged 2 to 10 years (Pf PR2-10) [25]. In brief, data
on national case reporting, national and international medical intelligence, climate, and aridity were used to define conservatively the margins of stable and unstable P. falciparum transmission [24]. Stable malaria transmis-sion was assumed to represent a minimum average of 1 clinical case per 10,000 population per annum (pa) in a given administrative unit. Unstable malaria transmission was used to define areas where transmission was biolo-gically plausible and/or had been documented but where incidence was likely to be less than 1 case per 10,000 population pa. In Africa, this was largely in areas where aridity limits the survival of larvae and causes desicca-tion of adult vectors. Finally, no transmission was assumed where assembled intelligence stated no malaria risk because (1) national reporting systems had, over several years, not reported a single P. falciparum clinical case, or (2) where temperatures were too low for spor-ogony to complete within the average lifespan of the local dominant vector species. Within the stable trans-mission margins, empirical community survey data on parasite prevalence were assembled and geolocated to
provide the basis for an urban-rural and sample-size-adjusted geospatial model within a Bayesian framework to interpolate a continuous space-time posterior predic-tion of Pf PR2-10 for every 5 × 5 km pixel for the year
2007 [25]. This model also generated classified output that assigned each pixel to one of four malaria endemi-city classes: malaria-free or unstable, Pf PR2-10 <5%;
Pf PR2-10= 5% to 40%; and Pf PR2-10>40% (Figure 3).
These classifications of stable transmission correspond to ranges ofPf PR that have been proposed in the selec-tion of suites of intervenselec-tions at scale to reach control targets at different time periods [26,27].
The transmission classes mapped in Figure 3 have been used in previous studies to estimate PAR using the GRUMP dataset [8,25,28-30]. Here, we examine the dif-ferences that can be obtained using alternative popula-tion datasets (Table 1). Though there exist more appropriate measures for calculating PAR that are con-sistent with theP. falciparum malaria endemicity sur-face and that integrate the uncertainty inherent in the PfPR2-10estimates [31], here we compare geographical
information system (GIS) overlays as done by the vast majority of previous studies (Table 2).
We obtained the population count dataset (Table 1) closest in time, at the time of writing, to 2007, the year represented by theP. falciparum endemicity class map. For LandScan, this was the 2007 version. For GPW3, this was the 2005 version. For GRUMP, this was the 2000 beta version. And for UNEP, this was the 2000 product. GPW3, GRUMP, and UNEP were thus projected forward to 2007, applying national, medium variant, intercensal growth rates by country [22], using methods described previously [18], and undertaken in many previous PAR estimation studies [8,18,24,25,28-32]. ThePf PR2-10
trans-mission classes were overlaid onto the four population datasets, and per-country PARs for each class were extracted for analysis.
As described above, the population datasets outlined in Table 1 adjust their national totals to estimates made by differing agencies. Thus, differences in PAR estimates reflect both these adjustments to differing totals, as well as differences in the census unit disaggregation methods. To isolate and examine the effect of different disaggre-gation methods, population totals were linearly adjusted to common totals (in this case, those defined by the UNPD [22]) maintaining the endemicity class propor-tions extracted. Thus, two sets of analyses were underta-ken: those that examined PAR differences based on the unadjusted native products, as undertaken in epidemio-logical studies to date (Table 2), and those that exam-ined PAR differences based on adjusting national populations to a common total to examine the effect of differing census data disaggregation approaches.
National-level assessments of PAR estimates
Validation and accuracy assessment of high-resolution population data is challenging because few independent data are generally available for testing or ground-truth-ing. Uncertainties creep into the estimates due to errors in the inputs, resulting in input-dependent uncertainty, and the subjective nature of the estimation or modeling process, causing process-dependent uncertainty.
More detailed assessments of PAR of P. falciparum malaria variation were possible, however, for three Afri-can countries where data on census counts or official population estimates were reported at a higher adminis-trative-unit level than those used in the construction of each of the four gridded population datasets: Mali, Namibia, and Tanzania. Data on population counts from the 2009 Mali census at commune level (administrative level 3) were obtained from the Institut National de la Statistique du Mali and matched to administrative-unit data from the Global Administrative Areas Project (http://www.gadm.org). The global population datasets used cercle-level (administrative level 2) data for Mali. For Namibia, 2001 census data matched to enumeration area (administrative level 4) boundaries were obtained from the Namibian Ministry of Health and Social Ser-vices and were substantially more detailed than the con-stituency level (administrative level 2) data used in the construction of the LandScan, GPW, GRUMP, and UNEP datasets. Finally, 2002 census data at ward level (administrative unit level 3) for Tanzania were down-loaded from the International Livestock Research Insti-tute (http://64.95.130.4/gis/search.asp?id=442), a level finer than that used in the construction of the global
population datasets. Additional file 1, Figure S3 shows the administrative boundaries of the census data for each of the three countries.
Each country spans two or moreP. falciparum trans-mission classes (Additional file 1, Figure S3), providing a good test of how each existing dataset had quantified PAR in a range of transmission settings and between classes. Moreover, both the input census or estimate data used in construction of the existing population datasets and the data for assessment for the three coun-tries cover a wide range of administrative levels and average spatial resolutions (ASRs).
For each country, the detailed population data were pro-jected forward to 2007 to match the malaria data, using the same growth rates described in the previous section. PAR estimates from the census data were then calculated by overlaying theP. falciparum malaria class map onto the detailed census data and calculating the proportion of each class covering each unit. Populations were assigned to each class based on these proportions. Given the small size of the units in most of the detailed census data, the vast majority of units belonged wholly to one class. The resulting PAR estimates represented refined estimates of PAR for each of the three countries that could be com-pared to those derived from GRUMP, GPW, LandScan, and UNEP. These comparisons were undertaken through calculation of root mean square errors (RMSEs) between the per-unit PARs in the fine-resolution datasets and those estimated by the four spatial population datasets. As in the previous section, analyses were undertaken on the three datasets both adjusted to common national totals [22] and those left unadjusted.
Figure 3 The spatial distribution ofP. falciparum malaria PfPR2-10 predictions stratified by endemicity class. They are categorized as low risk PfPR2-10 <5%, light red; intermediate risk PfPR2-10 = 5% to 40%, medium red; and high risk PfPR2-10 >40%, dark red. The map shows the class to which PfPR2-10 has the highest predicted probability of membership. The rest of the land area was defined as unstable risk (medium gray areas, where PfAPI = 0.1 per 1,000 pa) or no risk (light gray).
Results
Estimates of national population totals
The results of comparing national population totals esti-mated by the UNPD (as used for GPW, GRUMP, and UNEP GRID) with those estimated by the CIA (as used in LandScan) are outlined in Figure 4. The map shows the relative effects on population totals, in percentage terms, of changing from a population dataset adjusted to UNPD totals to one adjusted to CIA totals. The dif-ferences that can result from such adjustments are evi-dent when considering the extreme case of Angola, where the UNPD estimates a total 2010 population of 18,993,000, while the CIA estimates just 13,068,161, a reduction of 31%. Elsewhere, differences are smaller, but a large number of countries show absolute differences of greater than 5%. Moreover, a clear pattern is evident, with estimates for low-income countries, particularly those in sub-Saharan Africa, varying by greater amounts than for the higher-income regions. For countries defined as “least developed” [22], the average absolute difference is 6.2%, which is significantly different (p < 0.05) from the average absolute difference of 4.3% for the remaining countries.
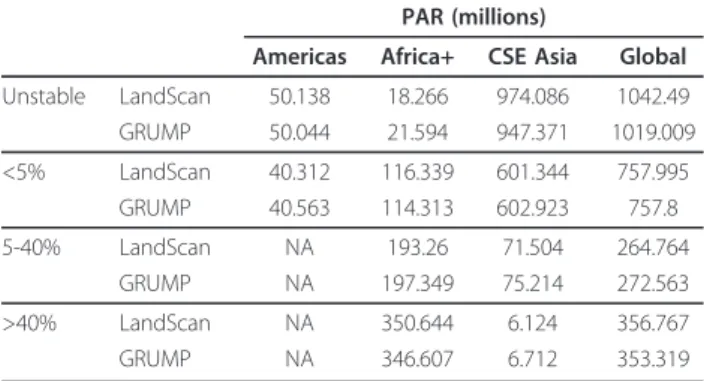
Variations inP. falciparum PAR
At global and continental scales, Table 3 shows that the choice of population dataset makes only relatively small differences in the estimated proportions at risk, with GRUMP and LandScan estimating roughly similar bers (Additional file 1, Table S2 shows the estimated num-bers at risk using all four population datasets, and Additional file 1, Table S3 shows concordance correlation coefficients [33] for the per-country PAR estimates made
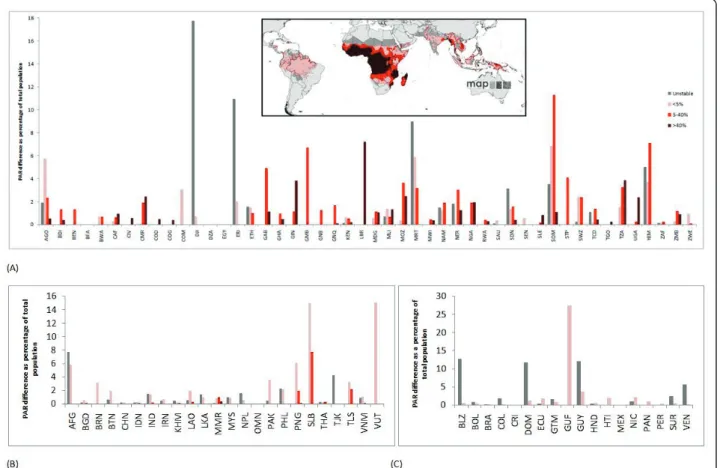
by each of the four datasets). However, these estimates mask the much more substantial country-scale variations. Figure 5 summarizes these relative variations (in percen-tage terms for comparability) in nationalP. falciparum PAR using the two most widely used population datasets in disease studies today, LandScan and GRUMP, adjusted to common national totals. Additional file 1, Figure S2 shows the results for the unadjusted analyses, and there were few differences from Figure 5 because a linear adjust-ment of population totals results in minimal effects on proportions of the total population residing in different transmission zones. The largest percentage differences occur for the smallest countries, as expected, as relatively small differences in PAR translate to large percentage dif-ferences in these cases. Many larger countries, especially in sub-Saharan Africa, also display differences in PAR esti-mates for certain classes of near to or greater than 5%.
Figure 4 The differences between national population totals for 2010 estimated by the UNPD and the CIA. The differences are shown as a percentage change from national population totals estimated by the UNPD.
Table 3 Total estimated populations at risk (PAR) ofP. falciparum malaria in each class by region and in total for the GRUMP and LandScan population datasets
PAR (millions)
Americas Africa+ CSE Asia Global Unstable LandScan 50.138 18.266 974.086 1042.49 GRUMP 50.044 21.594 947.371 1019.009 <5% LandScan 40.312 116.339 601.344 757.995 GRUMP 40.563 114.313 602.923 757.8 5-40% LandScan NA 193.26 71.504 264.764 GRUMP NA 197.349 75.214 272.563 >40% LandScan NA 350.644 6.124 356.767 GRUMP NA 346.607 6.712 353.319
These include Angola, Gabon, Liberia, Mozambique, Mauritania, Somalia, Tanzania, and Yemen. Moreover, though relative differences in PAR achievable through switching between LandScan and GRUMP for a large country such as Nigeria are only about 2% for the two transmission classes covering the country, in absolute terms, this translates to differences of more than 3 million people. Figure 6 plots these differences in absolute terms for thePfPR >40% class, through using all four population datasets described in Table 1 and unadjusted to common national totals to highlight the kinds of variations that past studies (Table 2) would have achieved through considering alternative population datasets. For clarity, Nigeria and the Democratic Republic of the Congo are not shown, but the graph highlights again how estimates of those residing in the highestP. falciparum transmission zones differ by many millions for countries with the highest numbers at risk.
National-level assessments of PAR estimates
Results of the adjusted national-level assessments in Table 4 suggest that none of the modeling approaches
used is consistently more accurate than the others. LandScan or GRUMP, however, which are more recent products and resolved to finer spatial resolutions than GPW and UNEP GRID, were the closest to the fine-resolution PAR estimates in each case. An older, more comprehensive assessment found GRUMP to be a more accurate representation of population distribution for Kenya [18], but in this case, GRUMP and GPW utilized a higher administrative-unit level of census data as input compared to UNEP and LandScan. The results of the analyses on the unadjusted datasets are presented in Additional file 1, Table S4, with few differences from Table 4 because a linear adjustment of population totals results in minimal effects on proportions of the total population residing in different transmission zones. Discussion
The use of global positioning systems (GPS) and GIS in disease surveys and reporting is becoming increasingly routine, enabling a better understanding of the spatial epidemiology of diseases. In turn, the increased avail-ability of spatially referenced epidemiological data is
Figure 5 Variations in estimates of population at risk ofP. falciparum achievable using LandScan and GRUMP. Here, the LandScan and GRUMP datasets were adjusted to ensure that national population totals matched those provided by the UN [22]. The difference in PAR estimates are presented as a percentage of total national population (UN estimates), and shown for (A) Africa+, (B) CSE Asia, and (C) the Americas. The ISO country abbreviation for country name is used (http://www.iso.org/iso/english_country_names_and_code_elements).
driving the rapid expansion of disease mapping and spa-tial modeling methods, which are becoming increasingly detailed and sophisticated, with rigorous handling of uncertainties built in. This expansion has not been matched by advancements in the development of spatial datasets of human population distribution that so often accompany disease maps or spatial models in analyses.
Since the initial development of global spatial popula-tion databases in the 1990s, they have enjoyed wide
application across multiple fields of research and appli-cation [13,34], and in the late 1990s were first applied for estimating populations at risk of disease (Table 2). Since then, the use of spatial population datasets in epi-demiological studies has become widespread. Table 2 shows how the different population datasets analyzed here have been used for undertaking similar analyses, yet few studies justify their choice of dataset, and none has assessed the effects of changing to an alternative
Figure 6 Plot showing the range of estimates of PAR achievable using four different population datasets. The plot shows the mean (red circle) and range (black bar) of estimates of populations at risk of PfPR >40% in 2007 achievable using the four population datasets outlined in Table 1. Nigeria (Maximum: 117,672,000, Mean: 112,564,250, Minimum: 101,283,000) and the Democratic Republic of the Congo (Maximum: 56,767,900, Mean: 52,775,275, Minimum: 44,555,900) are not shown here, as their PARs are significantly larger than the other countries. The ISO country abbreviation for country name is used (http://www.iso.org/iso/english_country_names_and_code_elements).
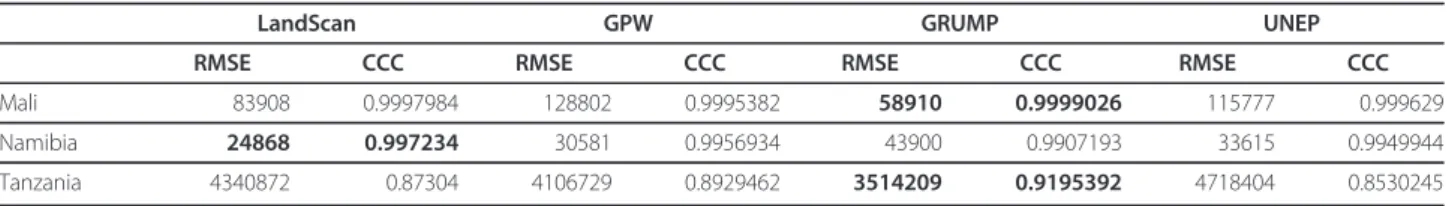
Table 4 Error statistics for comparison ofP. falciparum populations at risk (PAR) derived from spatial population datasets versus detailed census data
LandScan GPW GRUMP UNEP RMSE CCC RMSE CCC RMSE CCC RMSE CCC Mali 83908 0.9997984 128802 0.9995382 58910 0.9999026 115777 0.999629 Namibia 24868 0.997234 30581 0.9956934 43900 0.9907193 33615 0.9949944 Tanzania 4340872 0.87304 4106729 0.8929462 3514209 0.9195392 4718404 0.8530245
Root mean square error (RMSE) and concordance correlation coefficient (CCC) [33] statistics are shown for comparison of P. falciparum PAR estimates derived from the four spatial population datasets against the estimates derived from the detailed census data for three countries. The lowest RMSEs and highest CCCs for each country are in bold. Here, the spatial population datasets were adjusted to ensure that national population totals matched those provided by the UN [22]. GPW = Gridded Population of the World, GRUMP = Global Rural Urban Mapping Project, UNEP = United Nations Environment Programme Global Population Databases.
dataset on results. Results here show that, in the context of an endemic, vector-borne disease, the choice of spa-tial population dataset can have substanspa-tial effects on estimates of populations at risk of disease, particularly for low-income countries where estimates of national population totals are uncertain, census data used in dataset construction are often outdated and of coarse resolution, and national totals are adjusted to differing sizes. Our results also show that assessing which dataset to use remains a difficult task, with tests here showing that none of the datasets was consistently more accurate than others in estimating PAR of P. falciparum malaria for the three test countries.
The results presented are focused on the quantifica-tion of PAR of P. falciparum malaria. However, it is clear that the implications translate to other types of malaria and other endemic, vector-borne diseases, espe-cially those for which spatial population data are already being used to derive population at risk estimates (Table 2). Moreover, as funding for disease mapping continues to grow, the need for accurate spatial popula-tion distribupopula-tion data will also grow if denominator-reliant metrics are required. The effect size of spatial population dataset choice on the outputs of spatial mod-els of directly transmitted disease spread will be a func-tion of the aims of the modeling exercise. However, in any case where spatial population data are used to derive “synthetic populations,” for instance in those influenza modeling studies listed in Table 2, there can be no doubt that running such models on the greatly differing distributions in Figure 2 would produce differ-ing epidemiological landscapes and resultant estimated patterns and timings of spread. Calculating metrics on exactly how significant an effect the choice of spatial population dataset used would have on such model pre-dictions is beyond the scope of this article and requires further study. However, the uncertainties inherent in the population datasets are rarely acknowledged and clearly feed into any outputs.
The levels of uncertainty inherent in the sparse disease data used, for instance, to construct maps or parameter-ize epidemic models may be greater than the uncer-tainty levels that exist within the spatial population datasets used with them [4,31]. However, the level of uncertainty in the denominator is rarely considered or mentioned. The importance of considering this is under-lined by Figures 4, 5 and 6, where, taking the extreme case of Angola, changing from using GRUMP to Land-Scan produces a relative drop of more than 30% in population size, meaning substantially fewer people at risk of endemic disease or susceptible to emerging dis-eases. After accounting for this difference, results here show that estimates of PAR ofP. falciparum malaria for differing transmission classes can change by a further
6%. The uncertainties that exist in estimating total populations residing in some nations likely have sub-stantial implications on estimates of disease risk, burden, and spread, but these go unacknowledged. The differ-ence in estimates of the total population of Angola between the UNPD and the CIA, and the substantial differences for many other low-income countries, high-lights that even those nonspatial disease burden esti-mates reliant on national or per-district denominators [9,35-37] must be cautious and account for uncertainties in the denominator. In many low-income countries, more than 10 years has passed since the last population census (http://unstats.un.org/unsd/demographic/sources/ census/censusdates.htm, [15]), and significant uncer-tainty exists regarding how many people reside in them.
Ideally, a definitive answer to the question of which modeling approach produces superior population distri-bution mapping accuracy would provide valuable gui-dance on choosing datasets. Results here, however, show that obtaining this answer is nearly impossible because the most detailed data generally are used in construction of the population datasets, leaving little independent data for testing. Comparisons with the basic assessments undertaken for a few countries where more highly resolved data exist provide inconclusive results. Previous work has suggested that the level of input census data remains an important factor [18] and that detailed map-ping of settlements, where the vast majority of people live, can also further improve mapping skill [38]. Decid-ing among the datasets remains challengDecid-ing, but the more transparent methodologies, clear documentation of input data, and provision of a mean geographic input unit surface for GPW and GRUMP make those datasets more suited to enabling researchers to understand and quantify the uncertainties inherent in them.
Improving spatial population dataset construction for epidemiological purposes
Our results highlight that uncertainty in the locations of human populations exists to a varying degree across the world, and that this uncertainty is most pronounced for low-income countries, especially those in sub-Saharan Africa. The advancement of theory, increasing availabil-ity of computation, and growing recognition of the importance of robust handling of uncertainty have all contributed to the emergence in recent years of new, sophisticated approaches to the large-scale modeling and mapping of disease. In endemic disease mapping, this has included the use of a special family of general-ized linear models known as model-based geostatistics (MBG), generally implemented in a Bayesian framework. These approaches are enabling the explicit quantifica-tion of uncertainty associated with disease distribuquantifica-tions to be mapped [31], but such approaches have yet to
cross over to the demographic databases with which such maps are used. Figures 4, 5, and 6 demonstrate that aspects of the uncertainties inherent in existing population datasets can be quantified. Future work on spatial population datasets should thus focus on inte-grating such uncertainties into the methods used for their construction as a priority.
As discussed, even when the variations in national total adjustments (Figure 4) are accounted for, substan-tial variation in PAR estimates deriving from the appli-cation of differing modeling methods to coarse-resolution census data are still apparent. Where census datasets are more detailed, the implications of the choice of population distribution modeling approach are reduced. Thus, efforts to improve upon the reliability and precision of spatial population datasets should also focus on obtaining the highest level and most recent census data available. The database behind GPW and GRUMP likely represents the most comprehensive col-lection of census counts and other official population estimates by administrative unit, and full details are available here: http://sedac.ciesin.columbia.edu/gpw/ spreadsheets/GPW3_GRUMP_SummaryInformatio-n_Oct05prod..xls
To identify the priority countries for which both more recent and more detailed population data are required, a simple index through ranking all countries by year of most recent census dataset in the GPW/GRUMP data-base can be created to highlight those with the oldest data. Further, ranking by population per administrative unit (PPU) highlights those with the coarsest census data. These ranks were then summed for each country, and the top 20 countries in terms of having the oldest and coarsest resolution population data are shown in Table 5 (the top 50 are shown in Additional file 1, Table S5). All the countries listed are either in Africa or Asia, with the individual columns showing that popula-tion count data from the 1980s, and at a spatial resolu-tion where on average more than 1 million people reside in each administrative unit, are still being used to estimate diseases risks, burdens, spread, and dynamics.
With the vast majority of human population residing in settlements, on which increasingly accurate, detailed, and reliable datasets are becoming available, the accu-rate mapping of settlements will improve our abilities to accurately quantify human population distributions. Moreover, those residing in large settlements face differ-ing disease risks [39], and settlements are often used to define patches, nodes, or metapopulations in network-based epidemic models [4]. Efforts to improve both population and settlement spatial data have begun through the launch of a number of projects. The Afri-Pop project (http://www.afripop.org) aims to provide detailed and freely available population distribution
maps for Africa, focusing initially on (i) creating a data-base of more contemporary and finer resolution census data for sub-Saharan countries, and (ii) mapping settle-ments across Africa at finer resolution and with greater precision. The population estimation by remote sensing (POPSATER) project (http://www.ulb.ac.be/rech/inven-taire/projets/7/PR4417.html) aims to combine remotely sensed data with field survey data to improve population mapping methodologies and create maps of small urban and rural areas in sub-Saharan Africa. Additionally, other projects are focused on improving the mapping of urban areas [40,41] and land cover in general [42,43], providing valuable data for guiding population mapping over large areas [38,44]. All of these projects are, how-ever, disconnected and small in scope, length, and capa-city. At a time when the mapping of infectious diseases is garnering increasing donor support, mapping of the denominator remains poorly funded.
Finally, while great advances in our abilities to quan-tify population distributions over large areas have been made, these have been focused solely on the simple enu-meration of total population numbers residing in grid cells. The effects of diseases in terms of morbidity,
Table 5 The top 20 priority countries in terms of spatially referenced population data needs
Rank Country PPU Population data year 1 Iraq 1,258,000 1985 2 Congo, Democratic Republic of
the 347,000 1984 3 Chad 527,000 1990 4 Syria 1,241,000 1994 5 Libya 223,000 1984 6 Cameroon 255,000 1987 7 Sudan 358,000 1993 8 Papua New Guinea 241,000 1990 9 United Arab Emirates 399,000 1995 10 Nigeria 231,000 1991 11 Togo 216,000 1991 12 Pakistan 1,309,000 1998 13 Egypt 281,000 1996 14 Iran 260,000 1996 15 Bhutan 110,000 1985 16 Algeria 634,000 1998 17 Guinea 257,000 1996 18 Uzbekistan 118,000 1989 19 Eritrea 94,000 1984 20 Senegal 107,000 1985
The ranks are based on ranking all country data in the GPW/GRUMP database (http://sedac.ciesin.columbia.edu/gpw/spreadsheets/
GPW3_GRUMP_SummaryInformation_Oct05prod.xls) by population per unit (PPU) and date of the input population count data, then summing these to create a simple combined rank score. Additional file 1, Table S4 shows the top 50 countries.
mortality, and speed of spread and the implications for planning and targeting interventions vary substantially with demographic profiles, with clear risk groups and vulnerable populations existing. Breakdowns of popula-tion counts by age and sex are routinely collected dur-ing national censuses and maintained in finer detail within microcensus data (https://international.ipums. org/international/). Moreover, demographic surveillance systems (http://www.measuredhs.com/) continue to col-lect representative and contemporary samples from clus-ters of communities in low-income countries where census data may be less detailed and not collected regu-larly. Together, these datasets form a rich resource for quantifying and understanding the spatial variations in the sizes and distributions of those most at risk of dis-ease, yet at present, they remain unconnected data scat-tered across national statistical offices and websites. At the same time, as calls are being made for improved access to health data [45,46], efforts should be made to gather such demographic datasets into a central resource and better quantify the spatial distributions of vulnerable groups, including infants, children under 5 years old, pregnant women, and the elderly.
Conclusions
Spatial medical intelligence and disease modeling are becoming central to the effective planning, implementa-tion, monitoring, and evaluation of disease control. Sig-nificant advances in the approaches to mapping and modeling of disease risks and epidemic spread have recently been made, supported increasingly by the col-lection of geospatially referenced survey data. Such advances also involve the incorporation of models of uncertainty in output disease estimates and models, but rarely is the uncertainty inherent in the human popula-tion datasets commonly used to provide the denomina-tor even acknowledged. Using the example of P. falciparum PAR estimation, we have shown that these uncertainties can significantly impact findings. The quantification of uncertainties inherent in existing spa-tial population datasets, and the improvement of demo-graphic evidence bases, represents an important research direction if spatial approaches to disease mod-eling and burden estimation are to become more accurate.
Additional material
Additional file 1: Tables S1-S5 and Figures S1-S3
Acknowledgements
We thank John Mendelsohn for advice and help in obtaining the Namibian census data, and Simon Hay, Dave Smith, and Pinki Mondal for comments
on the original manuscript. AJT is supported by a grant from the Bill & Melinda Gates Foundation (#49446) and also acknowledges funding support from the RAPIDD program of the Science & Technology Directorate, Department of Homeland Security, and the Fogarty International Center, National Institutes of Health. RWS is supported by the Wellcome Trust as Principal Research Fellow (#079081). CL is supported by a grant from the Fondation Philippe Wiener - Maurice Anspach. This work forms part of the output of the AfriPop Project, principally funded by the Fondation Philippe Wiener - Maurice Anspach, and the Malaria Atlas Project, principally funded by the Wellcome Trust, UK. The authors also acknowledge the support of the Kenyan Medical Research Institute (KEMRI). This paper is published with the permission of the director of KEMRI.
Author details
1Department of Geography, University of Florida, Gainesville, USA.2Emerging
Pathogens Institute, University of Florida, Gainesville, USA.3Fogarty International Center, National Institutes of Health, Bethesda, MD 20892, USA.
4
Spatial Ecology and Epidemiology Group, Tinbergen Building, Department of Zoology, University of Oxford, South Parks Road, Oxford, UK.5Malaria
Public Health and Epidemiology Group, Centre for Geographic Medicine, KEMRI - University of Oxford - Wellcome Trust Research Programme, Nairobi, Kenya.6Centre for Tropical Medicine, Nuffield Department of Clinical
Medicine, University of Oxford, CCVTM, Oxford, UK.7Biological Control and Spatial Ecology, Université Libre de Bruxelles, Brussels, Belgium.
Authors’ contributions
AJT conceived, designed, and carried out the analysis and wrote the manuscript. NC conducted data analysis. CL and RWS provided and helped interpret data, helped structure and interpret the analyses, and edited the manuscript. PWG helped structure and interpret the analyses, and edited the manuscript. All authors read and approved the final manuscript.
Competing interests
The authors declare that they have no competing interests. Received: 6 December 2010 Accepted: 7 February 2011 Published: 7 February 2011
References
1. Gething PW, Noor AM, Gikandi PW, Ogara EAA, Hay SI, Nixon MS, Snow RW, Atkinson PM: Improving imperfect data from health management information systems in Africa using space-time geostatistics. PLoS Med 2006, 3:e271.
2. Health Metrics Network: Statistics save lives: Strengthening country health information systems. Book Statistics save lives: Strengthening country health information systems Health Metrics Network; 2005.
3. Murray CJL, Lopez AD, Wibulpolprasert S: Monitoring global health: Time for new solutions. BMJ 2004, 329:1096-1100.
4. Riley S: Large-scale spatial-transmission models of infectious disease. Science 2007, 316:1298-1301.
5. Kubiak RJ, Arinaminpathy N, McLean AR: Insights into the evolution and emergence of a novel infectious disease. PLoS Comp Biol 2010, 6: e1000947.
6. Brooker S, Hay SI, Bundy DA: Tools from ecology: useful for evaluating infection risk models? Trends Parasitol 2002, 18:70-74.
7. Ferguson NM, Cummings DAT, Cauchemez S, Fraser C, Riley S, Meeyai A, Lamsirithaworn S, Burke DS: Strategies for containing an emerging influenza pandemic in Southeast Asia. Nature 2005, 437:209-214. 8. Hay SI, Okiro EA, Gething PW, Patil AP, Tatem AJ, Guerra CA, Snow RW:
Estimating the global clinical burden of Plasmodium falciparum malaria in 2007. PLoS Med 2010, 7:e100029.
9. World Health Organization: The World Malaria Report. Book The World Malaria Report Geneva: World Health Organization; 2008.
10. Cibulskis RE, Bell D, Christophel EM, Hii J, Delacollette C, Bakyaita N, Aregawi MW: Estimating trends in the burden of malaria at country level. Am J Trop Med Hyg 2007, 77:133-137.
11. Dobson JE, Bright EA, Coleman PR, Durfee RC, Worley BA: LandScan: a global population database for estimating populations at risk. Photogram Eng Rem Sens 2000, 66:849-857.
12. Deichmann U, Balk D, Yetman G: Transforming population data for interdisciplinary usages: from census to grid. Book Transforming
population data for interdisciplinary usages: from census to grid New York: Documentation for GPW Version 2; 2001 [http://sedac.ciesin.columbia.edu/ gpw/docs/gpw3_documentation_final.pdf].
13. Balk DL, Deichmann U, Yetman G, Pozzi F, Hay SI, Nelson A: Determining global population distribution: methods, applications and data. Adv Parasitol 2006, 62:119-156.
14. Deichmann U: A review of spatial population database design and modelling. Book A review of spatial population database design and modelling National Center for Geographic Information and Analysis (NCGIA), University of California, Santa Barbara (UCSB); 1996.
15. Tatem AJ, Guerra CA, Kabaria CW, Noor AM, Hay SI: Human population, urban settlement patterns and their impact on Plasmodium falciparum malaria endemicity. Malaria J 2008, 7:218.
16. Tatem AJ: Effect of poor census data on population maps. Science 2007, 318:43.
17. Johansson EW, Newby H, Renshaw M, Wardlaw T: Malaria and children. progress in intervention coverage. Book Malaria and children. progress in intervention coverage United Nations Children’s Fund (UNICEF)/The Roll Back Malaria Partnership (RBM); 2007.
18. Hay SI, Noor AM, Nelson A, Tatem AJ: The accuracy of human population maps for public health application. Trop Med Int Health 2005, 10:1-14. 19. Li YF: Global population distribution database. Book Global population distribution database City: United Nations Environment Program (UNEP); 1996.
20. Martens P, Kovats RS, Nijhol S, de Vries P, Livermore MTJ, Bradley DJ, Cox J, McMichael AJ: Climate change and future populations at risk of malaria. Glob Env Change 1999, 9:89-107.
21. Hales S, de Wet N, Maindonald J, Woodward A: Potential effect of population and climate changes on global distribution of dengue fever: an empirical model. The Lancet 2002, 360:830-834.
22. United Nations Population Division: World population prospects, 2008 revision. Book World population prospects, 2008 revision United Nations; 2008.
23. Central Intelligence Agency: The World Factbook Washington D.C., USA: US Government Printing Office; 2010.
24. Guerra CA, Gikandi PW, Tatem AJ, Noor AM, Smith DL, Hay SI, Snow RW: The limits and intensity of Plasmodium falciparum transmission: implications for malaria control and elimination worldwide. PLoS Med 2008, 5:e38.
25. Hay SI, Guerra CA, Gething PW, Patil AP, Tatem AJ, Noor AM, Kabaria CW, Manh BH, Elyazar IRF, Brooker SJ, et al: World malaria map: Plasmodium falciparum endemicity in 2007. PLoS Med 2009, 6:e1000048.
26. Smith DL, Hay SI: Endemicity response timelines for Plasmodium falciparum elimination. Malaria J 2009, 8:87.
27. Hay SI, Smith DL, Snow RW: Measuring malaria endemicity from intense to interrupted transmission. Lancet Inf Dis 2008, 8:369-378.
28. Gething PW, Kirui VC, Alegana VA, Okiro EA, Noor AM, Snow RW: Estimating the number of paediatric fevers associated with malaria infection presenting to Africa’s public health sector in 2007. PLoS Med 2010, 7:e1000301.
29. Tatem AJ, Smith DL: International population movements and regional Plasmodium falciparum malaria elimination strategies. Proc Natl Acad Sci USA 2010, 107(27):12222-12227.
30. Tatem AJ, Smith DL, Gething PW, Kabaria CW, Snow RW, Hay SI: Ranking elimination feasibility among malaria endemic countries. The Lancet 2010, 376(9752):1579-1591.
31. Gething PW, Patil AP, Hay SI: Quantifying aggregated uncertainty in Plasmodium falciparum malaria prevalence and populations at risk via efficient space-time geostatistical joint simulation. PLoS Comp Biol 2010, 6:e1000724.
32. Guerra CA, Howes RE, Patil AP, Gething PW, Van Boeckel TP, Temperley WH, Kabaria CW, Tatem AJ, Manh BH, Elyazar IRF, et al: The international limits and population at risk of Plasmodium vivax transmission in 2009. PLoS Negl Trop Dis 2010, 4:e774.
33. Lin L: A concordance correlation coefficient to evaluate reproducability. Biometrics 1989, 45:255-268.
34. Salvatore M, Pozzi F, Ataman E, Huddleston B, Bloise M: Mapping global urban and rural population distributions. Book Mapping global urban and rural population distributions Food and Agriculture Organization of the United Nations; 2005.
35. Global burden of disease study. [http://www.globalburden.org/ ].
36. World Health Organization: World Health Statistics. Book World Health Statistics Geneva: WHO; 2009.
37. The World Bank: World Development Report 2010. Book World Development Report 2010 The World Bank; 2010.
38. Tatem AJ, Noor AM, von Hagen C, di Gregorio A, Hay SI: High resolution population maps for low income nations: combining land cover and census in East Africa. PLoS One 2007, 2:e1298.
39. Dye C: Health and urban living. Science 2008, 319:766-769.
40. Schneider A, Friedl MA, Potere D: A new map of global urban extent from MODIS satellite data. Env Res Lett 2009, 4:044003.
41. Schneider A, Friedl MA, Potere D: Mapping global urban areas using MODIS 500-m data: New methods and datasets based on‘urban ecoregions’. Rem Sens Env 2010, 114:1733-1746.
42. Arino O, Bicheron P, Achard F, Latham J, Witt R, Weber JL: GLOBCOVER: The most detailed portrait of Earth. European Space Agency 2008, 136:24-31.
43. Global Land Cover Network. [http://www.glcn.org].
44. Linard C, Gilbert M, Tatem AJ: Assessing the use of global land cover data for guiding large area population distribution modelling. GeoJournal 2010. 45. Chan M, Kazatchkine M, Lob-Levyt J, Obaid T, Schweizer J, Sidibe M,
Veneman A, Yamada T: Meeting the demand for results and
accountability: a call for action on health data from eight global health agencies. PLoS Med 2010, 7:e1000223.
46. The Lancet: Sharing public health data: necessary and now. The Lancet 2010, 375:1940.
47. Hay SI, Guerra CA, Tatem AJ, Noor AM, Snow RW: The global distribution and population at risk of malaria: past, present, and future. Lancet Inf Dis 2004, 4:327-336.
48. Cox J, Hay SI, Abeku TA, Checchi F, Snow RW: The uncertain burden of Plasmodium falciparum epidemics in Africa. Trends Parasitol 2007, 23:142-148.
49. Hay SI, Tatem AJ, Guerra CA, Snow RW: Foresight on population at malaria risk in Africa: 2005, 2015 and 2030: Scenario review paper prepared for the Detection and Identification of Infectious Diseases Project (DIID), Foresight Project, Office of Science and Technology, London, UK. Book Foresight on population at malaria risk in Africa: 2005, 2015 and 2030: Scenario review paper prepared for the Detection and Identification of Infectious Diseases Project (DIID), Foresight Project, Office of Science and Technology, London, UK 2006, 40, City, pp. Pg. 40.
50. van Lieshout M, Kovats RS, Livermore MTJ, Martens P: Climate change and malaria: analysis of the SRES climate and socio-economic scenarios. Glob Env Change 2004, 14:87-99.
51. Rogers DJ, Randolph SE: The global spread of malaria in a future, warmer world. Science 2000, 289:1763-1766.
52. Brooker S, Akhwale W, Pullan R, Estambale B, Clarke SE, Snow RW, Hotez PJ: Epidemiology of plasmodium-helminth co-infection in Africa:
populations at risk, potential impact on anemia, and prospects for combining control. Am J Trop Med Hyg 2007, 77:88-98.
53. Riedel N, Vounatsou P, Miller JM, Gosoniu L, Chizema-Kawesha E, Mukonka V, Steketee RW: Geographical patterns and predictors of malaria risk in Zambia: Bayesian geostatistical modelling of the 2006 Zambia national malaria indicator survey (ZMIS). Malaria J 2010, 9:37. 54. Peterson AT: Shifting suitability for malaria vectors across Africa with
warming climates. BMC Inf Dis 2009, 9:59.
55. Snow RW, Craig M, Deichmann U, Marsh K: Estimating mortality, morbidity and disability due to malaria among Africa’s non-pregnant population. Bull World Health Organ 1999, 77:624-640.
56. Guerra CA, Snow RW, Hay SI: Mapping the global extent of malaria in 2005. Trends Parasitol 2006, 22:353-358.
57. Dellicour S, Tatem AJ, Guerra CA, Snow RW, ter Kuile FO: Quantifying the number of pregnancies at risk of malaria in 2007: a demographic study. PLoS Med 2010, 7:e1000221.
58. Teklehaimanot A, McCord G, Sachs J: Scaling up malaria control in Africa: an economic and epidemiological assessment. Am J Trop Med Hyg 2007, 77:138-144.
59. Snow RW, Guerra CA, Noor AM, Myint HY, Hay SI: The global distribution of clinical episodes of Plasmodium falciparum malaria. Nature 2005, 434:214-217.
60. Noor AM, Mutheu JJ, Tatem AJ, Hay SI, Snow RW: Insecticide-treated net coverage in Africa: mapping progress in 2000-07. The Lancet 2008, 373:58-67.
61. Snow RW, Guerra CA, Mutheu JJ, Hay SI: International funding for malaria control in relation to populations at risk of stable Plasmodium falciparum transmission. PLoS Med 2008, 5:e142.
62. Kiszewski A, Mellinger A, Spielman A, Malaney P, Sachs SE, Sachs J: A global index representing the stability of malaria transmission. Am J Trop Med Hyg 2004, 70:486-498.
63. Moffett A, Shackelford N, Sarkar S: Malaria in Africa: Vector species’ niche models and relative risk maps. PLoS ONE 2007, 2:e824.
64. Kelly-Hope LA, McKenzie FE: The multiplicity of malaria transmission: a review of entomological inoculation rate measurements and methods across sub-Saharan Africa. Malaria J 2009, 8:19.
65. Gemperli A, Sogoba N, Fondjo E, Mabaso M, Bagayoko M, Briet OJT, Anderegg D, Liebe J, Smith T, Vounatsou P: Mapping malaria transmission in West and Central Africa. Trop Med Int Health 2006, 11:1032-1046. 66. Guerra CA, Snow RW, Hay SI: Determining the global spatial limits of
malaria transmission in 2005. Adv Parasitol 2006, 62:157-179.
67. Hay SI, Guerra CA, Tatem AJ, Atkinson PM, Snow RW: Urbanization, malaria transmission and disease burden in Africa. Nat Rev Microbiol 2005, 3:81-90.
68. Brooker SJ, Clements ACA, Hotez PJ, Hay SI, Tatem AJ, Bundy DAP, Snow RW: The co-distribution of Plasmodium falciparum and hookworm among African schoolchildren. Malaria J 2006, 5:99.
69. Brooker S, Hotez PJ, Bundy DA: Hookworm-related anaemia among pregnant women: a systematic review. PLoS Negl Trop Dis 2008, 2:e291. 70. Rao DM, Chernyakhovsky A, Rao V: Modeling and analysis of global
epidemiology of avian influenza. Env Mod Software 2009, 24:124-134. 71. Balcan D, Hu H, Goncalves B, Bajardi P, Poletto C, Ramasco JJ, Paolotti D,
Perra N, Tizzoni M, Van den Broeck W, et al: Seasonal transmission potential and activity peaks of the influenza A (H1N1): a Monte Carlo likelihood analysis based on human mobility. BMC Med 2009, 7:45. 72. Balcan D, Colizza V, Goncalves B, Hu H, Ramasco JJ, Vespignani A:
Multiscale mobility networks and the spatial spreading of infectious diseases. Proc Natl Acad Sci USA 2009, 106:21484-21489.
73. Vespignani A, Bajardi P, Poletto C, Balcan D, Hu H, Goncalves B, Ramasco JJ, Paolotti D, Perra N, Tizzoni M, et al: Modeling vaccination campaigns and the fall/winter 2009 activity of the new A(H1N1) influenza in the northern hemisphere. Emerg Health Threats J 2009, 2:e11.
74. Ferguson NM, Cummings DAT, Fraser C, Cajka JC, Cooley PC, Burke DS: Strategies for mitigating an influenza pandemic. Nature 2006, 442:448-452.
75. Rakowski F, Gruziel M, Bieniasz-Krywiec L, Radomski JP: Influenza epidemic spread simulation for Poland - a large scale, individual based model study. Physica A: Stat Mech App 2010, 389:3149-3165.
76. You L, Diao X: Assessing the potential impact of avian influenza on poultry in West Africa: a spatial equilibrium analysis. J Agric Econ 2007, 58:348-367.
77. Pfeiffer DU, Minh PQ, Martin V, Epprecht M, Otte MJ: An analysis of the spatial and temporal patterns of highly pathogenic avian influenza occurrence in Vietnam using national surveillance data. Vet J 2007, 174:302-309.
78. Henning J, Pfeiffer DU, Vu LT: Risk factors and characteristics of H5N1 highly pathogenic avian influenza (HPAI) post-vaccination outbreaks. Vet Res 2009, 40:15.
79. Rogers DJ, Wilson AJ, Hay SI, Graham AJ: The global distribution of yellow fever and dengue. Adv Parasitol 2006, 62:181-220.
80. Johansson MA, Dominici F, Glass GE: Local and global effects of climate on dengue transmission in Puerto Rico. PLoS Negl Trop Dis 2009, 3:e382. 81. Napier M: Application of GIS and modelling of dengue risk areas in the Hawaiian islands. Book Application of GIS and modelling of dengue risk areas in the Hawaiian islands Pacific Disaster Center; 2003.
82. Lindsay SW, Thomas CJ: Mapping and estimating the population at risk from lymphatic filariasis in Africa. Trans Roy Soc Trop Med Hyg 2000, 94:37-45.
83. Brooker SJ, Clements ACA, Bundy DAP: Global epidemiology, ecology and control of soil-transmitted helminth infections. Adv Parasitol 2006, 62:221-261.
84. Brooker S, Beasley M, Ndinaromtan M, Madjiouroum EM, Baboguel M, Djenguinabe E, Hay SI, Bundy DA: Use of remote sensing and a geographical information system in a national helminth control programme in Chad. Bull World Health Organ 2002, 80:783-789.
85. Wint GRW, Robinson TP, Bourn DM, Durr PA, Hay SI, Randolph SE, Rogers DJ: Mapping bovine tuberculosis in Great Britain using environmental data. Trends Microbiol 2002, 10:441-444.
86. Gilbert M, Mitchell A, Bourn DM, Mawdsley J, Clifton-Hadley R, Wint GRW: Cattle movements and bovine tuberculosis in Great Britain. Nature 2005, 435:491-496.
87. Reid RS, Kruska RL, Deichmann U, Thornton PK, Leak SGA: Human population growth and the extinction of the tsetse fly. Agric Ecosys Env 2000, 77:227-236.
88. Noma M, Nwoke BE, Nutall I, Tambala PA, Enyong P, Namsenmo A, Remme J, Amazigo UV, Kale OO, Seketeli A: Rapid epidemiological mapping of onchocerciasis (REMO): its application by the African Programme for Onchocerciasis Control (APOC). Ann Trop Med Parasitol 2002, 96(Suppl 1):S29-39.
89. Fischer E, Pahan D, Chowdhury S, Richardus J: The spatial distribution of leprosy cases during 15 years of a leprosy control program in Bangladesh: an observational study. BMC Inf Dis 2008, 8:126. 90. Kalipeni E, Zulu LC: HIV and AIDS in Africa: a geographic analysis at
multiple spatial scales. GeoJournal 2010.
91. Jones KE, Patel NG, Levy MA, Storeyguard A, Balk D, Gittleman JL, Daszak P: Global trends in emerging infectious diseases. Nature 2008, 451:990-994. 92. Beasley M, Brooker SJ, Ndinaromtan M, Madjiouroum EM, Baboguel M,
Djenguinabe E, Bundy DAP: First nationwide survey of the health of schoolchildren in Chad. Trop Med Int Health 2002, 7:625-630.
doi:10.1186/1478-7954-9-4
Cite this article as: Tatem et al.: The effects of spatial population dataset choice on estimates of population at risk of disease. Population Health Metrics 2011 9:4.
Submit your next manuscript to BioMed Central and take full advantage of:
• Convenient online submission
• Thorough peer review
• No space constraints or color figure charges
• Immediate publication on acceptance
• Inclusion in PubMed, CAS, Scopus and Google Scholar
• Research which is freely available for redistribution
Submit your manuscript at www.biomedcentral.com/submit