HAL Id: tel-03210967
https://tel.archives-ouvertes.fr/tel-03210967
Submitted on 28 Apr 2021
HAL is a multi-disciplinary open access archive for the deposit and dissemination of sci-entific research documents, whether they are pub-lished or not. The documents may come from teaching and research institutions in France or abroad, or from public or private research centers.
L’archive ouverte pluridisciplinaire HAL, est destinée au dépôt et à la diffusion de documents scientifiques de niveau recherche, publiés ou non, émanant des établissements d’enseignement et de recherche français ou étrangers, des laboratoires publics ou privés.
Individual feed efficiency in fishes : direct measurement
methods and indirect predictors to develop selective
breeding programs in two major aquaculture species :
European sea bass Dicentrarchus labrax and Nile tilapia
Oreochromis niloticus
Charles Rodde
To cite this version:
Charles Rodde. Individual feed efficiency in fishes : direct measurement methods and indirect pre-dictors to develop selective breeding programs in two major aquaculture species : European sea bass Dicentrarchus labrax and Nile tilapia Oreochromis niloticus. Agricultural sciences. Université Mont-pellier, 2020. English. �NNT : 2020MONTG044�. �tel-03210967�
THÈSE POUR OBTENIR LE GRADE DE DOCTEUR
DE L’UNIVERSITÉ DE MONTPELLIER
En Sciences Agronomiques École doctorale GAIA
Unité mixte de recherche MARBEC Cirad, WorldFish
Présentée par Charles RODDE
Le 10 Décembre 2020
Sous la direction de David MCKENZIE et l’encadrement de Hugues DE VERDAL
Devant le jury composé de
Jehan-Hervé LIGNOT, Professeur à l’Université de Montpellier, UMR MARBEC Mathilde DUPONT-NIVET, Directeur de Recherches à l’INRAE, UMR GABI
Christel LEFRANÇOIS, Maître de Conférences à l’Université de La Rochelle, UMR LIENSs Hélène GILBERT, Directeur de Recherches à l’INRAE, UMR GenPhySE
Pierrick HAFFRAY, Chercheur au SYSAAF
David MCKENZIE, Directeur de Recherches au CNRS, UMR MARBEC Hugues DE VERDAL, Chercheur au Cirad, UMR ISEM
Président du jury Rapporteur Rapporteur Examinateur Examinateur Directeur de thèse Encadrant (invité)
Individual feed efficiency in fishes: direct measurement
methods and indirect predictors to develop selective breeding
programs in two major aquaculture species: European sea
bass Dicentrarchus labrax and Nile tilapia Oreochromis
3
Remerciements/Acknowledgements
France
Je dois remercier énormément de personnes, et il faut bien démarrer quelque part, alors je vais commencer en premier par Béatrice Chatain ! Merci Béatrice d’avoir monté ce projet de thèse, d’avoir bataillé pour qu’il soit financé, et de m’avoir fait confiance pour le mener à bien. Merci aussi de m’avoir aidé à bien démarrer ma thèse, en me donnant d’entrée de jeu beaucoup de clés pour y arriver et en lui « imprimant du mouvement » pour multiplier les collaborations. Merci en particulier de m’avoir expliqué en détails la reproduction et l’élevage larvaire du bar européen et de m’avoir intégré aux différentes opérations d’élevage. J’ai beaucoup appris et j’en garde de très bons souvenirs. Merci aussi pour tous les conseils « management » qui m’auront été fort utiles au cours de ces 3 ans (et pour plus tard) ! Je vous souhaite désormais de profiter au maximum de votre retraite.
Ensuite, j’aimerais remercier Hugues de Verdal, qui a lui aussi participé à l’élaboration de ce projet de thèse, et m’a encadré pendant ces 3 années. Merci en particulier de m’avoir aidé à prendre la thèse étape par étape et de m’avoir évité de partir dans trop de directions en même temps. Merci aussi d’avoir consacré énormément de temps pour relire à chaque fois les manuscrits, répéter les oraux, etc. Merci aussi pour toutes ces discussions enrichissantes autour de la thèse, qui ont nourris ma réflexion et m’ont aidé à avancer, et de m’avoir aidé à saisir différentes opportunités, telles que l’utilisation des isotopes stables ou encore le programme Agreenium. Enfin, merci de m’avoir fait découvrir toute la partie historique de la ville de Georgetown en Malaisie, qui est vraiment superbe, et de m’avoir donné de précieux conseils pour bien m’intégrer en Malaisie.
Pour compléter la liste de mes encadrants « directs », j’aimerais remercier David McKenzie. Merci d’avoir accepté de remplacer Béatrice et de devenir mon directeur de thèse en cours de route, ce qui n’est pas chose aisée, mais je pense que la transition s’est faite sans soucis. Merci en particulier de m’avoir aidé à ne pas m’inquiéter démesurément tout en me donnant des conseils pour me focaliser sur l’essentiel. Merci pour tous ces échanges enrichissants autour de mon travail, qui m’auront permis de voir mes résultats sous des angles nouveaux. Merci aussi pour toutes ces relectures de mes travaux, qui n’auront pas été vaines car je pense avoir su progressivement en tirer parti pour améliorer mon style d’écriture. Merci enfin pour tous les bons moments hors du cadre professionnel qui m’auront aidé à me détendre.
Merci aussi à Marc Vandeputte. Merci en particulier Marc de m’avoir consacré du temps pour discuter des analyses statistiques à utiliser sur mes données, ou encore des façons d’améliorer
4 la rédaction de mes articles. Je pense que tu m’as donné beaucoup d’éléments qui m’ont permis de progresser tout au long de ces 3 ans. Tu as toujours su te montrer disponible malgré un emploi du temps chargé.
Merci à François Allal. En particulier pour les points de vue enrichissants que tu as apportés sur divers travaux que j’ai réalisés, et les différents conseils que tu m’as apportés, notamment sur la rédaction de la thèse. Merci aussi de m’avoir aidé à mieux communiquer autour de mes travaux, lors de présentations orales ou au moment de leur publication.
Merci à Alain Vergnet, pour les nombreux conseils et le support technique qu’il m’a apportés au cours de ces 3 ans. Tu as su faire preuve de beaucoup de pédagogie pour m’aider à réaliser les différentes installations, notamment sur la partie élevage individuel. Merci aussi de m’avoir aidé à bien préparer la mission en Malaisie, pour que tout fonctionne très vite et très bien. Merci enfin pour ta capacité à constamment détendre l’atmosphère.
Merci à Mathieu Besson, notamment pour m’avoir accompagné tout au long de la partie élevage individuel, afin que l’expérience se déroule le mieux possible. Merci aussi pour les différentes discussions autour de nos résultats qui ont participé à enrichir mon travail de thèse. Merci enfin pour ton humour et ta bonne humeur.
Merci à Frédéric Clota, pour avoir m’avoir constamment aidé lors des différentes expériences. Merci aussi de m’avoir communiqué ton enthousiasme pour le tilapia, et pour les très nombreuses anecdotes que tu m’as racontées. Nous avons partagé le même bureau pendant presque 3 ans, et tu as toujours été bienveillant à mon égard.
Merci à Marie-Odile Blanc pour m’avoir montré patiemment et en détails l’élevage larvaire du bar européen. J’ai vraiment été content d’apprendre à tes côtés. Merci aussi pour l’aide apportée sur les différentes expériences que j’ai réalisées.
Merci à Stéphane Lallement pour m’avoir expliqué le suivi et le déroulement de la reproduction artificielle chez le bar. Merci en particulier pour ta grande patience lorsque l’on réalisait les biopsies, et pour ta bonne humeur naturelle.
Merci à François Ruelle pour avoir apporté beaucoup de support technique sur mes différentes expériences. Merci en particulier pour ta bonne humeur, même lorsque l’on commençait les expériences tôt et que la journée s’annonçait chargée.
Merci à Ronan Griot, pour avoir accepté de m’aider si souvent pour mes différentes expériences, bien qu’étant aussi très occupé de son côté. Ca a été très agréable de pouvoir échanger avec toi autour de sujets divers, très éloignés de la thèse, mais tout de même enrichissants.
Merci à Sébastien Alfonso, avec qui j’ai vraiment eu plaisir à discuter. Merci d’avoir partagé avec moi ta propre expérience de thèse. Merci aussi pour les différents moments de détente de nous avons partagés en dehors du travail. Cela m’a aidé à aborder plus sereinement mon arrivée à Montpellier.
Merci à Sara Faggion, avec qui j’ai aussi beaucoup apprécié échanger. De même, merci pour l’expérience que tu as partagée avec moi sur la thèse. Merci aussi pour ta bonne humeur et ton sens de l’humour.
5 Merci à Germain Salou, pour l’aide que tu m’as apportée dès que tu es arrivé sur la station. Merci pour ton enthousiasme naturel, ainsi que pour ta bonne humeur et tes anecdotes toujours amusantes.
Merci à Cyrille Przybyla pour avoir été la première personne à me confier une mission sur la station de Palavas et m’avoir donné le goût de l’aquaculture. Tes encouragements m’ont beaucoup aidé et motivé pour continuer dans cette voie et me décider à réaliser ce projet de thèse. Merci aussi pour les échanges très intéressants que nous avons pu avoir au cours de ces 3 ans autour de nos différents projets, qui m’ont permis de diversifier mon approche de l’aquaculture.
Merci à Gilbert Dutto pour m’avoir donné très rapidement, dès mon arrivée sur la station de Palavas, de nombreux éléments de réflexion autour des performances zootechniques des poissons. Tu m’as transmis beaucoup de ton expérience et, tout comme Cyrille, l’envie de continuer dans l’aquaculture et de réaliser ce projet de thèse. Merci aussi pour toutes les discussions que nous avons pu avoir ces 3 dernières années, ainsi que pour ta bonne humeur constante.
Merci à Benjamin Geffroy pour les différences discussions que nous avons pu avoir au cours de ces 3 ans, et qui m’ont auront apporté des éléments de réflexion nouveaux. Merci aussi pour ton sens de l’humour et ta bonne humeur.
Merci à Bastien Sadoul, qui de même, m’a apporté de nouvelles clés de raisonnement. Les discussions que nous avons eu ont beaucoup nourri ma réflexion personnelle. Merci pour ta patience et le temps que tu m’as consacré.
Merci à Aurélien Lledo pour avoir toujours accepté de venir m’aider en urgence lorsque que j’étais confronté à un problème logistique. Merci aussi d’avoir réalisé une si belle salle d’élevage individuel, j’ai vraiment eu plaisir à l’utiliser.
Merci à Julie Nati pour l’aide apportée sur le travail de physiologie et respirométrie. Merci pour tes conseils qui m’ont aidé à analyser et comprendre mes données. Merci aussi pour ton expérience sur le déroulement de la thèse et ta bienveillance pour m’aider à être moins stressé. Merci aussi à Felipe Rocco Blasco, pour avoir coopéré avec moi sur toutes les expériences de physiologie. Merci pour ta bonne humeur et le temps que nous avons passé à échanger sur nos pays respectifs.
D’une manière plus générale merci à l’ensemble de la station de Palavas, à Eric Gasset, Thibault Geoffroy, Sébastien Triplet, Killian Chary, Myriam Callier, Marie-Laure Bégout, Marie Lacombe, Benoit Rollin, Emmanuel Rezzouk, Cédric Villard, ainsi que Denis Covès. J’ai été très heureux d’échanger avec vous tous, et vous m’avez soutenu et aidé pour rendre ce projet de thèse plus facile. Merci aussi aux différents alternants et stagiaires dont j’ai croisé la route sur la station. Vous avez aussi participé à rendre cet environnement plus vivant.
Merci à toute l’équipe du Cirad avec qui j’ai eu plaisir à échanger et qui m’ont beaucoup encouragé au cours de ce travail de thèse, en particulier Samira Sarter, Elodie Pepey, Domenico Caruso, Lucas Fertin, Paul Ndour, ainsi que Lionel Dabbadie. Je remercie aussi, en particulier, Marc Canonne et Vincent Douchet qui m’ont apporté beaucoup d’aide pour mener à bien les
6 différentes expériences au cours de ces 3 ans. Je remercie enfin Coline Brau pour sa patience et son aide sur le plan administratif.
Merci à Sarah Nahon pour m’avoir encadré dans le travail mené sur les isotopes, de la conception du protocole jusqu’à la publication de nos travaux. Merci, en particulier, au regard des moments compliqués que tu as eu à traverser de ton côté. Merci de m’avoir fait découvrir tout un pan de la recherche que je ne connaissais pas du tout, et qui s’est révélé être très intéressant.
Merci à Christophe Menniti, pour m’avoir accueilli à Perpignan et avoir fait preuve de beaucoup de pédagogie pour m’expliquer comment fonctionnent les analyses d’isotopes stables. Merci aussi de m’avoir rapidement intégré au laboratoire et d’avoir fait le maximum pour que toutes les écailles soient traitées en un temps record !
Merci à Sébastien Lefebvre d’avoir accepté de m’aider en cours de route dans la valorisation de mon travail sur les isotopes stables, en affinant certains modèles et points de raisonnement. Merci aussi à Thierry Laugier, Pierre-Alexandre Gagnaire, Sandrine Mignon-Grasteau et Philippe Tixier d’avoir consacré du temps pour aider au pilotage de ma thèse. Je vous remercie pour les conseils avisés que vous m’avez donnés, et pour vos angles de réflexion différents des miens.
Enfin, je remercie Mathilde Dupont-Nivet, Christel Lefrançois, Hélène Gilbert, Pierrick Haffray et Jehan-Hervé Lignot d’avoir accepté de consacrer du temps à ce travail afin de l’évaluer.
7
Malaysia
Firstly, I would like to thank John Benzie. Thank you very much John for all the sensible advice you provided me over these 3 years regarding my thesis project and for the trust you gave me. Thank you also for all the means you gathered to strengthen my experiments and to help me succeed in this project. Finally, thank you for always taking time to provide relevant commentaries for the manuscripts I wrote.
I would also like to give a very special thanks to Trong Quoc Trinh. I was very happy to share the Malaysian life with you. You really helped me to adapt to this new environment. You have also given your best to prepare the experiments before I arrived, to make it succeed while I was here, and to keep me inform once I was back to France. With you at Jitra, I knew everything would be alright and I did not have to worry.
I thank also the whole team that helped me at Jitra: in particular Khairul Rizal Abu-Bakar, Mohd Aznan Bin Aziz, Nor Azam Bin Amhad and Yee Hoong Yip, but also Aiman, Zidi, Roze, Tam, Amin and Faizal. All of you were very friendly with me and made my journey to Malaysia great. I had a lot of fun talking with you and you did a lot to share with me the “Malay way of life”. You also worked very hard to help me succeed in my experiments, I am very grateful for all the energy you spent for me.
I would also like to thank Rodrigue Yossa. I was really happy to meet you, and I thank you for the interesting discussions we had about this thesis project.
More generally, I would like to thank all the WorldFish for trusting me, for funding this project and for making my integration to Malaysia easier.
8
Personnel
Je remercie tout d’abord mes parents, pour avoir réussis à admettre l’idée que l’humain n’était pas le seul modèle biologique d’intérêt. Merci de m’avoir donné les moyens matériels et immatériels de m’épanouir dans mes études et d’accomplir mes rêves.
Je remercie aussi mon frère Edouard pour les liens qui nous unissent et qui ne peuvent exister qu’entre deux frères. Merci d’avoir fait en sorte que nous soyons aujourd’hui deux personnes parfaitement complémentaires plutôt que deux copies.
Je remercie mes amis de longue date, que j’ai connus étant très jeune à Bort-les-Orgues, puis à Clermont-Ferrand quand j’étais à l’internat ou en classes préparatoires, et enfin à Rennes en école d’ingénieurs. Merci pour votre soutien tout au long de ces années, qui m’a aidé à aller toujours plus loin, dans les jours heureux comme dans les moments tristes.
Merci à mes professeurs, notamment de lycée, pour m’avoir particulièrement bien conseillé et m’avoir donné la confiance de poursuivre des études, certes exigeantes, mais vraiment passionnantes. Merci en particulier de m’avoir enseigné qu’il faut savoir « donner du temps au temps ».
Je remercie mon grand-père paternel, pour avoir toujours cru en moi et pour m’avoir appris à toujours être plus exigent envers moi-même. Je le remercie aussi de m’avoir transmis son goût pour la culture et la réflexion.
Je remercie enfin mes grands-parents maternels, pour m’avoir appris à devenir plus fort à chaque fois que les difficultés se sont accrues, et à me relever de mes échecs. Je les remercie aussi de m’avoir transmis leur valeur d’écoute, de tempérance et de respect. Je les remercie enfin de m’avoir appris à me passionner pour la beauté et la simplicité de la nature. Sans eux qui m’ont tant donné je ne serais jamais arrivé jusque-là, et je leur dédie ce travail.
9
TABLE OF CONTENTS
LIST OF FIGURES ____________________________________________________________ 12 LIST OF TABLES _____________________________________________________________ 13 LIST OF ABBREVIATIONS AND SYMBOLS __________________________________________ 14 FOREWORD _______________________________________________________________ 16 INTRODUCTION ____________________________________________________________ 18 1. The aquaculture sector is growing fast but must address sustainability issues _________ 19 2. “Feed efficiency”: definition, estimation, underlying factors and improvement strategies __
_____________________________________________________________________ 23
2.1. Definition _________________________________________________________ 23
2.2. Estimation _________________________________________________________ 23
2.3. Factors underlying feed efficiency ______________________________________ 26
2.3.1. Intrinsic factors _________________________________________________ 26
2.3.2. Extrinsic factors _________________________________________________ 26
2.4. Strategies developed to improve feed efficiency ___________________________ 27
2.4.1. At group level ___________________________________________________ 27
2.4.2. At individual level ________________________________________________ 27
3. Methods used to measure individual feed intake in fish __________________________ 28
3.1. Use of dyed feed ____________________________________________________ 28
3.2. Use of X-radiography ________________________________________________ 29
3.3. Use of isogenic clonal lines ____________________________________________ 30
3.4. Use of external coloured tags and video-recording _________________________ 30
3.5. Use of individual rearing ______________________________________________ 32
10
4.1. Growth ___________________________________________________________ 35
4.2. Energy requirements for body maintenance and swimming activity ____________ 37
4.2.1. Weight loss during fasting _________________________________________ 37
4.2.2. Metabolic rate __________________________________________________ 38
4.3. Whole body, muscle and visceral fat content ______________________________ 40
4.4. Stable isotope values of fish tissues _____________________________________ 42
5. European sea bass and Nile tilapia as model species ____________________________ 44 6. Moving forward to estimate and select for individual feed efficiency in fishes _________ 46
6.1. Methodological issues in estimating individual feed efficiency ________________ 46
6.2. Evaluation of a criterion for indirect selection _____________________________ 47
CHAPTER I ________________________________________________________________ 49 Can individual feed conversion ratio at commercial size be predicted from juvenile performance in individually reared Nile tilapia Oreochromis niloticus?
CHAPTER II ________________________________________________________________ 58 The effects of feed restriction and isolated or group rearing on the measurement of individual feed intake and estimation of feed conversion ratio in juvenile Nile tilapia (Oreochromis niloticus) for selective breeding purposes
CHAPTER III________________________________________________________________ 84 Population, temperature and feeding rate effects on individual feed efficiency in European sea bass (Dicentrarchus labrax)
CHAPTER IV ______________________________________________________________ 109 An investigation of links between metabolic rate and feed efficiency in European sea bass
Dicentrarchus labrax
CHAPTER V _______________________________________________________________ 131 Variations in isotope incorporation rates and trophic discrimination factors of carbon and nitrogen stable isotopes in scales from three European seabass (Dicentrarchus labrax) populations
11 DISCUSSION ______________________________________________________________ 142 1. Which method should be used to measure individual feed intake? ________________ 143
1.1. Technical aspects __________________________________________________ 144
1.2. Biological aspects __________________________________________________ 145
2. To what extent do developmental stage and rearing practices influence estimates of individual feed efficiency? ___________________________________________________ 147
2.1. Developmental stage _______________________________________________ 147
2.2. Rearing environment _______________________________________________ 148
3. Which traits hold promise as indirect selection criteria for feed efficiency? __________ 149
3.1. Perspectives provided by the experimental results ________________________ 150
3.1.1. From oxygen consumption to body composition ______________________ 150
3.1.2. Carbon and nitrogen stable isotope values ___________________________ 152
3.2. Future prospects ___________________________________________________ 154 3.2.1. Cortisol secretion _______________________________________________ 154 3.2.2. Genomic selection ______________________________________________ 155 CONCLUSIONS ____________________________________________________________ 157 RÉSUMÉ EN FRANÇAIS ______________________________________________________ 158 REFERENCES ______________________________________________________________ 169 PUBLICATIONS AND COMMUNICATIONS ________________________________________ 180
12
List of figures
Figure 1. World aquaculture and fisheries production (using data from FAO-FIGIS, 2020;
excluding aquatic plants). ____________________________________________________ 20
Figure 2. World aquaculture production share (in %) by geographical areas (countries were
separated from continents when their production was over two billion tons, using data from FAO-FIGIS, 2020; excluding aquatic plants). ____________________________________ 20
Figure 3. Feed conversion ratio, i.e. the ratio between feed intake and body weight gain, for
selected aquatic and terrestrial farmed animal species. Dots represent means and bars indicate range. Lower values signify better feed use. Figure extracted from Fry et al., 2018. _______ 22
Figure 4. Illustration of the estimation of residual feed intake (RFI) from the linear relationship
between feed intake (FI) and body weight gain (BWG). ____________________________ 25
Figure 5. X-radiography of fish feed intake. _____________________________________ 29
Figure 6. Nile tilapia Oreochromis niloticus tagged with external coloured tags. _________ 31
Figure 7. Two individual rearing setups. A) A system of aquaria for European sea bass
Dicentrarchus labrax at the Ifremer Experimental Aquaculture Research Station
(Palavas-les-Flots, France). B) A system for Nile tilapia Oreochromis niloticus at WorldFish Aquaculture Extension Center (Jitra, Kedah State, Malaysia). __________________________________ 32
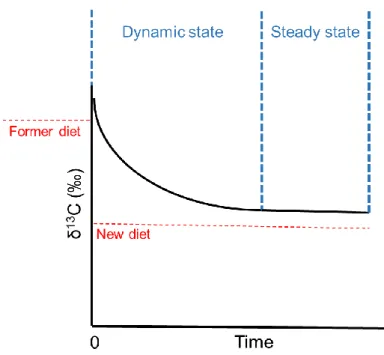
Figure 8. Illustration of the change in carbon stable isotope values within an animal tissue
13
List of tables
Table 1. Summary of the advantages and drawbacks of the various individual FI measurement
methods. _________________________________________________________________ 33
Table 2. Heritabilities reported in literature for feed efficiency (including exclusively studies
measuring feed intake at individual level). _______________________________________ 34
Table 3. Main characteristics of biology and farming of European sea bass and Nile tilapia. 44
14
List of abbreviations and symbols
AT Atlantic population of European sea bassBW Body weight
BWG Body weight gain
Cirad French Agricultural Research Centre for International Development
CGIAR Consortium of International Agricultural Research Centers
DADA-EAT Développement d’une aquaculture durable par l’amélioration de l’efficacité
alimentaire chez le tilapia
DNA Deoxyribonucleic acid
EL Energy loss
EM East Mediterranean population of European sea bass
FAO Food and Agriculture Organization of the United Nations
FCR Feed conversion ratio
FEAMP Fonds européen pour les affaires maritimes et la pêche
FER Feed efficiency ratio
FI Feed intake
FIGIS Fisheries Global Information System
FISH CGIAR Research Program on Fish Agrifood Systems
GIFT Genetically improved farmed tilapia
h² Heritability
HLPE High Level Panel of Experts on Food Security and Nutrition of the Committee on
World Food Security
H2020 AQUAEXCEL2020 Aquaculture infrastructures for excellence in European fish research towards 2020
IFAD International Fund for Agricultural Development
15
ISEM Institute of evolution sciences of Montpellier
MARBEC Marine biodiversity, exploitation and conservation
MBW Metabolic body weight
NRC National Research Council of the National Academies
OECD Organisation for Economic Co-operation and Development
PIT Passive integrated transponder
PW Production weight
r Correlation coefficient
RBWG Residual body weight gain
RFI Residual feed intake
RMR Routine metabolic rate
SE Standard error
SMR Standard metabolic rate
SNP Single nucleotide polymorphism
STECF Scientific, Technical and Economic Committee for Fisheries
US United States of America
WM West Mediterranean population of European sea bass δ13C Stable carbon isotope values
16
Foreword
Experiments presented in the present thesis were made possible through support provided by Cirad, WorldFish, the CGIAR Research Program on Fish Agrifood Systems (FISH) and the International Fund for Agricultural Development (IFAD), the European project H2020
AQUAEXCEL2020 (“Aquaculture infrastructures for excellence in European fish research
towards 2020”), and the project DADA-EAT (“Développement d’une aquaculture durable par l’amélioration de l’efficacité alimentaire chez le tilapia”) funded by the “Fonds européen pour les affaires maritimes et la pêche” (FEAMP). The Agreenium Institute, the MARBEC (“Marine biodiversity, exploitation and conservation”) UMR, the ISEM (“Institute of evolution sciences of Montpellier”) UMR and the University of Montpellier also allocated funds to support missions and attendance to conferences abroad (Malaysia and Germany) and in France (Lyon, Dijon, Perpignan).
The experiments I conducted on the GIFT strain of Nile tilapia were made at WorldFish Aquaculture Extension Center in Jitra (Kedah State, Malaysia). I set up and led these experiments during two missions in May-June 2018 and June-July 2019. I managed a team of about ten persons working at Jitra, in co-operation with WorldFish Center in Bayan Lepas (Penang State, Malaysia). In the case of the first experiment, it lasted more than 30 weeks, so I initiated it during my mission and taught the team a clear protocol to delegate the experiment that I then supervised from France.
Experiments made on European sea bass were led at the Palavas Experimental Aquaculture Research Station (Palavas-les-Flots, Hérault, France). I was involved in the production and rearing of the European sea bass progenies I used (February to August 2018), and then managed various teams of three to ten persons to conduct my experiments from September 2018 to May 2019.
17 I analysed stable isotopes of European sea bass scales in partnership with the CEFREM (“Centre of education and research on Mediterranean environments”) UMR at Perpignan University Via Domitia (Perpignan, Pyrénées-Orientales, France) over a few weeks during the first half of 2019.
Finally, Hugues de Verdal conducted the experiment on the Cirad strain of Nile tilapia at the Palavas Experimental Aquaculture Research Station, from October 2019 to January 2020, with a co-designed protocol.
To date (September 2020), results collected in the present thesis project were reported in three accepted articles, two being already published, in a fourth article under review and a fifth one still in preparation. Results were also presented during two conferences (at Montpellier and at Berlin). For complete references and details, please refer to the “Publications and communications” section.
18
Introduction
19
1. The aquaculture sector is growing fast but must address sustainability issues
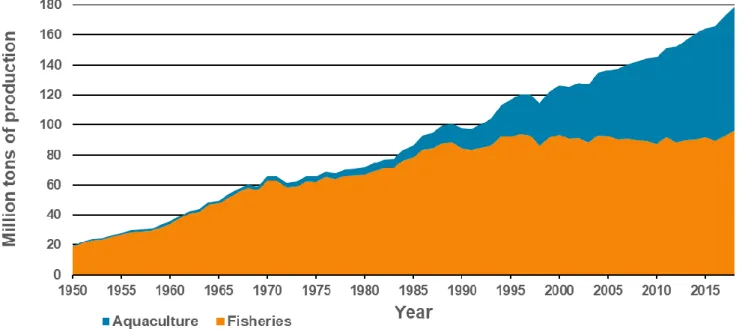
The world human population is over 7 billion in 2020 and, according to projections, it will reach 8 to 10 billion towards 2050 (United Nations, 2011). The increasing world population is accompanied by a growing demand for food. Regarding the world consumption of animal proteins per capita, the relative contribution of products from aquatic origins has kept increasing over the last 50 years, at the expense of livestock except poultry (Béné et al., 2015; OECD-FAO, 2018). Besides, shifting future diets away from terrestrial protein towards aquatic proteins is expected to spare lands and feed crops (Froehlich et al., 2018). Thus, aquatic products will become ever more central to human food security in the future (Béné et al., 2015; OECD-FAO, 2018). This need in aquatic products has been partially satisfied by fisheries. However, their production has stagnated over the last 20 years around 90 million tons annually, and many fish stocks dedicated to human consumption are currently overfished, suggesting a future decrease of landings (FAO, 2018). In contrast, aquaculture has kept increasing to reach 82 million tons (excluding aquatic plants) in 2018, with an average annual growth in production of +7.6% since 1950 (Fig. 1; FAO-FIGIS, 2020). Consequently, meeting the increasing global demand for aquatic products will depend almost exclusively upon aquaculture. Currently, aquaculture production is concentrated in Asia (88.8% of world production), and more specifically in China (58.8% of world production; FAO-FIGIS, 2020, Fig. 2).
20 Figure 1. World aquaculture and fisheries production (using data from FAO-FIGIS, 2020; excluding aquatic
plants).
Figure 2. World aquaculture production share (in %) by geographical areas (countries were separated from
continents when their production was over two billion tons, using data from FAO-FIGIS, 2020; excluding aquatic plants).
Moreover, aquaculture does not fulfil the same objectives in advanced economies compared to emerging ones. Although developed countries consume much more fish per capita than less developed countries (24.9 kg/year versus 12.6 kg/year in 2015, respectively; FAO, 2018), fish protein represents a lower proportion of total animal protein intake (11.4% versus 26.0% in
21 2015; FAO, 2018). Thus, fishes are a crucial source of animal protein for less developed countries. In particular, fish protein contains several essential amino acids such as lysine and methionine, which are rather scarce in these countries’ diets (HLPE, 2014). Beyond proteins, fish products contain several other key essential nutrients. Fishes provide long-chain polyunsaturated fatty acids, with beneficial effects for child development and adult health. Moreover, fishes are an important source of essential micronutrients, such as vitamins B and D, and of minerals, such as calcium and iron (HLPE, 2014). Including aquatic products in the diet can improve nutrition balance and avoid malnutrition in least developed countries (Kawarazuka and Béné, 2010).
In spite of rapid development, aquaculture still needs to overcome sustainability issues. Sustainability is defined as “meeting the needs of the present without compromising the ability of future generations to meet their own needs” (Brundtland, 1987). This concept involves three axes: economy, environmental impact and society. One major obstacle to a sustainable development of aquaculture is linked to fish feed. Fishes generally use feed more efficiently than terrestrial livestock (Fig. 3) but improvements are still necessary. Typical commercial fish feed is composed of fish meal and fish oil from marine capture fisheries, plus land animal protein meal and lipid (e.g. meat by-products, feathers and blood) where this is permitted by legislation (banned in European countries), completed by plant meals and oils (mostly cereals, oilseeds and pulses; Tacon et al., 2011). The proportion of each ingredient in the diet depends on the fish species. For carnivorous fishes such as salmonids or marine finfish, fish meal and fish oil used to be the main ingredients until the early 2000’s but nowadays represent less than 25% of the diet, having been replaced by plant-based ingredients (Médale et al., 2013). In omnivorous or herbivorous freshwater species such as cyprinids, pangassids or cichlids, fish-based ingredients barely represent 5% of the diet (Médale et al., 2013). Moreover, in these latter species, rearing practices do not necessarily involve commercial feed because several farmers
22 rather use fresh or farm-made feeds, or even let fish forage for themselves (Tacon et al., 2011). Commercial feeds, however, are increasingly used globally (Tacon et al., 2011).
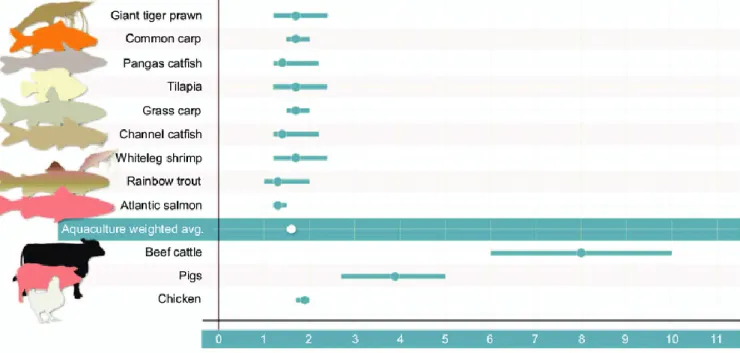
Figure 3. Feed conversion ratio, i.e. the ratio between feed intake and body weight gain, for selected aquatic and
terrestrial farmed animal species. Dots represent means and bars indicate range. Lower values signify better feed use. Figure extracted from Fry et al., 2018. Giant tiger prawn: Penaeus monodon; common carp: Cyprinus carpio; pangas catfish: Pangasius pangasius; tilapia: Oreochromis niloticus, O. mossambicus, O. aureus, O. andersonii,
O. spilurus; grass carp: Ctenopharyngodon idella; channel catfish: Ictalurus punctatus; whiteleg shrimp: Litopenaeus vannamei; rainbow trout: Oncorhynchus mykiss; Atlantic salmon: Salmo salar.
Feed is expensive, costs range from 30% to 70% of total costs in intensive fish farms (Goddard, 1996; Rana Sunil Siriwardena and Hasan, 2009; STECF, 2018). Moreover, ingredients used in fish feeds have undergone major increases in price since 2000, whether derived from wild fish or plants (Rana Sunil Siriwardena and Hasan, 2009; OECD-FAO, 2018). For instance, European sea bass Dicentrarchus labrax production was 83 000 tons in Europe in 2018 (FAO-FIGIS, 2020) and it is estimated that this species consumes 1.38 kilogram of feed to gain one kilogram of body weight (Besson et al., 2019). If we consider that feed cost price is 1.5 € per kilogram, then an improvement of feed use by 5% (from 1.38 to 1.31 kilogram feed to gain one kilogram of body weight) would save 8 715 000 € for European sea bass production in 2018.
23 Regarding environmental impact, improving feed use could reduce global warming, acidification and eutrophication impacts linked to both fish feed production and consumption (Aubin et al., 2009; Besson et al., 2016). Aubin et al. (2009) estimated that feed alone (production and then consumption) accounted for 96 to 100% of the eutrophication potential, 32 to 86% of the climate change potential and 29 to 80% of the acidification potential of a fish farm. These impacts were assessed for rainbow trout Oncorhynchus mykiss in freshwater raceways, for European sea bass in sea cages and turbot Scophtalmus maximus in an inland recirculating system (Aubin et al., 2009).
Finally, from a social aspect, competition between humans and farmed fish for access to food sources raises questions about the true impact of aquaculture on food security (Troell et al., 2014). For instance, anchoveta Engraulis ringens stocks along the Peruvian coast are exploited both for direct human consumption and fish feed production (Fréon et al., 2008). In conclusion, there are economic, environmental and societal reasons to improve feed use, and this is of major importance for finfish aquaculture sustainability and resilience.
2. “Feed efficiency”: definition, estimation, underlying factors and improvement
strategies
2.1. Definition
The concept of “feed efficiency” can be defined as how an animal uses its feed, i.e. how much it eats and how much it grows. Improving feed efficiency produces the same amount of fish on less feed, or more fish with the same amount of feed. Thus, feed efficiency is defined by two key factors: feed intake of an animal (FI), and its subsequent body weight gain (BWG).
2.2. Estimation
Feed efficiency can be estimated in various ways. The most common indicators in the literature are feed conversion ratio (FCR), defined as FCR = FI/BWG, and its reciprocal, feed efficiency
24 ratio (FER), defined as FER = BWG/FI (reviewed by de Verdal et al., 2018a). These two indicators provide different viewpoints on efficiency; FCR indicates how much feed is required for a fish to gain one unit of body weight, whereas FER indicates how much body weight gain can be expected when feeding a fish with one unit of feed. An efficient animal is an animal with a low FCR or a high FER. These two indicators have the major advantage of being very tangible, they do not require any expertise in biology to be understood. However, the fact that they are ratios can raise issues. It is difficult to predict how FI and/or BWG will change when FCR or FER are improved (Aggrey et al., 2010). For instance, FCR can be improved if BWG increases while FI remains constant. The FCR can also be improved, however, if BWG decreases, but proportionally less than FI. The former is interesting from a farmer’s point of view, the latter can be undesirable.
Other indicators have been formulated which do not use ratios but are based on linear relationships, such as residual feed intake (RFI; Koch et al., 1963) or residual body weight gain (RBWG; Koch et al., 1963). In contrast with FCR and FER, these indicators can distinguish between dietary energy allocated to growth or to body maintenance, by considering the
metabolic body weight of the fish (MBW). The MBW is defined as 𝑀𝐵𝑊 = 𝐵𝑊𝑏, where BW
is the body weight and b is a constant exponent which reflects energy loss linked to body
maintenance. This exponent is defined as 𝐸𝐿 = 𝑎 ∗ 𝐵𝑊𝑏 (Lupatsch et al., 2003) where EL is
the energy loss during fasting in kJ.day-1, and a and b are two species-dependent constants determined using statistical modelling. In fish, b is commonly reported around 0.8 (Johnston et al., 1991; Lemarié et al., 1992; Clarke and Johnston, 1999; Lupatsch et al., 2003).
From a biological point of view, the RFI of an animal is the difference between its actual FI and its expected FI based on its MBW and BWG. Similarly, the RBWG of an animal is the difference between its actual BWG and its expected BWG based on its MBW and FI. The RFI and RBWG of each animal are calculated by linear models on the experimental population.
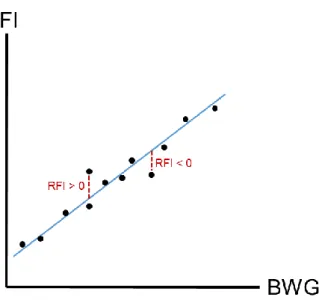
25 Thus, RFI and RBWG estimate whether each animal is rather efficient or inefficient relatively to the whole group. The equation of the linear regression used to calculate RFI is expressed as: 𝑅𝐹𝐼 = 𝐹𝐼 − 𝜇 + 𝛼 ∗ 𝑀𝐵𝑊 + 𝛽 ∗ 𝐵𝑊𝐺 with μ the intercept of the linear regression, α the regression coefficient for MBW (i.e. body maintenance) of the animals, β the regression coefficient for BWG (i.e. growth) of the animals (Fig. 4). An efficient animal, relative to the whole group, has a negative RFI. Similarly, the equation used to calculate RBWG is expressed
as: 𝑅𝐵𝑊𝐺 = 𝐵𝑊𝐺 − 𝜇 + 𝛼 ∗ 𝑀𝐵𝑊 + 𝛽 ∗ 𝐹𝐼. An efficient animal, relative to the whole
group, has a positive RBWG.
Figure 4. Illustration of the estimation of residual feed intake (RFI) from the linear relationship between feed
intake (FI) and body weight gain (BWG). Each black dot represents an individual data and the blue line is the linear regression line between FI and BWG. In the present example, metabolic body weight is considered as similar among all individuals and thus not taken into account.
These linear regressions can be extended to include extra variables that can have an impact on energy allocation, such as egg production in poultry (Luiting and Urff, 1991) or milk production in cows (Connor et al., 2013). The equation of the extended linear regression is expressed as: 𝑅𝐹𝐼 = 𝐹𝐼 − 𝜇 + 𝛼 ∗ 𝑀𝐵𝑊 + 𝛽 ∗ 𝐵𝑊𝐺 + 𝛾 ∗ 𝑃𝑊 where PW is the production weight (of eggs or milk) and γ the regression coefficient for PW. To our knowledge, such model including production traits was never used in fish, but could be relevant, for instance, when studying fish grown to produce eggs (e.g. Atlantic salmon Salmo salar whose eggs are consumed).
26 2.3. Factors underlying feed efficiency
2.3.1. Intrinsic factors
When estimating feed efficiency traits, the processes that convert FI into BWG are treated as a “black box”: it is not required to understand them to estimate feed efficiency. Nonetheless, feed efficiency must be influenced by mechanisms that convert feed into physiologically useful energy (Warren and Davis; 1967; Bureau et al., 2003), namely energy stored as proteins and lipids that is available for physiological functions. These mechanisms include digestion of feed in the alimentary canal, assimilation of nutrients into the blood and their distribution within the animal (Warren and Davis; 1967; Bureau et al., 2003). Once energy is made available, it is allocated to various biological functions, such as basal metabolism, locomotion or growth (Warren and Davis, 1967; Bureau et al., 2003). The higher the proportion of energy allocated to growth, the better the feed efficiency. Feed efficiency traits are variable among species (reviewed by de Verdal et al., 2018a), among strains (Overturf et al., 2003), among development stages (Bureau and Hua, 2008; Robinson and Li, 2010) and among individuals (Kause et al., 2006b; Quinton et al., 2007a; Grima et al., 2008; de Verdal et al., 2018b; Besson et al., 2019).
2.3.2. Extrinsic factors
Feed efficiency is variable among rearing environments (NRC, 2011). For instance, fish feed efficiency is impacted by feeding rate (Huisman, 1976; Brett, 1979), feed composition (Guillaume et al., 2001), water temperature (Azevedo et al., 1998; Árnason et al., 2009; Yoo and Lee, 2016), photoperiod (Biswas et al., 2005), and salinity (Imsland et al., 2008). For example, an optimal feeding rate (e.g. 2% of body weight per day in rainbow trout
Oncorhynchus mykiss; Huisman, 1976) and an optimal temperature (e.g. 9°C in rainbow trout;
Azevedo et al., 1998) can be identified to optimize feed efficiency, deviations from this result in reduced feed efficiency. However, the different environmental factors can interact: the
27 optimal feeding rate may vary with rearing temperature (Brett, 1979). Consequently, investigation of feed efficiency requires careful control of experimental conditions.
2.4. Strategies developed to improve feed efficiency 2.4.1. At group level
Improving feed efficiency in fish can involve nutrition (Huisman, 1976; Brett, 1979; De Silva and Anderson, 1995; Guillaume et al., 2001; NRC, 2011) as well as husbandry (Brett, 1979; Azevedo et al., 1998; Biswas et al., 2005; Imsland et al., 2008; Árnason et al., 2009; Yoo and Lee, 2016). These two strategies have already been widely investigated, using protocols on groups of fish reared in tanks with FI of the whole group used to calculate FCR or FER. One method commonly used to determine FI at group level is to trap, remove and count uneaten pellets, to calculate FI as the difference between the weight of feed given and the weight of feed wasted by fish (Jobling et al., 2001).
2.4.2. At individual level
A promising avenue to improve feed efficiency in fishes is the use of genetics and selective breeding programs. This is an emerging field, considering that selective breeding itself only started in the 1990’s in fish (reviewed by Vandeputte et al., 2019). Selective breeding requires, however, that feed efficiency is a heritable trait, namely that phenotypic variation among individuals is partly explained by genetic variation and is not determined exclusively by environmental variables. Heritability (h²; bounded between 0 and 1) is defined as the ratio of additive genetic variance over phenotypic variance, and a trait is heritable when h² > 0 (Falconer and Mackay, 1996). In order to accurately determine heritability and identify fish to be used as broodstock, feed efficiency must be estimated at individual level. That is, developing a selective breeding program for feed efficiency requires individual phenotyping for BWG and FI. In classical rearing systems, individual BWG is easy to measure by individual identification with
28 passive integrated transponder (PIT) tags (Roussel et al., 2000). In contrast, individual FI is much more difficult to measure in fish that are reared in large groups and eat simultaneously when feed is supplied. Thus, phenotyping fish for their individual FI requires specific approaches.
3. Methods used to measure individual feed intake in fish
Several techniques have been developed to measure individual FI in fish, which each has advantages and drawbacks.
3.1. Use of dyed feed
This method is suitable for fish reared in a group, coloured pellets are provided and, after feeding, stomach contents are collected and weighed to assess individual FI (Johnston et al., 1994; Unprasert et al., 1999). If the stomach contains the remains of several meals, pellets colour is changed between each meal to reveal this (Johnston et al., 1994; Unprasert et al., 1999). To our knowledge, however, this method has only been used to investigate feeding activity, not individual feed efficiency.
It is however technically difficult to collect and accurately identify meals in the stomach content so that this method may not be reliable to estimate individual feed efficiency (Jobling et al., 2001). Moreover, individuals must be sacrificed to dissect the gastrointestinal tract and collect stomach content (Johnston et al., 1994; Unprasert et al., 1999), so the method is not suitable for continuous monitoring of individual FI. Furthermore, sacrificing fish to assess individual FI is not compatible with current legislation for the protection of animals used for scientific purposes (European Union, 2010; US Government, 2015). Even if non-lethal methods such as gastric lavage could be used (Bromley, 1994), dyed feed is not used to estimate individual FI anymore.
29 3.2. Use of X-radiography
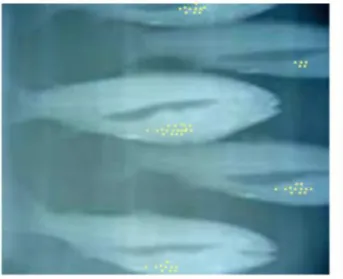
A second method for fish reared in a group is X-radiography. Pellets are produced with radio-opaque markers that are visible by X-radiography of the gastrointestinal tract (Talbot and Higgins, 1983; Fig. 5). The number of ingested pellets can be counted to measure FI (Jobling et al., 2001). Commonly used markers are iron power (Talbot and Higgins, 1983) or ballotini glass beads (McCarthy et al., 1993; Silverstein et al., 2001; Boujard et al., 2006; Kause et al., 2006a; 2006b; Quinton et al., 2007a; 2007b; Grima et al., 2008).
Figure 5. X-radiography of fish feed intake. Yellow marks within fish gastrointestinal tract represent ballotini
glass beads ingested with the feed. © L. Grima
The X-radiography must be conducted within a few hours of feeding to avoid a loss of markers by defecation, under anaesthesia (Jobling et al., 2001). This latter is problematic because fish need to recover from handling and anaesthesia and so frequent measurements may bias measurements of FI (Jobling et al., 2001). Indeed, full recovery of feeding behaviour after handling may require several weeks, for example two weeks for European whitefish Coregonus
lavaretus (Quinton et al., 2007a) and three weeks for rainbow trout Oncorhynchus mykiss
(Grima et al., 2008). Thus, individual FI is measured on a sub-sample of the total number of meals. Feed intake is, however, highly variable from one meal to another in fish (Smagula and Adelman, 1982; Tackett et al., 1988) so FI measurements with this method have low
30 repeatability, between 0.09 and 0.32 in rainbow trout (Kause et al., 2006a; Grima et al., 2008). That is, correlation between two FI measurements on a same fish is low. Thus, X-radiography is a “one-shot” method and not suitable for continuous monitoring of individual FI (Jobling et al., 2001).
3.3. Use of isogenic clonal lines
Using isogenic clonal lines of fish is not a measurement method of individual FI by itself, but rather a methodological tool to distinguish between the amount of variation in FI and feed efficiency that can be attributed to genetics or the environment. Genetic variation in a clonal line is non-existent so it can be used to increase the number of measurements per genotype within a given environment, such as a tank. Therefore, the same genotype can also be reared in different environments. Clonal lines are, consequently, useful experimental tools to estimate accurately genetic parameters in traits such as feed efficiency.
Grima et al. (2008) estimated individual FI of isogenic clonal rainbow trout with the X-radiography method, but clonal lines could of course be used with other techniques to measure individual FI. The clones were heterozygous, obtained by mating females and males from different homozygous clonal lines, themselves developed in rainbow trout by chromosome set manipulation methods using gynogenesis techniques (Quillet et al., 2007; Grima et al., 2008). Ten different clonal lines were reared in six tanks to have a balanced factorial design with seven fish of each line per tank. This increased the accuracy of estimates of genetic parameters for FI and feed efficiency, these two traits being highly sensitive to environmental variation (Grima et al., 2008). Clonal lines cannot, however, be used in commercial conditions or to develop selective breeding programs for feed efficiency.
3.4. Use of external coloured tags and video-recording
The use of video-recording has been widely used to investigate fish feeding behaviour (e.g. Kadri et al., 1991; Juell et al., 1994; Damsgård and Dill, 1998; Benhaïm et al., 2017). Very few
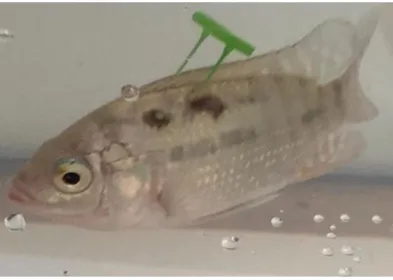
31 studies have, however, focused on measurement of individual FI with this method. The method is only feasible on small groups of fish, up to 15 fish in Nile tilapia Oreochromis niloticus (de Verdal et al., 2017). Thus, rearing conditions differ from commercial farms but, nonetheless, fish can still interact with conspecifics and therefore social structures are at least partly maintained.
Individual FI and feed efficiency were assessed in Atlantic halibut Hippoglossus hippoglossus using this method (Tuene and Nortvedt; 1995), using large numbered disc tags and direct observation. The first study to use this method from a viewpoint of selection, however, was by de Verdal et al. (2017) in Nile tilapia, using coloured T-bar tags on groups of up to 15 individuals. Each meal was video-recorded, with feed supplied pellet by pellet to facilitate measurement of individual FI (Fig. 6). This method has the major advantage of being exhaustive because it measures individual FI for each meal. Moreover, repeatability of individual FI with this method is very good, with r = 0.95 after analysis of 11 meals (de Verdal et al., 2017). The major constraint in the application of this method is the time required, firstly for feeding pellets one by one, and then to analyse video-recordings.
32 3.5. Use of individual rearing
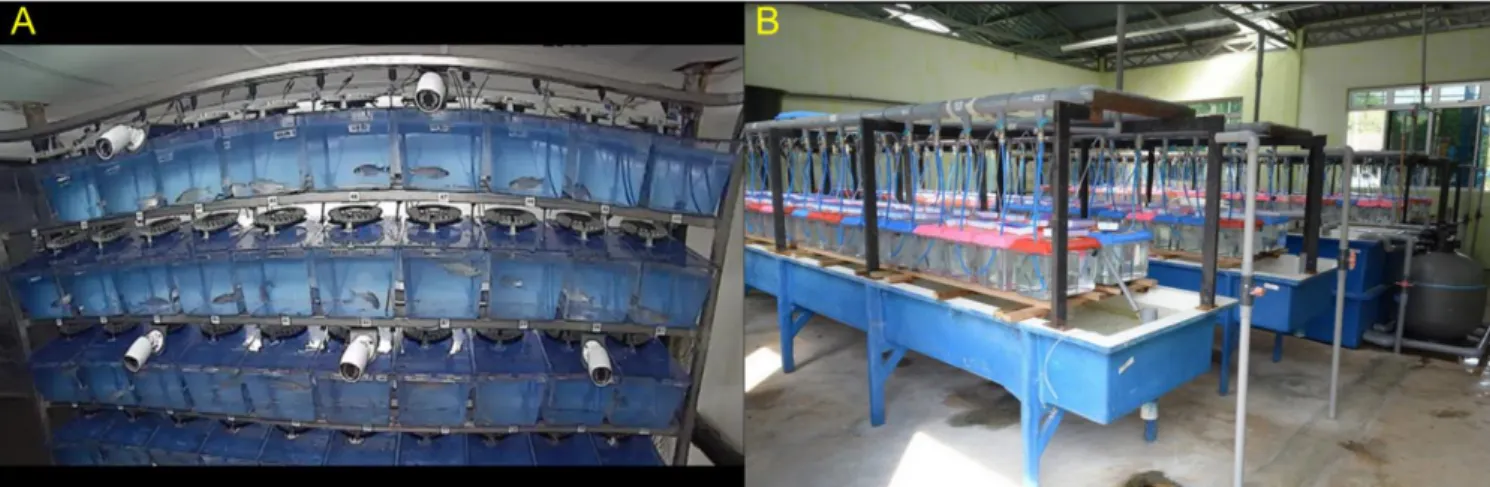
One final method to measure individual FI is to rear fish in isolation (Silverstein et al., 2005; Silverstein, 2006; Martins et al., 2006; 2011; Besson et al., 2019; Fig. 7). Each fish is given a known amount of feed, and, several hours after feeding, waste pellets are collected and counted to calculate FI as the difference between feed given and feed wasted.
Figure 7. Two individual rearing setups. A) A system of aquaria for European sea bass Dicentrarchus labrax at
the Ifremer Experimental Aquaculture Research Station (Palavas-les-Flots, France). An automatic feeder, comprising several small feed compartments (one per meal), is set on the cover of each aquarium. Cameras are used to monitor the room remotely. © F. Allal B) A system for Nile tilapia Oreochromis niloticus at WorldFish Aquaculture Extension Center (Jitra, Kedah State, Malaysia). A pill organiser, disposed on the cover of each aquarium, is used to hold and distribute each ration manually. © T. Quoc Trinh
The major advantage of this method is being exhaustive, FI can be measured for each meal over several months to account for temporal variability (Besson et al., 2019). Furthermore, the FI can be determined a few hours after feeding. Besson et al. (2019) assessed feed efficiency of 588 European sea bass Dicentrarchus labrax over 194 days using this methodology. It is, nonetheless, rather tedious to collect all the uneaten pellets in all the individual aquaria. Besson et al. (2019) restricted feeding to 50% of the optimal rate. The method has demonstrated that selecting faster-growing individuals under restricted ration improved feed efficiency of progeny in pigs (Nguyen et al., 2005) and rabbits (Drouilhet et al., 2016). This was true whether progeny was then fed at a restricted rate or ad libitum. The restricted feeding reduces, of course, the workload of collecting and counting wasted pellets.
33 It still remains to be demonstrated, however, that the most efficient fish under a restricted feeding rate in individual aquaria are also the most efficient when fed at ad libitum. Another drawback of this method is that it prevents fish from having normal interactions with conspecifics; isolation may impact individual FI and feed efficiency. Thus, more research is needed to establish whether individual FI and feed efficiency measured in isolation are accurate predictors of what would be observed in classical rearing systems.
To summarize, various methods have been developed to measure individual FI but none of them are “perfect”; all have flaws from a technical and/or a biological perspective (Table 1).
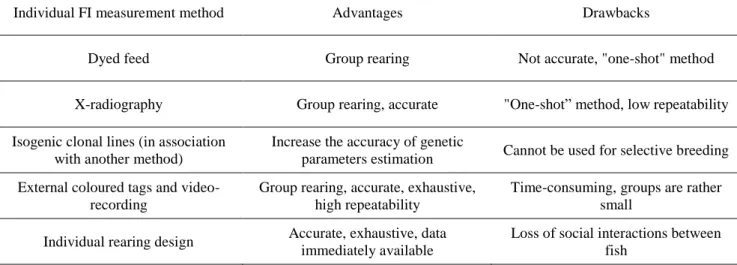
Table 1. Summary of the advantages and drawbacks of the various individual FI measurement methods.
Individual FI measurement method Advantages Drawbacks
Dyed feed Group rearing Not accurate, "one-shot" method
X-radiography Group rearing, accurate "One-shot” method, low repeatability Isogenic clonal lines (in association
with another method)
Increase the accuracy of genetic
parameters estimation Cannot be used for selective breeding External coloured tags and
video-recording
Group rearing, accurate, exhaustive, high repeatability
Time-consuming, groups are rather small
Individual rearing design Accurate, exhaustive, data immediately available
Loss of social interactions between fish
Nonetheless, these methods have established that individual feed efficiency is heritable in a few fish species (Table 2). Therefore, individual feed efficiency can be improved by selective breeding. However, the various estimations of heritability (h²) vary among species and between methods in the same species (Table 2). In particular, the low heritability estimated by Quinton et al. (2007a) and Kause et al. (2016) may be due to low repeatability of the X-ray method. This underscores that selective breeding programs must be based upon phenotyping methods with high repeatability.
34 Table 2. Heritabilities reported in literature for feed efficiency (including exclusively studies measuring feed
intake at individual level).
h² ± SE Species Trait(s) Individual feed intake
measurement method Reference 0.06 ± 0.10a
European white fish
Coregonus lavaretus FER X-ray Quinton et al., 2007a
0.07 ± 0.11b
0.23 ± 0.09 Rainbow trout
Oncorhynchus mykiss RFI X-ray with clonal lines Grima et al., 2008
0.10 ± 0.05 0.11 ± 0.06 0.13 ± 0.07 0.14 ± 0.08 Rainbow trout Oncorhynchus mykiss FCRc,d RFId FCRe RFIe
X-ray Kause et al., 2016
0.32 ± 0.11 Nile tilapia
Oreochromis niloticus
FCR
External coloured tags de Verdal et al., 2018b
0.50 ± 0.10 RFI
0.25 ± 0.10f
European sea bass
Dicentrarchus labrax FCR
Individual rearing
(restricted feeding rate) Besson et al., 2019 0.47 ± 0.07g
SE: standard error; awith fishmeal diet; bwith soybean meal diet; ccorrected by body weight; drecorded at 27 months post hatching exclusively; erecorded at 11, 16 and 27 months post hatching; fwith pedigree information exclusively; gwith pedigree and genomic information.
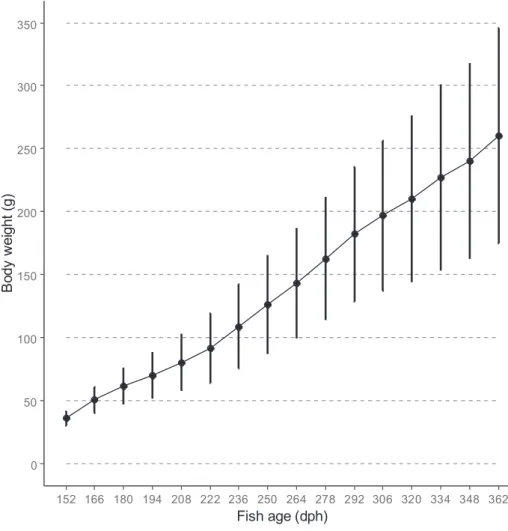
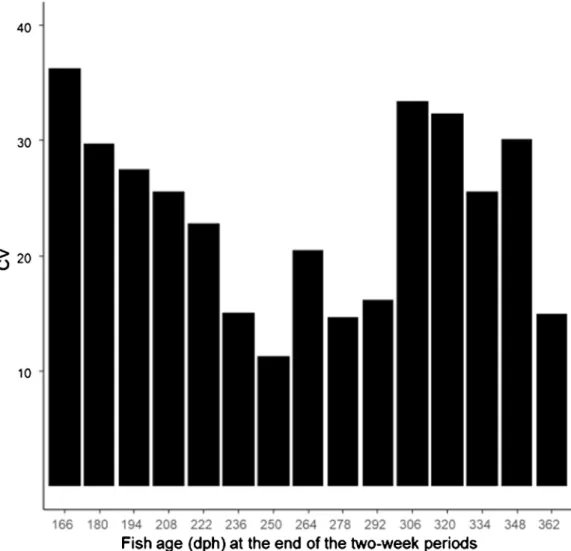
All methods have, to date, only been applied for brief periods, and mostly to juveniles. For instance, individual feed efficiency was estimated over ten days in juvenile Nile tilapia by de Verdal et al. (2017) and over 28 days in juvenile European sea bass by Besson et al. (2019). To our knowledge, only Kause et al. (2006a; 2016) estimated individual feed efficiency up to commercial size (at 140, 750 and 2000 g in the first study and at 11, 16 and 27 months post hatching in the second one) in rainbow trout using the X-ray method. Nevertheless, feed efficiency was only estimated over three weeks at each stage, with one FI measurement per week. These studies did not report correlations among estimates at the three stages. Due to rearing infrastructures needed to measure individual FI on large fish and to rearing costs, in particular regarding feed (most feed is consumed during the later stages of growth; Alanärä et al., 2001), it is much more convenient to select for feed efficiency at juvenile stage. The aim of a selective breeding program would be to improve feed efficiency over the whole rearing period, not just over the juvenile stage, so it is essential to assess how individual feed efficiency of juveniles reflects individual feed efficiency up to commercial size.
35 Individual feed efficiency (or any other heritable phenotypic trait) can be improved genetically with two strategies: direct and indirect selection. Direct selection uses direct estimation of individual feed efficiency, which remains technically challenging and/or possibly inaccurate. Indirect selection uses measurement of traits whose variation is heritable and closely genetically correlated with feed efficiency. Selecting fish for the trait will, therefore, also select for feed efficiency. The goal, therefore, is to find traits that meet these criteria but that are also easier to measure than individual feed efficiency to be included in a selective breeding program.
4. Potential traits for indirect selection on feed efficiency
Traits presented below were chosen by two criteria: 1) a genetic correlation with feed efficiency that has already been reported in fish and 2) ease of measurement on individuals.
4.1. Growth
Individual growth is easy to measure on tagged fish and is already a selection criterion in almost all the commercial breeding programs in fishes, due to its economic importance. Thus, it is crucial to investigate any correlation with feed efficiency, in particular that selection for rapid growth does not degrade feed efficiency due to a negative genetic correlation.
Reported correlations between growth and feed efficiency traits are high at a phenotypic level, being positive between growth and FER, and negative between growth and FCR. That is, faster-grower fish are more efficient (reviewed by de Verdal et al., 2018a). Most studies have, however, focused on correlations at group level, and not at individual level, which may bias estimations. At individual level, de Verdal et al. (2017; 2018b) estimated a phenotypic correlation from -0.46 to -0.62 between growth and FCR in Nile tilapia Oreochromis niloticus using the video-recording method. Besson et al. (2019) reported r = -0.78 between growth and FCR in European sea bass Dicentrarchus labrax using the individual rearing method. However, it is essential to determine the contribution of genetics versus environment to any such
36 phenotypic correlations. At genetic level, Henryon et al. (2002) found a correlation between FER and body weight from 0.44 to 0.99 in rainbow trout Oncorhynchus mykiss, however they estimated FER at group (family) level. In Nile tilapia, de Verdal et al. (2018b) found no significant genetic correlation between individual growth and FCR whereas, in European sea bass, Besson et al. (2019) reported an extremely strong and significant genetic correlation ranging from -0.95 (without genomic information) to -0.98 (with genomic information). Beyond species differences, these contrasting results may also be methodological because de Verdal et al. (2018b) used an optimal feeding rate whereas Besson et al. (2019) restricted fish to 50% of optimal. The results reported by Besson et al. (2019) are, however, consistent with observations on pigs (Nguyen et al., 2005) and rabbits (Drouilhet et al., 2016) where there is a genetic correlation between growth and feed efficiency on restricted feeding rates. That is, when feeding rate is restricted, mechanistically faster-growing fish are the most efficient whereas, when feed is not restricted, some fish can also grow rapidly simply by consuming greater quantities of feed than others. Kause et al. (2006b) and Quinton et al. (2007a) demonstrated in rainbow trout and European whitefish Coregonus lavaretus that selecting for growth would improve individual FER even if it also increased individual FI. Indeed, according to their estimations, selecting for growth would increase BWG proportionally more than FI, resulting in improved FER.
Regarding RFI, no significant phenotypic correlation with growth was reported by de Verdal et al. (2017; 2018b) for Nile tilapia. In contrast, Silverstein (2006) reported significant phenotypic correlations of -0.31 and -0.57, when feeding rainbow trout to satiety or on a restricted ration, respectively. There was no genetic correlation between growth and RFI in Nile tilapia (de Verdal et al., 2018b) or rainbow trout (Grima et al., 2008). Such lack of correlation may reflect the statistical construction of RFI itself. That is, because RFI is the residual of the linear relationship of FI as a function of BWG and MBW, this creates a statistical independence
37 between BWG and RFI, even if not complete because of the simultaneous inclusion of MBW in the model. In the case of Grima et al. (2008), MBW was not even included in the linear model, resulting in almost zero correlation. In contrast, the significant correlation found by Silverstein (2006) may be due to the fact the study did not predict FI according to a model calibrated on its data, but according to a bioenergetics model developed for adult fish (despite using juvenile fish). This bioenergetics model included several factors such as water temperature and energy content of the feed.
No clear conclusions can be drawn about the potential to improve feed efficiency indirectly by selecting for growth traits. Any genetic correlations between these traits seem to be both species-dependent and feeding rate-dependent.
4.2. Energy requirements for body maintenance and swimming activity 4.2.1. Weight loss during fasting
Weight loss during fasting could be a predictor of individual feed efficiency because individuals with higher energy costs for body maintenance and routine activities would lose weight more when fasting. Similarly, under a restricted ration, fish with higher costs for maintenance and activity would allocate less energy to growth, thus being less efficient. When, however, fish are fed ad libitum, individuals may be able to compensate for higher costs by consuming more feed, thus appearing to be not less efficient.
Daulé et al. (2014) selected European sea bass for one generation according to weight loss during fasting and produced two divergent lines: fasting-tolerant and fasting-sensitive. These two divergent lines did not, however, differ significantly for RFI although the authors suggested that a second generation of selection might result in a difference between the two lines. In Nile tilapia, de Verdal et al. (2018b) reported a genetic correlation of 0.80 between weight loss during fasting and FCR, and of 0.70 between weight loss during fasting and RFI: the most efficient fish were fasting-sensitive (i.e. losing weight more rapidly). In contrast, Besson et al.
38 (2019) reported that fasting-tolerant European sea bass (i.e. losing weight less rapidly) were the most efficient.
Grima et al. (2008) considered both weight loss during fasting and compensatory growth during subsequent refeeding in rainbow trout. After feed deprivation, fish exhibit a phase of compensatory growth due to hyperphagia, which permits them to achieve a growth trajectory that converges with what would have been observed without feed deprivation (Ali et al., 2003). Grima et al. (2008) found no genetic correlation between RFI and weight loss during fasting or weight gain during refeeding. However, they found a genetic correlation between RFI and various linear indexes combining both weight loss at fasting and weight gain during refeeding (r² = 0.44-0.59).
Therefore, any potential link between feed efficiency and weight loss during fasting requires confirmation. Moreover, BWG during refeeding may also provide relevant information to predict feed efficiency. Finally, results appear to differ among species.
4.2.2. Metabolic rate
The metabolic rate of an animal, to meet energy demands of maintenance and activity, can be quantified with two methods: directly as heat produced and indirectly by respirometry measuring rates of O2 consumed or CO2 produced (Speakman, 2013). Both methods are commonly used in terrestrial animals but, for fishes, only the second method is technically easy to perform. That is, the high thermal capacitance of water makes it very difficult to detect any heat produced by metabolism. Measuring metabolic rate as oxygen consumption requires the isolation of individuals but is technically easier and shorter (less than two days) to perform than measuring individual FI (McKenzie et al., 2014). Large numbers of animals can be measured simultaneously and no feed is handled (fish are fasting). Oxygen consumption of undisturbed fish has reasonable repeatability over the short to medium term, with r = 0.48 in European sea bass for measurements separated by 20 minutes (Marras et al., 2010). Repeatability can decline