HAL Id: tel-02437183
https://tel.archives-ouvertes.fr/tel-02437183
Submitted on 13 Jan 2020
HAL is a multi-disciplinary open access
archive for the deposit and dissemination of sci-entific research documents, whether they are pub-lished or not. The documents may come from teaching and research institutions in France or abroad, or from public or private research centers.
L’archive ouverte pluridisciplinaire HAL, est destinée au dépôt et à la diffusion de documents scientifiques de niveau recherche, publiés ou non, émanant des établissements d’enseignement et de recherche français ou étrangers, des laboratoires publics ou privés.
statistiques
Tien Duc Cao
To cite this version:
Tien Duc Cao. Vers une vérification automatique des affirmations statistiques. Programming Lan-guages [cs.PL]. Université Paris Saclay (COmUE), 2019. English. �NNT : 2019SACLX051�. �tel-02437183�
Th
`ese
de
doctor
at
NNT
:2019SA
CLX051
Toward Automatic Fact-Checking of
Statistic Claims
Th`ese de doctorat de l’Universit´e Paris-Saclay pr´epar´ee `a l’ ´Ecole Polytechnique ´Ecole doctorale n◦580 Sciences et technologies de l’information et de la communication (STIC)
Sp´ecialit´e de doctorat : Informatique
Th`ese pr´esent´ee et soutenue `a Palaiseau, le 26.09.2019, par
T
IEN-D
UCC
AOComposition du Jury :
Philippe Pucheral
Professeur, UVSQ et Inria Pr´esident du jury Nathalie Aussenac-Gilles
Directrice de recherche, IRIT Rapporteur Paolo Papotti
Maˆıtre de Conf´erences, EURECOM Rapporteur Julien Leblay
Chercheur, AIST, Japon Examinateur Philippe Lamarre
Professeur, ENSA Lyon Examinateur Ioana Manolescu
Directrice de recherche, Inria et Ecole Polytechnique Directeur de th`ese Xavier Tannier
Contents
1 Introduction 7
1.1 Motivation. . . 7
1.2 Contributions and outline . . . 8
2 Preliminaries 11 2.1 Resource Description Framework . . . 11
2.2 Information extraction . . . 12
2.2.1 Information extraction tasks . . . 12
2.2.2 Machine learning for information extraction . . . 13
2.2.3 Deep learning for information extraction . . . 14
2.2.4 Metrics for evaluating information extraction quality . . . 15
2.2.5 Text representation . . . 17
2.3 Conclusion . . . 18
3 State of the art of computational fact checking 19 3.1 Claim extraction. . . 21
3.1.1 Unsupervised approaches. . . 21
3.1.2 Supervised methods . . . 22
3.2 Reference source search . . . 26
3.3 Related datasets . . . 26
3.4 Claim accuracy assessment . . . 27
3.4.1 Using external sources . . . 27
3.4.2 Using a knowledge graph. . . 30
3.4.3 Using linguistic features . . . 32
3.4.4 Using user input . . . 34
3.5 Fact checking challenges . . . 37
3.5.1 Fake news challenge . . . 37
3.5.2 Fact Extraction and VERification . . . 37
3.5.3 Check worthiness . . . 38
3.6 Automated end-to-end fact checking systems . . . 38
3.7 Conclusion . . . 40
4 Extracting linked data from statistic spreadsheets 43 4.1 Introduction . . . 43
4.2 Reference statistic data . . . 44
4.2.1 INSEE data sources. . . 44
4.2.2 Conceptual data model . . . 46
4.3 Spreadsheet data extraction . . . 48 3
4.3.1 Data cell identification . . . 48
4.3.1.1 The leftmost data location . . . 48
4.3.1.2 Row signature . . . 49
4.3.1.3 Collect additional data cells . . . 49
4.3.2 Identification and extraction of header cells . . . 49
4.3.2.1 The horizontal border . . . 49
4.3.2.2 Cell borders . . . 50
4.3.2.3 Collect header cells . . . 50
4.3.3 Populating the data model . . . 50
4.4 Linked data vocabulary . . . 51
4.5 Evaluation . . . 51
4.6 Implementation . . . 52
4.7 Related works . . . 52
4.8 Conclusion and future works . . . 53
5 Searching for truth in a database of statistics 55 5.1 Introduction . . . 55
5.2 Search problem and algorithm . . . 56
5.2.1 Dataset search . . . 57
5.2.2 Text processing . . . 57
5.2.3 Word-dataset score . . . 57
5.2.4 Relevance score function . . . 58
5.2.4.1 Content-based relevance score function . . . 59
5.2.4.2 Location-aware score components . . . 59
5.2.4.3 Content- and location-aware relevance score . . . 60
5.2.5 Data cell search . . . 60
5.3 Evaluation . . . 61
5.3.1 Datasets and queries . . . 61
5.3.2 Experiments . . . 62
5.3.2.1 Evaluation metric . . . 62
5.3.2.2 Parameter estimation and results . . . 62
5.3.2.3 Running time . . . 63
5.3.2.4 Comparison against baselines . . . 64
5.3.3 Web application for online statistic search . . . 65
5.4 Implementation . . . 65
5.5 Related works . . . 66
5.6 Conclusion and future works . . . 67
6 Statistical mentions from textual claims 69 6.1 Introduction . . . 69
6.2 Statistical claim extraction outline . . . 69
6.3 Entity, relation and value extraction . . . 72
6.3.1 Statistical entities . . . 72
6.3.2 Relevant verbs and measurement units . . . 73
6.3.3 Bootstrapping approach . . . 74
6.3.4 Extraction rules . . . 74
6.4 Evaluation . . . 76
CONTENTS 5
6.4.2 Evaluation of the end-to-end system . . . 76
6.5 Implementation . . . 77
6.6 Related works . . . 77
6.7 Conclusion and future works . . . 78
7 Topics exploration and classification 81 7.1 Corpus construction . . . 82 7.2 Topic extraction . . . 83 7.3 Topic classification . . . 84 7.3.1 Preliminaries . . . 84 7.3.2 Model training . . . 85 7.3.3 Evaluation . . . 86 7.4 Conclusion . . . 86 8 Conclusion 87 8.1 Summary . . . 87 8.2 Perspectives . . . 88 Bibliography 91
Chapter 1
Introduction
1.1
Motivation
The development of widespread popular information production and sharing infrastructure has lead to any individual having access to information quickly and easily through various means: social networks, forums, blogs, newspapers, etc. Anyone with access to the Internet is thus potentially a digital content producer. Although information is easy to access, it has become increasingly difficult for information consumers to assess the credibility of content found on-line. A fake news article with an eye-catching title or fake images could be shared instantly to thousands of people who may redistribute it, without verifying its misleading content. As a consequence, misinformation travels fast, and it may lead to dramatical consequences in real life1.
Verifying the truthness of information is hard, even for professionals like journalists. This process could be considered as consisting of three tasks:
1. Extracting claims (“a statement that something is true or is a fact”2) from the pub-lished information: this is necessary, because not all the pubpub-lished content can be checked, even if infinite manpower was available. In particular, text stating sentiment, stance, emotion etc. is by definition not worth checking. In our work, we focus on statis-tic claims(Chapter 6), i.e., sentences containing relationship between a statistic entity, e.g., GDP (Gross Domestic Product), with a statistic value, e.g., 5%. We believe that this type of claim enable us to to tackle more complex claims in the future.
2. Searching for relevant trustworthy data against which to check the claims. We focus on the statistic spreadsheets and HTML tables since these data sources haven’t been re-ceiving much attention in the literature (see Section3.2) but they contain highly relevant data for the fact-checking task. The difficulty of extracting meaningful information is the creativity of content providers, i.e, they can organize data as they see fit. Other type of data sources which have been well studied in the literature are search engine, knowledge base, Wikipedia, fact-checked claims (Section3.2).
1As a high-profile example, the “Pizzagate” false rumour (https://en.wikipedia.org/wiki/
Pizzagate_conspiracy_theory) has lead some outraged individual to actually open fire to revenge sup-posed victims of a (non-existent) child molester ring.
2https://dictionary.cambridge.org/dictionary/english/claim
3. Assessing claim truthfulness by comparing the claim with the reference data. There are many approaches to assess the truthfulness of claim in the literature (Section 3.4). We decided to let professional (e.g., journalist, fact-checker) perform this task with the relevant data that provide to them from the above task. From our point of view, it is really difficult to develop an automatic system because even human are not good enough at this task yet.
Sample reference data may come from statistic corpora established by trustworthy institutions, scientific publications, etc. The relevant data could be found in structured data in databases or unstructured data such as texts, images, etc.
We make the following observation here. Research efforts have been invested toward automat-ically computing a “reference database”, such as a knowledge graph, by compiling a very large number of data sources and assigning them some credibility scores. In this thesis, guided by our discussions with fact-checking journalists from the Le Monde journal, we take a different approach. We make the assumption that journalists know what sources are to be trusted, based on their professional training for what constitutes a reliable source, as well as the professional experience they acquire. Thus, throughout this thesis, we consider that the reference data is known, and work in this “closed-world” model, focusing on the best exploitation possible of the available reference data.
Manually extracting claims, identifying relevant reference data sources and assessing claim truthfulness is very time consuming.
The starting point of the work performed in this thesis is the observation that content manage-ment techniques (database managemanage-ment, information retrieval, knowledge bases managemanage-ment, and natural language processing) have the potential to (at least partially) automate the pro-cess. This was the assumption underlying the ANR project ContentCheck3, which provided the
framework of the present thesis. Its goal has been to develop tools toward automatizing such fact-checking pipelines.
Specifically, focused on the following problems:
1. Improving the accessibility and usability of reference data sources.
2. Identifying facts from textual content, e.g., newspapers, that need to be checked.
3. Querying the relevant data from the database to verify a given fact in an efficient manner.
1.2
Contributions and outline
The manuscript is organized as follows.
Chapter 2 introduces a set of preliminary notions we build upon: the Resource Description Framework (RDF), and a set of notions pertinent to the area of Information Extraction.
Chapter3 presents the state of the art in the fact-checking tasks which are: claim extraction, claim accuracy assessment, and reference source search. A set of related datasets, fact-checking challenges, and some end-to-end fact-checking systems are also presented.
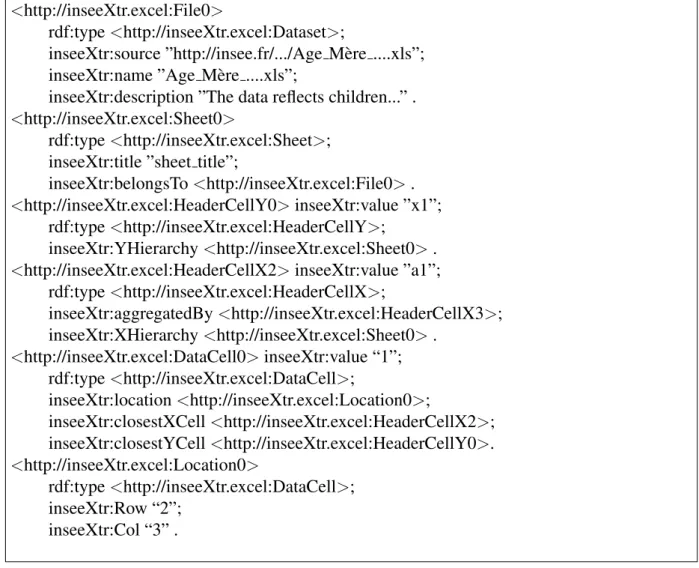
1.2. CONTRIBUTIONS AND OUTLINE 9 In Chapter 4, we discuss in details our algorithm to extract RDF data from statistic spread-sheets. The task is challenging as spreadsheets do not have an homogeneous layout; further, the extraction needs to preserve the structural relations between cells in a table (e.g., a given cell corresponds to a given line header and a given column header). This is complicated by the frequent presence of merged header cells in statistic spreadsheets. Our contributions are:
• an algorithm to extract header and data cells from spreadsheets (Excel files), and • an RDF corpus of the extracted data, which we release as Linked Open Data.
In Chapter 5, we develop a search algorithm to retrieve the relevant datasets with respect to a user query. The challenges are quantifying the relevance of datasets and identifying, within these datasets, the most relevant data snippets. Our contributions are:
• an efficient search algorithm;
• an evaluation against baselines confirming its interest, and • a prototype available online for end users.
Chapter 6 presents our approach to identify statistical mentions from claims, and generate queries to be solved by the search algorithm presented in Chapter5. We develop algorithms to identify whether a sentence contains a statistical claim and then extract the necessary informa-tion to formulate it. Our contribuinforma-tions are:
• an unsupervised approach for claim extraction, as well as
• the integration with the works described above, into an end-to-end system that identifies the reference information most relevant for a given claim found in an input text such as a media article or interview. For textual content from social networks (e.g., tweets), some more pre-processing steps should be performed to filter out the abbreviations, emoticons, etc.
In the above chapters, some related works specific to the techniques introduced in each chapter, but which did not pertain to the state of the art presented in Chapter3, are included next to the most relevant material.
In a related project to fact-checking task, we developed a system which extracts topics from a text corpus (consisting of tweets and news articles), and classifies each text according to these emergent topics (Chapter7). This system does not require labeled data for training; however, it obtains high performance in term of classification accuracy.
We conclude the thesis in Chapter8. All the algorithms devised during this thesis are distributed as open source software.
Chapter 2
Preliminaries
In this chapter we present the notions of the Resource Description Framework (Section 2.1) and Information Extraction (Section 2.2). We conclude the chapter with the reason why we chose these techniques to solve our problems (Section2.3).
2.1
Resource Description Framework
RDF (Resource Description Framework) is a framework for describing resources on the web. It is a W3C Recommendation from February 10th, 2004 [W3C, 2004].
The following concepts are used to define resources:
• URI (Uniform Resource Identifier) [Berners-Lee et al., 1998] is an unambiguous string that identifies a resource.
• Literal is used to identify values such as text or number.
• Blank node represents a resource for which an URI or literal is not given.
An RDF triple has three components: the subject which is an URI or a blank node; the pred-icate which is an URI that describes a binary relation between subject and object; the object which is an URI, a literal or a blank node. It is presented as (subject, predicate, object). An RDF graph is a set of RDF triples.
A standard URI part of the RDF format allow to describe the type of RDF resources. For exam-ple, to specify that a macbook belongs to Computer class, we use the following statement
ex:macbook rdf:type ex:Computer .
RDFS (RDF Schema) provides a small set of standard URIs which can be used to state re-lationships between classes and/or properties. For instance, the RDFS rdfs:subclassOf URI can be used to specify specialization relationships, for instance:
ex:Macbook rdfs:subclassOf ex:Computer .
Similarly, RDFS provides the rdfs:subpropertyOf URI for stating that a property is a
specialization (particular case of) another, for example ex:isCapitalOf rdfs:subpropertyOf ex:isCityOf . Finally, rdfs:domain allows stating that any resource having a certain
PREFIX ex : < h t t p : / / e x a m p l e . com / e x a m p l e O n t o l o g y #> SELECT ? c i t y WHERE { ? x ex : c i t y n a m e ? c i t y ; ex : i s C i t y O f ? y . ? y ex : c o u n t r y n a m e ex : F r a n c e . }
Figure 2.1: Sample SPARQL query.
property is of a certain type (called a domain of that property), and similarly rdfs:range can be used to state that any value of a certain property belongs to a certain type (called range of the property). For example, ex:City is the domain of property ex:isCapitalOf and ex:Countryis its range.
Open-World Assumption (OWA) It is important to understand that RDFS constraints are to be interpreted following an Open-World Assumption (they lead to implicit knowledge that was not explicitly present in the original RDF graph), not in a Closed-World Assumption (where all the data that holds is assumed to be part of the database). Under the Closed-World Assumption, a subtype constraint could be seen as “violated” if a resource of type c1 was not also stated to
be of type c2, where c2is a supertype of c1. In contrast, using RDFS constraints, there is never a
“violation” or “inconsistency” (the constraint language is not expressive enough); RDFS rules only lead to more (entailed) triples.
SPARQL (SPARQL Protocol and RDF Query Language) [Prud’hommeaux and Seaborne, 2008] is an RDF query language. It is a declarative query language (like SQL) that could manipulate and retrieve RDF data. The sample SPARQL query in Figure2.1returns all cities (?city variable) of France. Using the concept of basic graph pattern (an RDF graph which has subject, predicate, or object replaced by a variable), SPARQL answer the SELECT query by returning a mapping of variables in the query with URIs and literals from the queried RDF graph.
2.2
Information extraction
2.2.1
Information extraction tasks
Web scraping or web data extraction is the process of fetching web pages and extracting from them certain kind of information. For instance, one can be interested in extracting from Web pages that show real estate ads, the kind of property being shown (a house, a flat etc.) and its other characteristics, such as surface, price etc. The extracted data is stored in a structured data format, e.g., JSON (Javascript Object Notation), CSV (comma-separated values), etc. or in a database for future use.
Given a query q (a string of characters) and a collection D of documents (where a document could be either a structured data collection, or non-structured data such as a text), document ranking is the task of finding the subset Dq documents of documents relevant to the query
2.2. INFORMATION EXTRACTION 13 q, and rank them in the descending order given by a relevance score function. For instance, given the query “age of Emmanuel Macron”, and considering the set of Web pages indexed by a search engine as D, document ranking consists of finding the k (whose typical values are around 10 or so), which are most relevant for the given search terms. The principles, main data structures and algorithms for solving this task are described in textbooks such as [Frakes and Baeza-Yates, 1992].
Focused information retrieval is the task of locating relevant pieces of information in a docu-ment, in order to to answer a query. For instance, given the query “age of Emmanuel Macron”, instead of a ranked list of Web pages, focused information retrieval would try to return a text snippet such as “Emmanuel Macron turned 40”, found within a document.
Entity extraction (also known as named-entity recognition, entity identification, or entity chunking) is the process of identifying and classifying elements from text into pre-defined categories. For example, identifying all politician names from a collection of newspapers. Text classification is the task of classifying a text unit (sentence, paragraph, article, etc.) into appropriate categories. An example of this task could be classifying newspapers’ content into economy, politics, technology, etc. Fake news detection task is a text classification task which aims to classify whether a given text from newspaper is fake or not.
Stance detection is the task of detecting the semantic relationship (stance) between two pieces of text. E.g., the text “I could not focus well because of the notifications from Facebook” expresses a support stance toward the following text “The usage of social network reduces our concentration”. Some works is covered in these sections3.1,3.4,3.6.
2.2.2
Machine learning for information extraction
Recent years have seen an explosive adoption of machine learning techniques in the Informa-tion ExtracInforma-tion area. We distinguish the following family of techniques:
• Supervised learning designates a family of machine learning methods that map an input data point, i.e., a text representation (Section2.2.5) of text unit (e.g., a phrase, a sentence, a paragraph or an article), to an output, after learning the input-output correspondence on a labeled dataset. A standard practice is dividing the labeled dataset into three parts: the training set of labeled examples is used to learn (“train”) the statistical model, the development set (also called “dev set”, in short) is used to tune the model’s parameters, finally the test set is used to evaluate the model’s performance. The advantage of super-vised learning methods is that they are based on “gold standard” points (usually provided by humans); however, this is also their weakness, as human labor is generally expensive. Another weakness is the quality of gold standard because two humans could easily give two different labels to the same data point. Examples of supervised learning are
– Linear Support Vector Machines (Linear SVM) [Cortes and Vapnik, 1995] – Gaussian Na¨ıve Bayes [Friedman et al., 1997]
– Random Forests [Breiman, 2001] – Logistic Regression [Cramer, 2002]
• Unsupervised learning is a class of machine learning methods that do not require labeled data; this is an advantage given that they are no longer dependent on the availability of costly human-labeled examples. These methods try to learn from the data distribution in order to discover the interesting structures or semantic characteristics of the data. For example, given a dataset of news articles, a classifier following an unsupervised approach could group together similar articles thanks to the similarity of their semantic represen-tations. Some examples of unsupervised learning are
– k-Nearest Neighbour Classifiers [Cunningham and Delany, 2007] – Autoencoder [Rumelhart et al., 1986]
– Local outlier factor [Breunig et al., 2000]
• Semi-supervised learning is a hybrid between supervised and unsupervised learning. Given a set of labeled data L and another (bigger) set of unlabeled data U , the semi-supervised learning methods try to combine the useful information from both sets in order to improve over the performance of supervised models trained on only L. Further, by relying both on L and on U , semi-supervised learning reduces the dependency on a large set of labeled examples. An example of this approach is Transductive SVM [Joachims, 1999].
• Another approach to overcome the difficulty of creating large labeled datasets is distant supervision, which leverages knowledge from a knowledge base to generate the training data. However, this method faces the challenge on handling potentially noisy labeled (training) data thus obtained. This learning paradigm was proposed in [Mintz et al., 2009].
• Data programming is an approach proposed by [Ratner et al., 2016] that could create labeled data from user’s labeling functions using heuristics, patterns, etc. to express weak supervision signals. For example, on the task of extracting the relation isSpouseOf from text, a user could write the labeling function: “If two people who have the same child then they might be husband and wife” in order to return a label 1 (a positive training example) for the relation (A. Nguyen, isSpouseOf, B. Tran) from the sentence “C. Nguyen is the child of A. Nguyen and B. Tran”. The authors implemented a system called Snorkel [ Rat-ner et al., 2017] which learns from the agreements and disagreements of all the provided labeling functions to generate probabilistic label for every unlabeled data example. Their system analyzes the relationships of labeling functions to decide when to simply apply majority vote and when to infer the label from all the labeling functions. Finally, a super-vised machine learning model is trained to minimize a loss function of the probabilistic labels. The authors develop connectors to popular machine learning libraries to let end-users have a wide range of platform choices.
The predecessor of Snorkel is DeepDive [Zhang, 2015]. This system relies on heuristic rules and distant supervision to obtain the training data. Multiple labels for the same data example are resolved by majority vote.
2.2.3
Deep learning for information extraction
We recall here basic terminology and most frequently recurring deep learning models to which this manuscript will refer in the sequel.
2.2. INFORMATION EXTRACTION 15 A neuron is the basic unit (a node) of a neural network. A neuron receives its inputs consisting of a vector of numerical values {x1, x2, . . . , xn}, a vector of weights {w1, w2, . . . , wn} that
reflects the importance of each xi, and a bias vector b. The output of neuron Y is computed by
a non-linear activation function f :
Y = f ( X
1≤i≤n
wi× xi+ b)
The purpose of f is learning the non linear representations of the input data.
The most simple neural network is a feed-forward neural network that consists of multiple layers. Each layer is a collection of neurons. There are edges connecting neurons from two adjacent layers. Each edge contains weight that has been discussed previously. Layers could be classified into three types: input layer that represents the input data, hidden layer that trans-forms the data from the input layer to the output layer, output layer that represents the expected output data. A feed-forward neural network with more than one hidden layers is called multi layer perceptron.
There are more sophisticated neural network architectures. Convolutional neural networks (CNNs) [LeCun and Bengio, 1998] are designed to classify images. A CNN uses convolu-tional layers to learn the representations of local regions (e.g., a pixel and its eight surrounding pixels) from the input image. Each convolutional layer learns a specific visual feature. All these extracted features are sent to the output layer for the classification task. To handle text data, a local region is considered as n contiguous words. Specific linguistic feature is learnt in each convolutional layer. CNNs have been applied in text classification [Kim, 2014], relation extraction [Zeng et al., 2014], etc.
Recurrent neural networks (RNNs) are designed to process sequence data, e.g., text as a sequence of words. In the standard feed-forward neural network, neurons in the hidden layer are only connected to neurons from the previous layers. RNN allows the connection between two adjacent neurons in the hidden layer. This modification makes the network learn from the historyof the sequence encoded in the hidden layer. The effectiveness of RNNs has been shown in many tasks such as text classification, time series prediction, etc. RNN variants such as Long Short Term Memory (LSTM) [Hochreiter and Schmidhuber, 1997], Bidirectional LSTM (Bi-LSTM) [Schuster and Paliwal, 1997] are more popular than the vanilla RNN in practice.
2.2.4
Metrics for evaluating information extraction quality
It is often the case that we need to evaluate the quality of an information extraction process, in order to get a quantitative grasp of the trust which can be put in its output.
To evaluate the quality, a gold standard of answers considered correct (typically provided by humans) is usually assumed available. The gold standard is in some cases a set, e.g., objects which are sure to belong to a certain class (in a classification problem), or the set of all mentions of humans which an information extraction algorithm must identify in a text. In other cases, the gold standard is a list, for instance, when the problem is to return a ranked list of answers from the most relevant to the least relevant, and a ranked list of relevant answers is specified by a human. Based on such a gold standard, for a given information extraction method which returns a certain set of answers to a given task, a set of popular metrics are:
• Precision, denoted p, is the fraction of the returned results that are part of the gold stan-dard. Precision can be seen as reflecting the usefulness of a method, i.e., how many of the correct results are returned.
• Recall, denoted r, is the fraction of the gold standard that is part of the returned results. Recall can be seen as reflecting the completeness of the method. Precision indicates the usefulness while recall indicates the completeness.
• There is a natural tension between precision and recall; returning more results cannot decrease precision, but it can decrease recall, and vice versa. Thus, a single metric in-cluding both is the F1-score, defined as the harmonic mean of the two previous metrics: F 1 = 2 × pr
p + r.
• The above discussion is based on a “binary” setting where a result can be either be part of the gold standard (e.g., be “relevant”) or not. In a more general setting, e.g., classification with more than two classes, two variants of the F1-score can be defined, respectively, are macro-average and micro-average. The macro-averaged F1-score is the average of the F1-score of all classes. The micro-averaged F1-score is the weighted average of the classes’ F1-scores, which takes into account the contribution of all classes.
• ROC curve (receiver operating characteristic curve) is a plot of the two metrics of a classi-fication model: recall on the vertical axis, and FPR (False Positive Rate) in the horizontal axis. FPR is calculated as FPR = False Positive / (False Positive + True Negative) where False Positive refers to the situation when a binary classifier incorrectly predicts the pos-itive class and True Negative refers to the case when a binary classifier correctly predicts the negative class. The curve is constructed from all pairs (recall, F P R) correspond-ing to all classification thresholds, i.e., a float value to compare with the binary model’s probability in order to classify an example as positive or negative class.
Area Under the ROC Curve (AUC) is the area below the ROC curve which indicates the probability that a random positive example could be ranked higher than a random negative example.
The above metrics apply to a set (or unordered list) of results. For the context where the order of the retrieved results is important, for example web search results, we have to use the following metrics:
• Precision at k (P@k) is the precision computed based on the top-k retrieved results.
• Average precision at k is defined as as 1 min(m, k)
k
X
i=1
P @i × rel(i) where m is the number of actual relevant results, rel(i) indicates if the ithresult is relevant (rel(i) = 1) or not (rel(i) = 0).
• Mean average precision at k (MAP@k) is the average of n average precision at k. For example we execute n = 100 different queries against a search engine, compute the average precision at k = 10 for each query, and then compute M AP @k to evaluate the performance of this system.
2.2. INFORMATION EXTRACTION 17
2.2.5
Text representation
In order to apply machine learning techniques (Section2.2.2) on plain text, the latter first needs to be represented as numerical vectors.
A language model computes the probability of words that could appear in a fixed length se-quence. An n-gram, is a contiguous sequence of n words. For example the sentence “Machine Learning for Information Extraction” is represented by the following sequence of 2-grams: “Machine Learning”, “Learning for”, “for Information”, “Information Extraction”. A unigram and a bigram are n-grams where n equals to 1 and 2 respectively. An n-gram language model uses the sequence of n previous words in order to predict the next word.
In recent years, Natural Language Processing in general and Information Extraction in partic-ular widely take advantage of word embeddings which is a family of techniques capable of computing, starting from words/phrases, vectorial (multidimensional) representations thereof, in a numerical space. These techniques are based on the distributional hypothesis “a word is characterized by the company it keeps” (popularized by [Firth, 1957]), and they produce dense vectors (many non-zero components), whereas BoW produces sparse vectors (also called “one-hot”, with one or few non-zero components). A method representative of the word embeddings class is word2vec [Mikolov et al., 2013]. The interest of word embeddings is that once a text can be reduced to such a numerical representation, proximity (or similarity) between two texts can be computed easily, e.g., by means of a scalar product of the two. Word embeddings are typically learned from large, unlabeled text corpora. There are two variants of word2vec: Common Bag Of Words (CBOW) and skip-gram. CBOW predicts the target word w in a given sequence, e.g., “Have a w evening!”, using the context of w (“Have a ... evening!”) of w as input. On the contrary, skip-gram predicts the context using a given word as input. Both of these variants are based on training a neural network on text corpora. According to [Mikolov et al., 2013], skip-gram works well with small amounts of the training data, and represents well words or phrases which are rare, while CBOW is several times faster to train than the skip-gram, and has slightly better accuracy for the frequent words.
The success of word2vec inspired NLP (Natural Language Processing) researchers to come up with more powerful models such as
• Glove [Pennington et al., 2014] computes the embeddings from the statistics of word co-occurrences in a given corpus.
• fastText [Joulin et al., 2016] learns the embeddings from n-gram of characters, e.g., char-acter 3-grams of the word “fast” are “fas” and “ast”. This approach helps to deal with out-of-vocabulary words better.
• ELMo [Peters et al., 2018] introduces contextualized embeddings, i.e., the same word would have different vectors in different contexts.
• ULMFiT [Howard and Ruder, 2018] introduces a fine-tuning technique to obtain the meaningful text representation with each specific task such as text classification.
• BERT [Devlin et al., 2018] introduces the “masked language modeling” technique to take into account both left and right contexts simultaneously.
They also proposed similar techniques for representing phrases and sentences in a multidimen-sional space, including for instance Doc2Vec [Le and Mikolov, 2014].
In our work, we rely on word2vec in order to obtain a list of words that are semantically similar to a given keyword. This list helps our search engine (see Chapter5) to obtain more informative matches instead of exact matches.
2.3
Conclusion
One problem that we solve in this thesis is retrieving relevant statistic data with respect to a factual claim from text. The data comes from spread files which contains relationship between numerical data cell and its corresponding pair of header cells. There is also the parent-child relationship between a pair of header cell. The RDF framework allows us to easily model these relationships.
We implemented Information Extraction techniques in order to retrieve relevant data from text. Inspired by the success of Deep Learning in these recent years, we experimented with it as described in Section8.1. The empirical results were not good as we expected and we decided to adopt “white-box” approaches, i.e., computing relevant score function of a dataset (Chapter5) and defining extraction rules from a given sentence (Chapter6).
Chapter 3
State of the art of computational fact
checking
Journalists have been cooperating with professionals from other fields such as computer science and statistics to process numerical data, produce and distribute information. Data journalism [Gray et al., 2012] is the term to refers to that cooperation. With more and more digital contents produced, people encounter the rise of fake news which is the false, made-up, or misleading information with the aim of spreading to large (online) audiences. These news make use of the appealing imagery to attract more readers while presenting untrustworthy and unreliable sources [Machado et al., 2019].
The combat against fake news also attracts the attention of many researchers on the task of posteriori fact checking which is defined by [Cazalens et al., 2018] as the process of:
1. extracting claims from some discourse,
2. searching for the facts the claims are based on,
3. assessing the accuracy of the claim with regards to those backing facts, and 4. providing perspective to claims for which there is no straightforward settlement.
This process is illustrated in Figure3.1. In another study, [Graves, 2018] defined the automated fact checking process as a loop of three sub-tasks: identification, verification, and correction (Figure3.2). Fact checking is normally performed by trained fact checkers by evaluating pre-vious speeches, debates, legislation and published figures or known facts [Thorne and Vlachos, 2018]. [Rivas, 2019] propose that fact checking could be done using less resources with crowd-sourcing: the crowd present different arguments and evidence to verify a claim and a group of moderators will aggregate all the provided information to provide the final fact-check. How-ever the time consuming steps such as argument classification and stance detection should be automated. Finally, fact-checks should be published in order to correct the spread of fake news and untrustworthy claims [Graves, 2018].
In this chapter, we will firstly consider different methods for extracting claims (section 3.1). In Sections 3.2, 3.3, we will explore which data sources could be used for performing the fact-checking task. The different techniques to verify the truthfulness of a given claim are presented in Section3.4. Some fact checking related challenges are mentioned in Section3.5. Finally, we will mention some representatives of automated end-to-end fact checking systems
Claim accuracy assessment Claim Reference sources Reference source search Reference source analysis
and integration
Claim extraction Fact checking
output Media Putting claims into perspective Publishing and sharing
Figure 3.1: Fact checking tasks [Cazalens et al., 2018]
3.1. CLAIM EXTRACTION 21 in Section3.6and end this chapter with a conclusion in Section3.7.
3.1
Claim extraction
Two broad classes of methods can be used for this problem. Unsupervised methods are based on topic modeling algorithms, or sentence ranking; we discuss such methods in Section3.1.1. In a supervised setting, claim extraction is framed as text classification task, for example clas-sifying the given text (a sentence, an article) as “claim” (e.g., “The president claimed that the unemployment rate of France has been going down in these three years.”) or “not claim” (e.g., “The weather is nice today.”). It relies on labeled data, usually obtained through crowdsourc-ing. A supervised machine learning model is then trained using a set of appropriate features or input representation. We cover these techniques in Section3.1.2).
3.1.1
Unsupervised approaches
Pattern matching In [Levy et al., 2017], claims are extracted from Wikipedia using pattern matching with an automatically generated lexicon, and developing a ranking score on the matched sentences. We detail this below.
Firstly, the authors manually identify a list of debate topics (main concepts), denoted M C. Each of these topics is a concept, e.g., “doping in sport”, “boxing” etc. From Wikipedia, the authors extract a corpus of 1.86 millions sentences that contain these topics.
A sentence which has the structure “... that ... MC ...” is a candidate in which they search for a claim, e.g., “The president claimed that his government has reduced the unemployment rate to 5%.” The corpus is divided into two sets: c1 which contains the above structure and c2
which does not. They define a sentence suffix as the part of the sentence that follows a topic from M C. Then, for each word w in the vocabulary obtained from all sentences, they compute Psuf f(c1|w) = n1/(n1 + n2), where n1 is the number of sentences in c1 that contain w in
the sentence suffix, and n2 is the number of sentences in c2 that contain w. If Psuf f(c1|w) >
|c1|
|c1| + |c2|
, then w belongs to the set of words called Claim Lexicon (LC).
To rank a sentence s that matches the pattern “... that ... M C ... cl ...”, where cl is a word in CL (if there are more than one word from CL that appears in s after M C, the first one is selected), they take the average of two following scores:
• w2v: for each word w in s following the first ‘that’, they find the best cosine similar-ity between the word2vec representation of w and that of each word in M C, and then average the obtained scores;
• slop: this is number of tokens between the word ‘that’ and cl.
In the above, w2v is an average of two cosine similarities (thus, it is between 0 and 1) while slop is a natural number, thus it can go above 1. Averaging them amounts to (strongly) penalizing high slop values.
From a highly ranked sentence, a claim is extracted as being the words appearing after the word ‘that’, and until the end of sentence. In the sample sentence: “The president claimed that
his government has reduced the unemployment rate to 5%.”, the extracted claim would be “his government has reduced the unemployment rate to 5%”.
Their system reports a P@5 (precision at 5, recall Section2.2.4) score of 0.31 on the develop-ment set, and 0.32 on the test set. While these figures are quite low, the authors show that they improve over those of prior supervised extraction approach [Levy et al., 2014].
Topic modeling and topic extraction Another unsupervised approach to extract claim uses topic modeling algorithms to characterize the text that potentially contains a claim. [Ferrara et al., 2017] relies on Hierarchical Dirichlet Processes [Teh et al., 2004] in order to find the optimal number of topics from a text corpus. From the generated topics distribution, they compute a score called attraction score and then use it to classify sentences into four categories: claimwhich states that something is the case without any further proof, premise which is the proof to support or attack a claim, major claim which is the claim present in the beginning (introduction) of a document in order to express the main semantics of the whole document, and non-argumentative which is text that does not belong to the previous three categories. They report an accuracy of 0.3, which outperforms the accuracy of 0.1 of a random baseline. This choice of the baseline can be questioned; the reported accuracy of this method is quite low. In the error analysis, the authors gave an example of non-argumentative sentence “Why do some parents not think their kids can attain?” which has been labeled as premise by the model. They attempt to solve this problem in future work by studying the dependency relations among sentences in text.
Similarly, [Sobhani et al., 2015] use Non-Negative Matrix Factorization (NMF) [Lee and Se-ung, 2000] to extract topics from a text corpus which is a collection of 1,063 comments on 8 articles discussing breast cancer screening. Each topic is represented by a list of keywords, e.g., the topic “Mammo can cause cancer by its radiation” is represented by “radiation, lumpectomy, expose, need, colonoscopy, surgery, chemo, cause, radiologist, machine, treatment, exposure, safe, thermography” [Sobhani et al., 2015]. Annotators attach to each of these topics some arguments from a predefined list, such as “Mammo may cause cancer”, “Financial benefit of mammo for medical industry”, etc.
On a corpus of 781 comments on news articles, they report an F1-score of 0.49 for the topic clas-sification task (classifying the arguments to which a comment belong). Finally, on the stance classification task (classifying each comment as for or against the comment’s arguments), they train an SVM model using:
• TF-IDF [Jones, 1972] features: each comment is transformed into a TF-IDF word count vector;
• the predicted topic topics from NMF which lead them to an F1-score of 0.77.
3.1.2
Supervised methods
SVM classification The authors of [Liebeck et al., 2016] seek to annotate a corpus with three categories:
3.1. CLAIM EXTRACTION 23 1. major position, which is a citizen suggestion (e.g., “We should build a playground with
a sandbox.”),
2. claim, which expresses a “for” or “against” stance toward a major position (e.g., “I dislike your suggestion.”), and
3. premise, which is a reason to attack or support a major position (e.g., “This would allow us to save money.”).
Each sentence is also annotated as argumentative (containing argument components) or non-argumentative. Finally, they obtain a dataset that consists of 548 major positions, 378 claims, and 1,244 premises. The authors observe that comment writers use different tenses and sentence structures for each category, e.g., claims are often stated with “I agree!”, as in: for “I agree! Building the airport would create more jobs”. Based on this observation, they use the frequency of POS1tags and dependencies in the TIGER annotation scheme [Brants et al., 2004] as features
of the SVM classifier. They also use the unigrams and bigrams of the sentences as binary features (values of 1 or 0 if the unigram/bigram appears or does not appear respectively in the given sentence).
On the subtask of classifying sentences as argumentative or non-argumentative, they obtained a macro-averaged F1-score of 0.69. On the subtask of classifying sentences into the three categories (major position, claim, premise), they got a macro-averaged F1-score of 0.68. SVM is also used by [Lippi and Torroni, 2016] to detect claims from political speeches. They extract the audio features using the RastaMat library2 and combine them with standard text
features: unigrams, bigrams, part-of-speech tags3, and lemmas4sentences.
On three datasets of 122, 104, and 160 audio samples, respectively, they report the 10-fold cross validation macro-averaged F1-score of 0.52, 0.52, and 0.31 respectively.
Logistic regression [Konstantinovskiy et al., 2018] rely on InferSent [Conneau et al., 2017] which takes word order into account to represent the input sentence. In this collaborative work with Full Fact5, they define seven categories to annotate input sentences:
• personal experience (e.g., “I can’t save for a deposit.”),
• quantity in the past or present (e.g., “The Coalition Government has created 1,000 jobs for every day it’s been in offic”,
• correlation or causation (e.g., “Tetanus vaccine causes infertility”),
• current laws or rules of operation (e.g., “The UK allows a single adult to care for fewer children than other European countries.”),
• prediction (e.g., “Indeed, the IFS says that school funding will have fallen by 5% in real terms by 2019 as a result of government policies.”),
• other type of claim (e.g., “The party promised free childcare”), • not a claim (e.g., “Questions to the Prime Minister!”).
1the category of words such as noun, adjective, verb, etc.
2http://labrosa.ee.columbia.edu/matlab/rastamat 3the category of words such as noun, adjective, verb, etc.
4the canonical form of a set of words, e.g. work is the lemma of work, works, worked, working. 5https://fullfact.org
According to Full Fact’s experience, these categories are sufficient to cover texts from political TV shows. Then 80 volunteers were recruited from Full Fact’s newsletter to annotate a dataset consisting of 6,304 sentences using Prodigy6. They consolidate these through a majority vote,
to obtain a set of 4,777 annotated sentences where at least three out of five annotators agree on a sentence label. They expand the dataset by adding a set of annotated claims from Full Fact’s database. The final dataset has 5,571 sentences.
After obtaining the sentence embeddings from InferSent, they concatenate it with the count of parts of speech and named entities found in each sentence to create the feature vector. They feed these vectors into standard supervised classifiers including Logistic Regression, Linear SVM, Gaussian Na¨ıve Bayes, and Random Forests. Through their experiments of classifying a given text into “claim” and “not claim” categories, Logistic Regression has the highest performance in term of F1-score (0.83). This score is higher than those of ClaimBuster [Hassan et al., 2017] (0.79) and ClaimRank (0.77) [Gencheva et al., 2017]. The authors believe that ClaimBuster has the caveat of having to select a cut-off score to determine whether a given text is claim or not. The text representation in ClaimBuster is TF-IDF which is less informative in compared with the sentence embeddings representation in this work. They also discover that the POS/NER features do not contribute to their model’s performance.
On the task of classifying claims into the seven predefined categories, their model achieves a micro-averaged F1-score of 0.7 and a averaged F1-score of 0.48. The low macro-averaged score is explained by small number of examples of classes like “Current laws” and “Correlation or causation”.
Recurrent neural network The approach proposed in [Hansen et al., 2019] is to develop a neural network for the task of finding check-worthy sentences, which takes advantage of large amounts of unlabeled data. Each word is represented by word embeddings to capture its semantics and by syntactic dependency tag7to capture its role, for example being the subject of its sentence. By using the syntactic dependency tags, they aim to discover the discriminative sentence structures for the check-worthy sentences. Given a pair of sentences s1 and s2, let
• W be the set of words that appear in both s1and s2
• t(w, s) be the syntactic dependency tag of the word w in the sentence s
• overlap(w, s1, s2) = 1 if t(w, s1) equals to t(w, s2) otherwise overlap(w, s1, s2) = 0
They define the overlap of the syntactic dependency tags of s1 and s2as:
O(s1, s2) =
X
w∈W
overlap(w, s1, s2)
From three types of sentences: check-worthy sentences, non check-worthy sentences, and mixed of both, they sample randomly 10 pairs from each type and then compute the aver-age O(s1, s2). After repeating this experiment 1,000 times, they obtain the highest average
overlap from the pairs of check-worthy sentences and conclude that syntactic dependencies could help to distinguish between check-worthy sentences and non check-worthy ones. The word representation consisting of word embeddings and syntactic dependencies is sent to a re-current neural network. They use the attention mechanism [Bahdanau et al., 2015] in order to
6
https://prodi.gy/
3.1. CLAIM EXTRACTION 25
Figure 3.3: Model’s prediction ( ˜Y ) vs. ground truth labels (Y ) [Hansen et al., 2019]. The intensity of the color increases with the relevance of the highlighted text.
identify the relevance of words/phrases with respect to model’s prediction result. They propose a visualization of the model’s prediction result, as illustrated in Figure3.3.
The evaluation dataset E of [Hansen et al., 2019] consists of 2,602 sentences with check-worthiness annotations at sentence level. They further divide E into a training set T rainE and
a test set T estE. The weakly labeled dataset W consists of 37,732 sentences from the public
speeches of Hillary Clinton and Donald Trump during the 2016 U.S. election. They use the ClaimBuster [Hassan et al., 2017] API8to obtain a check-worthiness score s (a value between
0 and 1) for each sentence. Let f be the percentage of check-worthy sentences from T rainE,
they find a threshold τ such that the percentage of sentences from W that have score s ≥ τ is f . Sentences from W whose score s ≥ τ are labeled 1 (check-worthy); the others are labeled 0 (non check-worthy). Using the labels thus obtained, they can train their neural network with a large amounts of data without labelling them manually.
15,059 documents9related to all U.S. elections (such as speeches, press releases, etc.) are used
to train domain specific word embeddings. Using MAP, P@5, P@10, P@20 (see Section2.2.4), and P@R (where R is the number of check-worthy sentences in the evaluation dataset) as evaluation metrics, the authors report significant higher scores (from 9 to 28%) compared to the following systems: ClaimBuster [Hassan et al., 2017], TATHYA [Patwari et al., 2017], ClaimRank [Gencheva et al., 2017] and the systems of [Zuo et al., 2018] (see Section 3.5), [Konstantinovskiy et al., 2018]. Incorporating the weakly labeled dataset W as an additional
8
https://idir-server2.uta.edu/claimbuster/
9
https://web.archive.org/web/20170606011755 and /http://www.presidency. ucsb.edu/
source of training data further raises all the scores.
3.2
Reference source search
For a given claim, a fact checking system searches for relevant reference sources from different sources. Below, we list the main categories of reference sources, and outline how the most relevant data for a given claim is found.
• Search engine such as Google, Bing. The claim could be issued directly against the search engine [Zhi et al., 2017]. Or it could be converted into search query by retain-ing only its verbs, nouns and adjectives [Nadeem et al., 2019, Karadzhov et al., 2017]. Named entities, e.g., location, person’s names, etc. could also be added to the query issued to the search engine [Karadzhov et al., 2017,Wang et al., 2018].
• Knowledge bases such as DBpedia [Lehmann et al., 2015] and SemMedDB [Kilicoglu et al., 2012] can be leveraged to find the most probable paths in the knowledge base that connect the subject and object of a claim given in a triple format subject, predicate, object[Shi and Weninger, 2016]. The evidence facts related to a given claim could also be extracted from knowledge bases [Ahmadi et al., 2019].
• Wikipedia pages could be used to support or refute a given claim [Thorne et al., 2018]. A subset of sentences from these pages could also be retrieved to give specific evidence to explain the systems’ decision.
• Previously fact checked claims could be compared with the given claim to find out whether a fact check for this claim already exists [Hassan et al., 2017,Lotan et al., 2013]. Such a comparison can be made based on a text similarity measure between the claim and the previously fact-checked claims.
• Social media content has been used as background (reference) information in [Goasdou´e et al., 2013]: social media content is archived, then person names are used as search terms in order to identify the posts from a given actor.
• Table cells could be aligned with textual mentions of quantities in [Ibrahim et al., 2019].
3.3
Related datasets
We list below a set of datasets released by different organizations and/or research teams having worked in the above-mentioned areas.
• Wang [Wang, 2017] released a dataset10consisting of 12,836 human labeled short
state-ments from the API of politifact.com11. Each data point includes a statement in plain text, a label which expresses the truthfulness of statement (“pants on fire”, “false”, “barely true”, “half-true”, “mostly-true”, and “true”), the speaker (a politician) name and some 10
https://www.cs.ucsb.edu/˜william/data/liar_dataset.zip
3.4. CLAIM ACCURACY ASSESSMENT 27 meta-data (job title, party affiliation, state, and “credit history”, which counts the differ-ent labels assigned to past statemdiffer-ents of this speaker), and a context (venue/location of the statement, e.g. TV debate, social network, etc).
• The Fake News Challenge [Pomerleau and Rao, 2017] provided a dataset of 49,972 triples12 of the form: news article’s headline, news article’s body text, and stance of the body relative to headline.
• The FEVER challenge [Thorne et al., 2018] introduced a dataset of 185,445 claims car-rying a label among Supported, Refuted or NotEnoughInfo. For the first two labels, they also provided the combination of sentences as evidence to support or refute the claim. • Datacommons.org released a dataset13which follow the ClaimReview14standard. It
con-tains 12,545 fact checking articles, authored by human writers, as well as a set of extra information for each of them: details about the claim, the URL of fact checking article, the fact checker, the truthfulness rating, and the published date.
• [Popat et al., 2017] provided a dataset15 of 4,856 claims from the Snopes website16 to-gether with their labels (true or false). They also provided the set of relevant articles collected from Google’s search results for the given claims.
• [Mukherjee and Weikum, 2015] introduced the NewsTrust17dataset18, consisting of 47,565 news articles from sources like New York Times, TruthDig, etc. Overall, the articles come from 5.6K distinct sources. Each article contains at least one review and rating from community members who are professional journalists and content experts. Com-munity member profiles containing their occupation, expertise, demographics, reviews, and ratings are also included in this dataset.
3.4
Claim accuracy assessment
In order to verify a given claim, external sources could be retrieved to obtain more relevant data (Section3.4.1). When the data is structured as a knowledge graph, claim accuracy assessment is related to the problem of link prediction or reasoning on logic rules (Section3.4.2). Some other researchers rely on linguistic features of text to assess claim truthfulness (Section3.4.3) or user inputs to verify a claim’s credibility (Section3.4.4).
3.4.1
Using external sources
[Karadzhov et al., 2017] use search engine results in order to verify the truthfulness of a claim expressed in natural language.
12https://github.com/FakeNewsChallenge/fnc-1 13https://www.datacommons.org/static/fact_checks_20190315.txt.gz 14http://schema.org/ClaimReview 15http://resources.mpi-inf.mpg.de/impact/web_credibility_analysis/Snopes. tar.gz 16 snopes.com 17 newstrust.net 18http://resources.mpi-inf.mpg.de/impact/credibilityanalysis/data.tar.gz
Given a claim in plain text, they rank its words by TF-IDF [Jones, 1972]. Only verbs, nouns and adjectives are kept. They also detect named entities, e.g., location, person names etc. using IBM’s Alchemy API19. For example, from the original claim “Texas, teenager Ahmed
Mohamed was arrested and accused of creating a hoax bomb after bringing a home-assembled clock to school”, they generate a query “Texas, Ahmed Mohamed, hoax, bomb, clock, arrested, accused”. The aforementioned approach to generate queries from claims is also adopted by [Nadeem et al., 2019]. But apart from the relevant documents identified through a search engine call, they also collect those from Apache Lucene20on the 2017 Wikipedia dump. Finally, a
re-ranking model [Lee et al., 2018] is applied to obtain the top-k relevant documents.
The search query is executed against search engines (Google and Bing) and the ten first web pages returned by each of these are kept as supporting documents. From each such document, each sequence of three consecutive sentences is compared with the claim through a similarity function. The sequence most similar to the claim is called the best-matching snippet.
To generate a vector representation of a text, they transform the text into the average of the Glove embeddings (Section 2.2.5) of its words, which they subsequently pass to Bi-LSTM (Section 2.2.3). Five different texts are used to generate the vector representation of a given claim: the claim itself, Google supporting documents, Bing supporting documents, Google best-matching snippets, and Bing best-matching snippets. The similarity scores (cosine simi-larity of the embeddings vectors) between the claim and a snippet, or the claim and a web page are added to the concatenation of these vectors to form the final text representation. They pass this representation to a binary classifier to classify the claim as true or false.
On a dataset consisting of 761 claims from snopes.com, the above mentioned model achieves an F1-score of 0.772 on the test set.
Similarly, given a fact-checking article, [Wang et al., 2018] retrieves related documents using a search engine. Then a binary classifier is trained to predict the relevance of a document with re-spect with the given claim in the article. They train a model to classify the relevant document’s stance (contradicting or supporting) with respect to the claim. To obtain the training data, they build a corpus of fact-checking articles containing exactly one ClaimReview21 markup. They retain only articles from the highly reputed fact checking communities; this leads to a corpus of 14,731 articles.
To generate the relevant documents, they issue search queries to Google and collect the top-100 results. Queries of a claim are generated from:
1. The title of the fact-checking article and the claim of the ClaimReview markup.
2. The entities extracted from title and claim text using entity resolution [Mendes et al., 2011]. For example, given the claim “A video documents that the shootings at Sandy Hook Elementary School were a staged hoax”, the extracted entities are video, docu-ments, shootings, Sandy Hook Elementary school, and hoax. A confidence score is also given for each entity. This step is performed to retain only the important words in the query.
3. The 50 most popular search queries that led to clicks on the fact-checking article. 19
www.ibm.com/watson/alchemy-api.html
20
https://lucene.apache.org
3.4. CLAIM ACCURACY ASSESSMENT 29 This approach has a recall of 80%.
Through crowdsourcing, they obtain a labeled corpus of 8,000 (fact-checking article, related document) pairs. The features of this model consisting of:
1. Text similarity: Each piece of text is represented by the weighted sum of word2vec embeddings over its words and phrases. They denote sim(t1, t2) the cosine similarity of
the text representations of two texts t1 and t2. A set of similarity scores are computed as
following:
• sim(claim, document title) • sim(claim, document headline)
• max sim(claim, each sentence from the document) • max sim(claim, each paragraph from the document)
• max sim(sa,sd)where sais a sentence from the article title, article headline, or from
the article’s sentences such that sim(claim, sa)is above a pre-defined threshold θ and
sdis a sentence from the document
• sim(claim, document) • sim(claim, article)
2. Entity similarity: From the list of the extracted entities from the article and the docu-ment, they build an entity confidence score vector {c1, c2, . . . , ck} where ci is the
confi-dence score of the extracted entity ei if ei appears in both sides, and ciis 0 if eiis found
in only one side.
3. Publication order: The publication dates of the article and the document are collected. This information is collected since it is assumed that fact-checking articles are published around the same publication time of the claim.
Based on these features, they build a gradient boosted decision tree model to determine the relevance of a related document toward the fact-checking article. Their system got an accuracy of 81.7%.
Their idea for building the stance classifier is to identify within a documents, the elements that are contradictory to the claim. A contradiction vocabulary is collected for this purpose. Then they collect key texts including title, headline and important sentences whose similarity score with the claim is above a certain threshold. They call key component the concatenation of a key text, the sentence preceding it and the sentence after it. Finally, they extract unigrams and bigrams from key components and output a weighted n-grams vector over the contradiction vocabulary as feature of the gradient boosted decision tree model. On a labeled dataset of 8,422 examples, they obtained the accuracy of 91.6% on test set.
[Zhi et al., 2017] also rely on relevant news articles from Google search to verify a given claim from snopes.com. The sources credibility of these articles is taken into account. They imple-mented a system consisting of four modules: stance extraction, stance classification, article classification, and source credibility assessment, as follows:
• The stance extraction module retrieves articles relevant for the given claim through Google search (they retrieve the top 30 web pages). They generate snippet candidates by
removing sentences of less than K words, and combining each L consecutive sentences into a snippet. Through empirical studies, they find the optimal values K = L = 3. Then they compute the Doc2vec cosine similarity between the claim and each snippet, to retain the candidate snippets having a similarity higher than 0.55.
• The stance classification module trains a Random Forests classifier on the embeddings of candidate snippets and the labels from the fact database. This module outputs two stance scores, as the probability of having a snippet support or refute a claim.
• The article classification module trains a classifier (also using Random Forests) to de-termine whether an article supports or refutes a claim by using the three snippets with the highest stance scores. These scores help them to further divide an article into three categories: fully supportive, completely refuting, and a mixture of the former stances. Similar to [Nakashole and Mitchell, 2014], they capture the text subjectivity to detect high confidence stances. Some linguistic features are taken into account for this purpose: (1) factive verbs such as know, realize, etc. (2) assertive verbs such as think, believe, etc. (3) mitigating words such as about, apparently, etc. (4) report verbs such as admit, agree, etc. (5) discourse markers such as could, maybe, etc. (6) subjective/bias words such as accept, abuse, etc. These features are encoded into one-hot feature vectors.
• The source credibility assessment module measures the reliability of article’s source. They obtain this assessment by using Web of Trust (WOT)22. In another study, [Nadeem
et al., 2019] use the Media Bias/Fact Check website23 to assess the credibility of media sources. They obtain the three labels high or very high, low and low questionable, and mixedfor 2,500 news websites.
Finally, the truthfulness of a given claim is measured as a weighted sum of the stance scores provided by the article classifier and the WOT score. On a test set of 105 claims, the authors report an accuracy of 83.63% for the stance classifier and an accuracy of 85.25% for the task of predicting claim truthfulness.
3.4.2
Using a knowledge graph
Given a statement that is described as an RDF triple (subject, predicate, object), e.g., (Chicago, isCapitalOf, Illinois), [Shi and Weninger, 2016] first determine the type of the subject, in this occurrence city, and that of the object, in this example state. Then they collect the set T+
of node pairs of the form (instance of type city, instance of type state) that are connected by any path in the knowledge graph. Similarly, they collect the set T− of node pairs of the form (instance of type city, instance of type state) that are not connected by any path in the knowledge graph. The set of predicates that connect node pairs in T+ and T− is called meta path. Meta paths obtained from T+and T−lead to the positive and negative training examples, respectively. They prune meta paths considered irrelevant by calculating the information gain of each path and retaining the top-k ones. Information gain is calculated with the following formula: IG(Xj, y) = X xij∈Xj X yi∈y p(xij|yi) log p(xij|yi) p(xij)p(yi) 22 https://mywot.com/wiki/API 23https://mediabiasfactcheck.com/
3.4. CLAIM ACCURACY ASSESSMENT 31 where:
• X is the training dataset consisting of n training examples x1, x2, . . . , xn. Each training
example xiis an m-dimensional vector representing the meta path (pi1, pi2, . . . , pim). xij is the number of node pairs connected by the predicate pij;
• Xj = (x1j, x2j, . . . , xnj) is the j-th column in X;
• yi ∈ {0, 1} is the label of the ith training example;
• y is the set of all labels; • p(xij) =
xij
P
i,jxij
is the relative importance of xij, the number of pairs connected by
predicate pij, among all the elements of the X matrix; • p(xij|yi) =
xij
P
k∈{1,2,...,n}:yk=yixkj
is the relative importance of xij among the elements
in the column Xj having the label yi
• p(yi) =
P
k∈{1,2,...,n}:yk=yi1
n is the frequency of the label yiwithin the training set. Intuitively, the information gain reflects the relevance of a feature (a column of X) with respect to the target y. Removing irrelevant features result a better training set.
These top-k meta paths are used to train a binary logistic regression and to explain the predicted link between subject and object of the given statement.
Thus, in this work, truthfulness is assessed with the help of a link prediction approach, which intuitively states how likely the given triple is, by comparing with how frequent (likely) similar triples hold for similar (subject, object) pairs. This approach requires that the subject and object be typed; further, if one or both had several types, some extension to this method would be needed.
The authors present experiments carried on two large knowledge bases DBpedia [Lehmann et al., 2015] and SemMedDB [Kilicoglu et al., 2012]. When comparing against six other link prediction models, one fact checking model and an association rule mining model, they report the highest area-under-curve (AUC) on 5 out of 7 link-prediction tasks.
This work also provides human-interpretable, intuitive explanations of their prediction, by showing the most probable paths in the knowledge graph that connect the type of subject and object. A sample explanation when checking the above sample triple is: “a US city is likely to be the capital of a US state if an state agency with jurisdiction in that state has its headquarters in that city”.
[Ahmadi et al., 2019] uses rules and evidence from knowledge graph (KG) in order to explain fact-checking outputs. A KG contains facts as RDF triples of the first p(s, o) where p is a predicate connecting a subject s and an object o. For example, the claim “William Durant was the founder of Chevrolet” is true because of the two triples keyP erson(Durant, Chevrolet) and f oundedBy(Durant, Chevrolet). The following claim “Elon Musk was the founder of
Chevrolet” is false because of these three triples f oundingY ear(Chevrolet, a), birthY ear(M usk, b), greater(b, a). In a nutshell, the authors mine rules from the KG; to fact-check a claim
![Figure 3.2: Core elements of automated fact-checking [Graves, 2018]](https://thumb-eu.123doks.com/thumbv2/123doknet/14538574.724398/21.892.116.784.164.464/figure-core-elements-automated-fact-checking-graves.webp)
![Figure 3.3: Model’s prediction ( Y ˜ ) vs. ground truth labels (Y ) [Hansen et al., 2019]](https://thumb-eu.123doks.com/thumbv2/123doknet/14538574.724398/26.892.257.641.119.552/figure-model-prediction-y-ground-truth-labels-hansen.webp)
![Figure 3.5: ClaimBuster’s system architecture [Hassan et al., 2017]](https://thumb-eu.123doks.com/thumbv2/123doknet/14538574.724398/40.892.138.764.123.410/figure-claimbuster-s-architecture-hassan-et-al.webp)
![Figure 3.6: A document retrieved for the claim “ISIS infiltrates the United States” [Nadeem et al., 2019]](https://thumb-eu.123doks.com/thumbv2/123doknet/14538574.724398/41.892.128.772.123.504/figure-document-retrieved-claim-infiltrates-united-states-nadeem.webp)