HAL Id: hal-01199207
https://hal.inria.fr/hal-01199207
Submitted on 15 Sep 2015
HAL is a multi-disciplinary open access
archive for the deposit and dissemination of
sci-entific research documents, whether they are
pub-lished or not. The documents may come from
teaching and research institutions in France or
abroad, or from public or private research centers.
L’archive ouverte pluridisciplinaire HAL, est
destinée au dépôt et à la diffusion de documents
scientifiques de niveau recherche, publiés ou non,
émanant des établissements d’enseignement et de
recherche français ou étrangers, des laboratoires
publics ou privés.
Impact of User Patience on Auto-Scaling Resource
Capacity for Cloud Services
Marcos Dias de Assuncao, Carlos Cardonha, Marco Netto, Renato Cunha
To cite this version:
Marcos Dias de Assuncao, Carlos Cardonha, Marco Netto, Renato Cunha. Impact of User Patience on
Auto-Scaling Resource Capacity for Cloud Services. Future Generation Computer Systems, Elsevier,
2015, pp.1-10. �hal-01199207�
Impact of User Patience on Auto-Scaling Resource Capacity for Cloud Services
Marcos Dias de Assunc¸˜aoa,∗, Carlos H. Cardonhab, Marco A. S. Nettob, Renato L. F. Cunhab
aInria, ENS de Lyon, France bIBM Research, Brazil
Abstract
An important feature of most cloud computing solutions is auto-scaling, an operation that enables dynamic changes on resource capacity. Auto-scaling algorithms generally take into account aspects such as system load and response time to determine when and by how much a resource pool capacity should be extended or shrunk. In this article, we propose a scheduling algorithm and auto-scaling triggering strategies that explore user patience, a metric that estimates the perception end-users have from the Quality of Service (QoS) delivered by a service provider based on the ratio between expected and actual response times for each request. The proposed strategies help reduce costs with resource allocation while maintaining perceived QoS at adequate levels. Results show reductions on resource-hour consumption by up to approximately 9% compared to traditional approaches.
Keywords: Cloud computing, auto-scaling, resource management, scheduling
1. Introduction
Cloud computing has become a popular model for hosting enterprise and backend systems that provide ser-vices to end-users via Web browsers and mobile deser-vices [1, 2]. In this context, a typical scenario often comprises a provider of computing and storage infrastructure, gen-erally termed as Infrastructure as a Service (IaaS) or simply a cloud provider; a service provider who offers a web-based service that can be deployed on Virtual Ma-chines (VMs) hosted on the cloud; and the clients, or end-users, of such a service.
In this work, we investigate challenges faced by the service providers who compose their resource pools by allocating machines from cloud providers. Meet-ing end-users expectations is crucial for the service provider’s business, and in the context of Web applica-tions, these expectations typically refer to short requests response times. Simultaneously, there are costs asso-ciated with resource allocation, so resource pools with low utilisation are economically undesired. Moreover, clients demands are uncertain and fluctuate over time, so the problem of resource allocation faced by service providers is clearly non-trivial.
Elasticity, a selling point of cloud solutions, enables service providers to modify the size of resource pools
∗Corresponding author: [email protected]
in near real-time via auto-scaling strategies, allowing hence for reactions to fluctuations on clients’ demand. Current strategies typically monitor and predict values of target system metrics, such as response time and util-isation level of relevant resources (e.g., CPU, memory, and network bandwidth), and employ rule-based sys-tems to trigger auto-scaling operations whenever prede-fined thresholds are violated. The parameters employed by these strategies do not allow them to explore hetero-geneity of expected response timesand of tolerance to delaysthat end-users have towards service providers. In combination with actual response times, these two ele-ments define the perception end-users have from a ser-vice QoS, which we will refer to as user patience.
Previous work in other domains has shown that end-users can present heterogeneous patience levels depend-ing on their context [3]. Moreover, in a society where human attention is increasingly becoming scarce, and where users perform multiple concurrent activities [4]1 and use multiple devices [5]2, response time might not
be the sole element defining the perceptions end-users have from a service’s QoS. Our previous work inves-tigated how application instrumentation [6, 7, 8], and end-user context and profiling [9] could be used in the
1Ofcom reports that up to 53% of UK adults media multi-task
while watching TV.
2Accenture’s study shows users expect other devices to augment
End-user Service
provider providerCloud
Request service
Deploy service
loop
Monitor service metrics (e.g. util.) alt
[trigger scale in/out] Compute step
Request scale in/out Service provider allocates a resource pool
from the cloud to host a service Users access the cloud-hosted service Service provider/cloud monitors the service, computing metrics such as resource utilisation
If a metric, e.g. utilisation, is outside pre-defined limits, a scale in/out operation may be triggered Compute the step size, i.e. number of VMs to allocate or release
Trigger activation/deactivation of resources
1 2 3 4 5 6
Figure 1: Service provision model and auto-scaling scenario considered in this work.
collection of honest signals determining how clients in-teract with a service provider and what their levels of patience are when making requests.
The present work investigates how patience can be explored by auto-scaling strategies. Compared to our previous work [8], in addition to considering provision-ing time, this article makes the followprovision-ing contributions: • A scheduling algorithm and a patience-based auto-scaling triggering strategy for a service provider to minimise the number of resources allocated from a cloud provider, applicable to scenarios where the maximum number of available resources is un-bounded (§ 3);
• Experiments with bounded and unbounded num-bers of resources available to service providers that show reductions of up to nearly 9% on resource-hour consumption compared to traditional auto-scaling strategies (§ 4).
2. Problem Description
In this section we describe the scenarios investigated in this work, present the assumptions regarding capacity limitations on the pool of resources offered by the cloud provider, and explain the elements of client behaviour which are taken into account by our algorithms.
Figure 1 depicts the service hosting model and the main steps of auto-scaling operations. A service provider allocates a pool of VMs from a cloud provider
to deploy its service, which is then accessed by end-users. The service provider and/or cloud provider peri-odically monitors the status of the pool, thus computing metrics such as resource utilisation. A metric lying out-side certain lower and upper limits may trigger a scale in/out operation. A step size — the number of VMs to be allocated or released — is computed before a change to the capacity of the resource pool is requested.
Resources are pairwise indistinguishable, that is, they are VMs which have the same cost and performance characteristics. We also consider provisioning time; namely, after triggering the activation of resources, a service provider must wait for non-negligible time to use them. Finally, the scenarios either have a maximum number of resources that can be allocated (bounded) or do not have limitations of this nature (unbounded); these two scenarios are considered because they pose di ffer-ent levels of stress on resource utilisation.
We take into account that resources are paid only for the periods in which they were allocated in a per-minute billing model. This assumption is not unrealistic, as providers such as Microsoft Azure offer this type of ser-vice. Consequently, the strategies proposed in this arti-cle may allocate and deallocate a given resource several times within one hour in order to improve utilisation.
This work also considers short tasks whose execution times are all equal and in the order of a few seconds, reflecting hence scenarios typically faced by providers of web services. Nevertheless, the concepts and results can, without any loss of generality, be reproduced in scenarios with either shorter or longer tasks.
Impact on patience
QoS
(Above expectation) (Below expectation)
Figure 2: Prospect theory modelling variations of user patience as a function of QoS [10]; where QoS can represent expectations on, for instance, request response time and jitter.
We assume that expectations on response time may vary across individuals, a realistic assumption in cer-tain practical settings; for example, whereas end-users expect to get results from Web searches in a couple of seconds at maximum, clients performing large-scale graph mining operations, which can take from minutes to hours, tend to be more tolerant.
Differences between expected and actual response times for submitted requests have an impact on users’ patience (either positive or negative) whose weight de-creases over time. More precisely, changes on the pa-tience level of an end-user take place after the execution of each request and are described by a function applied to the ratio between expected and actual response times. Based on Prospect Theory [10], we assume that the neg-ative impact of delays on users’ patience exceeds the benefits of fast responses (see Figure 2).
The service provider periodically evaluates the sys-tem utilisation and/or user patience and decides on whether the capacity of its resource pool should be expanded (shrunk) by requesting (releasing) resources from (to) the cloud. The questions we therefore seek to address are: (i) how to determine critical times when auto-scaling is necessary or avoidable by exploiting information on users’ patience; (ii) how to determine the number of resources to be allocated or released; and (iii) how strategies behave under scenarios with and without restrictions on the maximum number of re-sources that can be allocated.
3. Algorithms for Auto-Scaling and Scheduling This section starts with a mathematical description of the challenges a service provider faces to set its resource pool capacity. Based on this formalisation, we introduce the main contributions of this work: auto-scaling strate-gies and a scheduling algorithm based on user patience. Table 1 summarises the employed notation.
3.1. Mathematical Description
We consider a discrete-time state-space model where time-related values are integers in T ⊆ N representing seconds. There is a set U of end-users or clients and a sequence J of incoming requests to a service; the end-user who submitted request j ∈ J is denoted by u( j).
The service provider allocates up to m resources from the cloud provider in order to host its service and han-dle end-users’ requests, and its resource pool capacity at time t ∈ T is denoted by mt for each t ∈ T ; recall
that, with auto-scaling, mtmay be different from mt0for t , t0. We consider that m
t≥ b, where b ∈ N is defined
a priori by the service provider; setting such a lower bound is a common practice in the industry to prevent resource shortage under low, yet bursty load. Moreover, wt represents the number of resources in use to
han-dle requests at time t; note that wt < mt indicates that
mt− wt active resources are not being used by the
ser-vice provider.
A request occupies one resource for ρ seconds in or-der to be processed, ρ ∈ N, and that request decom-position (i.e., execution of sub-parts in different ma-chines or times) and preemption are forbidden. Due to the amount of time spent with queueing and schedul-ing operations, though, response times are almost al-ways higher than ρ. Based on previous interactions with the service provider, the response time that end-user u expects for each submitted request is given by ρ × βu,
where βu ∈ R is a multiplicative factor larger or equal
than 1; we assume that βu does not change over time.
The actual response time for request j is denoted by rj.
End-user u’s patience level at instant t is denoted by φt,u∈ R+. If φt,uis below a certain threshold τu∈ [0, 1),
we say that u is unhappy. Based on the ideas introduced by Prospect Theory — where the sense of losing an op-portunity transcends the feeling of gaining it — φt,u
behaves as follows. First, for every request j, u( j)’s re-action to response time rjis given by
xj=
ρ × βu( j)
rj
,
where xj > 1 indicates that rj was smaller than
accounts for cases where the rjwas greater, making u( j)
“disappointed”; and xj = 1 when equality between
ex-pected and actual response times hold. Considering the different user reactions suggested by Prospect Theory, we assume in this work that patience level φt,uchanges
according to xjas follows: φt,u=
α1,uφt−1,u+ (1 − α1,u)xj, if xj> 1;
α2,uφt−1,u+ (1 − α2,u)xj, otherwise,
where 0 ≤ α1,u, α2,u ≤ 1. Exponential smoothing is
used in both cases to update the patience level. In order to make the immediate impact of slower response times higher than that of faster responses, we have α1,u> α2,u;
moreover, different end-users may have different values of α1,u and α2,u. In summary, each end-user u is
de-scribed by a tuple (βu, α1,u, α2,u, τu, φ0,u).
3.2. Auto-Scaling and Scheduling Strategies
In order to set an auto-scaling strategy, a service provider needs to define when an scaling operation should take place and to select adequate step sizes, which are the number of resources by which the re-source pool capacity should extend or shrink.
Typically, resource utilisation is used to trigger scale-in and scale-out operations. Resource utilisation at time t, denoted by υt, is the ratio between the number wt
of resource hours effectively used to handle requests and the number mtof resource hours allocated from the
cloud (i.e., idle resources are not considered). The ser-vice provider sets parameters H and L, 0 ≤ L ≤ H ≤ 1, indicating utilisation thresholds according to which re-sources are activated and deactivated, respectively. Ob-serve that, irrespective of scale-in decisions, though, re-source pool capacity will never be inferior to b.
Ideally, resource pool capacity is modified before utilisation reaches undesired levels. For this reason, ser-vice providers typically rely on predictions of resource utilisation. In this work, this estimation is based on the measurements performed over the past i measurement intervals for some i ∈ N. Namely, after measuring υt
at time t, weighted exponential smoothing is used to predict the utilisation for step t+ 1. If the past v ≤ i measurements (i.e., υt−v, υt−v+1, . . . , υt) and the forecast
utilisation are below (above) the lower (upper) thresh-old L (H), the scheduler triggers a scale-in (scale-out) operation.
We propose the following auto-scaling strategies: • Utilisation Trigger (UT): a strategy that uses
sys-tem utilisation and employs a formula to iden-tify an upper bound on step sizes for activat-ing/releasing resource capacity;
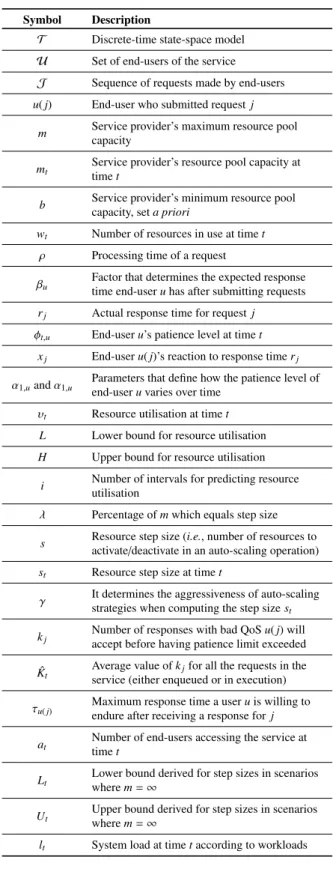
Table 1: Summary of the notation used in this article. Symbol Description
T Discrete-time state-space model U Set of end-users of the service J Sequence of requests made by end-users u( j) End-user who submitted request j
m Service provider’s maximum resource pool capacity
mt Service provider’s resource pool capacity at
time t
b Service provider’s minimum resource pool capacity, set a priori
wt Number of resources in use at time t
ρ Processing time of a request
βu Factor that determines the expected response
time end-user u has after submitting requests rj Actual response time for request j
φt,u End-user u’s patience level at time t xj End-user u( j)’s reaction to response time rj
α1,uand α1,u Parameters that define how the patience level of
end-user u varies over time υt Resource utilisation at time t
L Lower bound for resource utilisation H Upper bound for resource utilisation
i Number of intervals for predicting resource utilisation
λ Percentage of m which equals step size s Resource step size (i.e., number of resources to
activate/deactivate in an auto-scaling operation) st Resource step size at time t
γ It determines the aggressiveness of auto-scaling strategies when computing the step size st
kj Number of responses with bad QoS u( j) willaccept before having patience limit exceeded
ˆ Kt
Average value of kjfor all the requests in the
service (either enqueued or in execution) τu( j) Maximum response time a user u is willing to
endure after receiving a response for j at Number of end-users accessing the service attime t
Lt Lower bound derived for step sizes in scenarioswhere m= ∞
Ut Upper bound derived for step sizes in scenarioswhere m= ∞
• Unbounded-resource-pool Utilisation Trig-ger (UUT): uses system utilisation and employs a formula to determine an upper bound and a lower bound on step sizes for activating/releasing re-source pool capacity, based on previous work [11]; • Utilisation and Patience Trigger (UPT): extends the first strategy by using user patience to compute dynamically a factor for multiplying the step sizes suggested by the formula;
• Unbounded-resource-pool Utilisation and Pa-tience Trigger (UUPT): extends the second strat-egy by using user patience in order to choose dy-namically a value from the step size interval de-fined by the formula.
The rest of this section details the main principles of the auto-scaling strategies and the scheduling algorithm. 3.2.1. Utilisation-based Auto-Scaling
Let λ ∈ [0, 1] be the percentage of m by which the resource pool extends or shrinks in each auto-scaling operation, i.e., let s= bλ × mc. When setting utilisation thresholds L and H and step size s, service providers want to prevent the occurrence of opposite auto-scaling operations in consecutive steps. Such events take place in two situations, which can be avoided if we assume that wt= wt+1as we discuss below.
First, we have a scale-out operation taking place at time t and a scale-in operation taking place at time t+ 1 if wt
mt > H =⇒ wt > Hmt,
wt+1
mt+λ×m < L =⇒ wt+1 < L ×(mt+ λ × m), and wt ≤ wt+1 hold simultaneously.
This can be avoided if the following inequality holds: Hmt > L × (mt+ λ × m) =⇒ H L > mt+ λ × m mt =⇒ H L > 1 + λ × m mt .
A similar analysis indicates how to avoid scale-in oper-ations at time t and scale-out operoper-ations at t+ 1 for any t ∈ T whenever wt ≥ wt+1. Namely, we want to avoid
wt
mt < L =⇒ wt < Lmt and
wt
mt−λ×m > H =⇒ wt > H ×(mt−λ × m) holding simultaneously; for this, we
need H L > 1 + λ × m mt−λ × m . Moreover, we have that
λ × m mt−λ × m > λ × m mt =⇒ mt > mt−λ × m =⇒ λ × m > 0,
so both inequalities are satisfied if wt = wt+1 and HL ≥
1+mλ×m
t−λ×m. As the service provider will keep at least b machines active, we have that mt−λ×m ≥ b. Therefore,
the parameters have to obey the relation below: H
L > 1 + λ × m
b .
From the above, one derives an upper bound for the step size s= λ×m. This value is derived from borderline sce-narios, though, so it yields step sizes that are too large in most cases. Therefore, service providers can choose a multiplicative factor γ ∈ [0, 1] indicating the strat-egy’s “aggressiveness”; namely, given γ, the step size will be s × (1 − γ) and s × γ for scale-in and scale-out operations, respectively.
Utilisation Trigger (UT) is an implementation of the ideas discussed above; namely, in order to use UT, a ser-vice provider only needs to set utilisation thresholds L and H and factor γ. Observe that this strategy is based solely on utilisation and assumes that m is finite.
When a service provider is not subject to upper bounds on the number of resources it can allocate (i.e., m = ∞), the formulae employed to derived upper bounds on step sizes used by UT cannot be applied. Under these circumstances, we employ Unbounded-resource-pool Utilisation Trigger (UUT), a strategy in-troduced in our previous work [11] in which the upper bound on s for scale-out operations is given by
s ≤ mt
υt− L
L and the lower bound by
s ≥ mt
υt− U
U ,
whereas, for scale-in operations, the upper bound is s ≤ mt
L −υt
L and the lower bound is
s ≥ mt
U −υt
U .
Let Lt and Ut be the lower and upper bounds derived
from the inequalities above at time t, respectively. In addition to Ltand Ut, UUT is also given an
aggressive-ness factor γ ∈ [0, 1]. Given these parameters, for scale-in operations the value of stis
st= (1 − γ) × Lt+ γ × Ut,
whereas for scale-out operations it is st= γ × Lt+ (1 − γ) × Ut.
3.2.2. Patience-based Scheduling and Auto-Scaling Lowest Patience First (LPF) is a scheduling algorithm that orders arriving requests based on end-users’ pa-tience level as follows. If, at instant t, end-user u sub-mits request j and xj< 1, we have
φt+1,u= α1φt,u+ (1 − α1)xj≥α1φt,u.
Since lim
rj→∞
ρ × βu
rj = 0,
φt+1,u becomes closer to α1φt,uas rj → ∞. Therefore
α1φt,u is a lower bound for φt+1,u, and the accuracy of
this approximation grows as system load (and, conse-quently, response times) gets larger. Using this bound, we can estimate the minimum value kj ∈ N for which
φt+kj,ubecomes smaller than τuas follows: αkj 1φt,u ≥ τu =⇒ αkj 1 ≥ τu φt,u =⇒ kj ≥ logα1 τu φt,u ! ;
namely, value kj indicates the number of submissions
for which u( j) will tolerate a bad QoS before hav-ing τu( j)surpassed.
LPF sorts the requests in the scheduling queue ac-cording to kj (smaller values first). In order to avoid
starvation, kj is set to zero if request j is waiting for a
period of time that is at least twice as large as the current average response time.
Under UT and UUT γ is fixed, so the service provider is forced to have the same behaviour (aggressive or conservative) in each auto-scaling operation. UPT and UUPT leverage UT and UUT, respectively, by employ-ing user patience to set dynamically the value of γ.
Let ˆKt denote the average value of kjfor all the
re-quests in the service provider (either enqueued or in ex-ecution) at time-step t. Whenever the system decides that an auto-scaling operation should be performed, a sequence S containing the last k averages ˆKtis created
and has some percentage of its largest and smallest val-ues removed. From the remaining elements of S , the system takes the largest value K. Finally, the value of γ will be 1 − Kˆt
K and
ˆ
Kt
K for scale-out and scale-in
opera-tions, respectively.
Essentially, UPT and UUPT adapt the system be-haviour according to users’ current average-patience level. Namely, if ˆKt is high, a more aggressive policy
is acceptable. Conversely, if ˆKt is low, a conservative
approach could support the improvement of QoS.
4. Evaluation
We conducted extensive computational experiments in order to investigate the benefits and drawbacks of the algorithms presented in Section 3. We modelled scenar-ios where the maximum number of resources can be ei-ther bounded or unbounded, and evaluated the following combinations of task scheduling and auto-scaling trig-gering strategies:
• FIFO+UT or FIFO+UUT: First-In, First-Out
(FIFO) scheduling with auto-scaling considering only resource utilisation.
• LPF+UT or LPF+UUT: LPF scheduling with
auto-scaling considering only resource utilisation.
• LPF+UPT or LPF+UUPT: LPF scheduling with
auto-scaling considering resource utilisation, and end-users’ patience to define the resource step size of scale-out and scale-in operations.
Our comparisons employed the following metrics: • Percentage of dissatisfactions: percentage of
re-quests j whose response time rj led or kept
end-user u( j)’s patience level below threshold τu( j);
• Percentage of QoS violations: percentage of re-quests whose response times were longer than the amount of time expected by their end-users; • Allocated resource-time: resource capacity—
in machine-seconds—allocated to serve user re-quests.
• Aggregate request slowdown: consists of the ac-cumulated sum of all delays suffered by requests involved in QoS violations as is therefore given by
X
j∈J
max(rj−βu( j)×ρ, 0).
The rest of this section describes the experimental setup and discusses the obtained results.
4.1. Experimental Setup
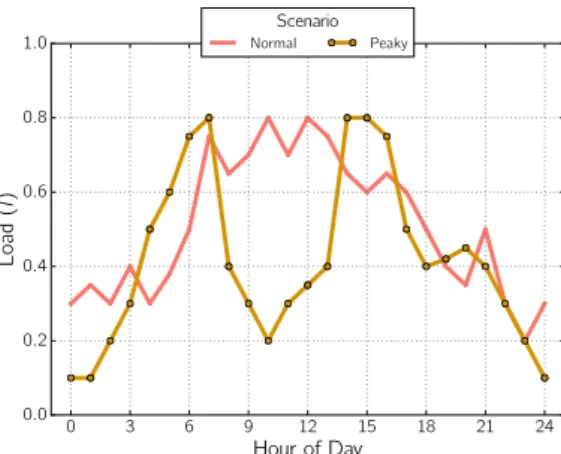
A built-in-house discrete-event simulator was used to evaluate the performance of the proposed strategies. We crafted two types of workloads with variable hourly-load over a 24-hour period. The rationale behind these workloads, depicted in Figure 3, is as follows:
0 3 6 9 12 15 18 21 24 Hour of Day 0.0 0.2 0.4 0.6 0.8 1.0 Load (l ) Scenario Normal Peaky
Figure 3: The workloads considered in this work, where the hourly load l is employed to determine the number of end-users accessing the service.
• Normal day: consists of small peaks of utilisa-tion during the start, middle, and towards the end of working hours. Outside these intervals, but still during working hours, the workload remains around the peak values, whereas outside the work-ing hours the load decreases significantly.
• Peaky day: consists of tipping workload peaks, a scenario in corporations where requests need to be executed only at a few moments of the day. The workloads are employed to determine the num-ber of users accessing a service at a given time t. Every 10 seconds, the number at of end-users accessing the
service is adjusted to
at= |U| × (lt+ η),
where |U| denotes the maximum number of users who can be accessing the service at any given moment, 0 ≥ lt≤ 1 is the load at time t according to the crafted
work-loads (representing hence a fraction of |U|), and η is uniformly distributed over −0.05 to 0.05 in order to add a random variation of 5%; the sum lt+ η is always set
to the closest value in the interval [0,1]. For instance, if at time t, |U| = 100, lt = 0.7 and η = 0.05, the
num-ber of users accessing the system and making requests is at = 75. For intermediate values of t, at = at−1.
Unless otherwise noted, the experiments described here use |U|= 1, 000.
Requests have processing time ρ of 10 seconds, whereas end-user’s expected response time for request j is ρ multiplied by βu( j) ≥ 1; e.g., if βu( j) = 1.3,
the expected response time is 13 seconds. Request inter-arrival times, or end-users “think time”—amount
of time in seconds separating the arrival of a response for request j and the submission of a new request by ac-tive end-user u( j)—is drawn uniformly from 0 to 100 for each request submission, that is, it is not constant for any end-user. The values of α1 and α2 are given
by 0.2 and 0.1 multiplied by numbers drawn uniformly for each end-user from [0.9, 1.1], respectively. Finally, each τu and φu,0are random numbers drawn uniformly
from [0.45, 0.55] and [0.8, 1.0], respectively. These val-ues are used by the algorithms employed by the service provider, so it can be assumed that they have been ob-tained or estimated based on historical data associated with each end-user.
We tested bounded scenarios in which maximum re-source pool capacity was an even value between 162 to 180; in these cases, the initial capacity m0 and the
minimum capacity b are set to 25% of the maximum. For unbounded scenarios, initial/minimum capacity is set to 45 resources. The rationale behind these values is simple. Whereas it is a common practice in the industry to set a minimum resource capacity for a service, we do not want this minimum capacity to be large enough to eclipse the impact of auto-scaling decisions.
The lower and upper target thresholds for resource utilisation (i.e., L and H) are 40% and 70% respec-tively, which are default utilisation levels used by exist-ing auto-scalexist-ing services, such as Amazon Elastic Com-pute Cloud (EC2). Resource utilisation levels are mea-sured every 60 seconds. The value of γ is set to 0.25 for strategies UT and UUT under bounded scenarios and to 0.5 under unbounded scenarios, respectively.
Provisioning time in each scale-out operation is mea-sured in seconds and is drawn from a Normal distribu-tion with mean 180 and standard deviadistribu-tion 15; sampling is performed in an aggregate way, that is, a single value is used by all resources involved in the same operation. These values were chosen based on existing work that identified that the mean time required to provision lean VM instances in certain clouds is often over 100 sec-onds [12]. Moreover, the fact that in a group of VMs there are certain VMs that can boot slower and that the provision of VMs with Web server software stack takes longer as demonstrated in the existing work, we added extra 80 seconds. We performed experiments with higher mean values (up to 10 minutes) and ob-tained similar conclusions for the proposed techniques (therefore, due to space constraints, we report only on results involving provisioning time variable to 180±15). Deallocation time was not considered in this work be-cause it is typically much shorter than provisioning time and its effects can only be observed in scenarios where utilisation changes abruptly and quickly, which is not
the case of the workloads considered in this work. Finally, we simulated the equivalent of 4 days of ac-tivities of a service provider in order to reduce biases that single executions could have brought to the final results.
4.2. Result Analysis
Bounded number of resources. We start discussing the results of our experiments with scenarios where the maximum resource pool capacity is bounded. These re-sults are summarised in Figures 4, 5, 6, 7, 8, and 9.
162 164 166 168 170 172 174 176 178 180 Number of Resources 0 1 2 3 4 5 6 7 8 % of QoS Violations
FIFO+UT LPF+UT LPF+UPT
Figure 4: Bounded: Percentage of QoS violations for FIFO+UT, LPF+UT, LPF+UPT on the Normal workload.
162 164 166 168 170 172 174 176 178 180 Number of Resources 0 2 4 6 8 10 12 14 16 % of QoS Violations
FIFO+UT LPF+UT LPF+UPT
Figure 5: Bounded: Percentage of QoS violations for FIFO+UT, LPF+UT, LPF+UPT on the Peaky workload.
Figures 4 and 5 present the percentage of requests whose response times were larger than expected. In general, LPF+UPT is superior and to FIFO+UT in sce-narios with 162-170 and worse than FIFO+UT with 172-180 resources, respectively, whereas LPF+UT is
162 164 166 168 170 172 174 176 178 180 Number of Resources 0 1 2 3 4 5 6 Allocated Resource Time (s )
×107 FIFO+UT LPF+UT LPF+UPT
Figure 6: Bounded: Comparison of resource-time usage for FIFO+UT, LPF+UT, LPF+UPT on the Normal workload.
162 164 166 168 170 172 174 176 178 180 Number of Resources 0 1 2 3 4 5 Allocated Resource Time (s )
×107 FIFO+UT LPF+UT LPF+UPT
Figure 7: Bounded: Comparison of resource-time usage for FIFO+UT, LPF+UT, LPF+UPT on the Peaky workload.
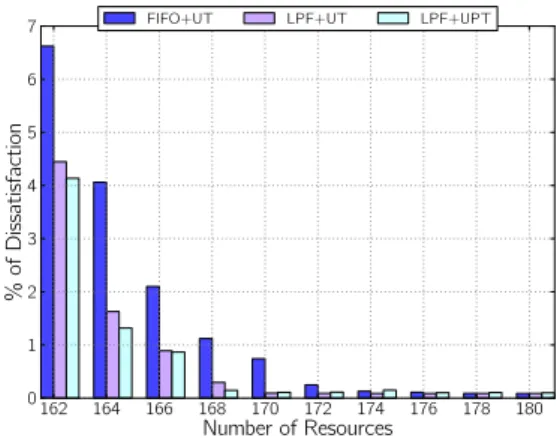
162 164 166 168 170 172 174 176 178 180 Number of Resources 0 1 2 3 4 5 6 7 % of Dissatisfaction
FIFO+UT LPF+UT LPF+UPT
Figure 8: Bounded: Percentage of user dissatisfaction for FIFO+UT, LPF+UT, LPF+UPT on the Normal workload.
better than both in all scenarios with respect to this met-ric. Poor results from FIFO+UT are not surprising, as
162 164 166 168 170 172 174 176 178 180 Number of Resources 0 2 4 6 8 10 12 14 16 % of Dissatisfaction
FIFO+UT LPF+UT LPF+UPT
Figure 9: Bounded: Percentage of user dissatisfaction for FIFO+UT, LPF+UT, LPF+UPT on the Peaky workload.
it is completely oblivious to user patience. The compar-ison between LPF+UT and LPF+UPT is less straight-forward; LPF+UT leads to fewer QoS violations than LPF+UPT, but Figures 6 and 7 show that the later com-pensates this with significant reductions on allocated re-source time (approximately 9%).
Additionally, results of LPF+UPT on percentage of QoS violations and on percentage of dissatisfactions for scenarios with 170-180 resources show the effects of making γ dynamic. Namely, in scenarios where the maximum number of resources is large enough to sat-isfy demand, users’ patience level are more likely to stay high. Whenever auto-scaling operations have to be per-formed, the algorithm assigns “aggressive” values to γ that enforce the allocation (deallocation) of a very small (large) number of machines in scale-out (scale-in) op-erations. As a result, response time for a certain num-ber of requests may be larger than expected in situations where such delays could have been avoided. However, the results presented in Figures 8 and 9 for 172-180 re-sources suggest that it is possible to provide insufficient QoS for approximately 1-2% of all requests without per-ceptible damages to user patience in such scenarios (as illustrated by LPF+UPT in Figures 4 and 5).
Figures 8 and 9 show a clear superiority (i.e., lower percentages) of LPF+UT and a clear inferiority of FIFO+UT with respect to end-user dissatisfaction. The latter phenomenon can be again explained by the fact that FIFO does not take patience into account. More-over, differences between LPF+UT and LPF+UPT are again counterbalanced by differences on the volume of resource-time usage for each configuration. The results of scenarios with 174-180 resources are inconclusive, as the percentage of dissatisfied users in these cases is
insignificant; because queues are almost never formed in these situations, the scheduling strategies basically deliver the same solutions and auto-scaling algorithms have enough time to adapt the resources’ pool.
Finally, the results show that keeping user patience in satisfactory levels is more challenging for the Peaky workload. The overall resources demand on both sce-narios are different, but whereas differences on the volume of allocated resources are relatively low (ap-proximately 10%), the percentages of QoS violations and dissatisfactions differ by a factor of 2. Peaky workloads model situations where resource demand in-creases abruptly, and under these circumstances, the number of QoS violations tend do increase consider-ably. Therefore, it is natural to expect lower user sat-isfaction levels in such scenarios.
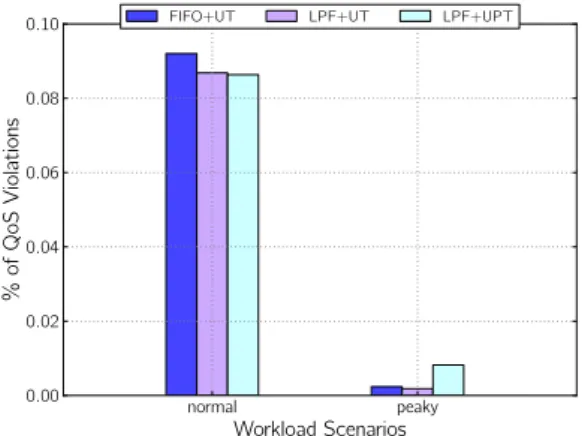
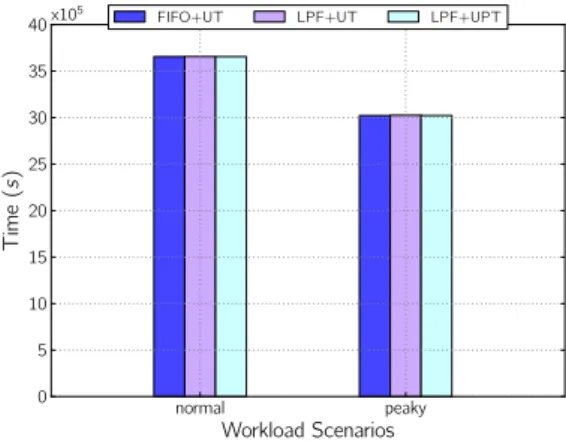
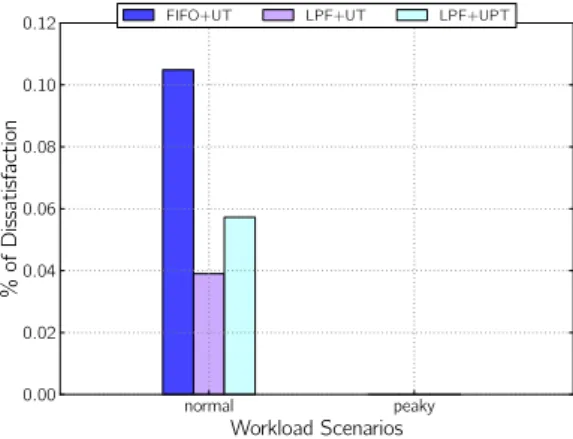
Unbounded number of resources. We present now re-sults involving the simulation of scenarios where ser-vice providers could provision as many resources as they wished. These results are summarised in Fig-ures 10, 11, 12. normal peaky Workload Scenarios 0.00 0.02 0.04 0.06 0.08 0.10 % of QoS Violations
FIFO+UT LPF+UT LPF+UPT
Figure 10: Unbounded: Percentage of QoS violations for FIFO+UT, LPF+UT, LPF+UPT.
As expected, the number of QoS violations is consid-erably smaller in these scenarios. Figure 10 shows that the occurrence of such events is extremely rare in both workloads (< 1%). One can also observe a potentially statistically negligible, but nevertheless interesting, phe-nomenon in this figure: all the strategies yielded more QoS violations in the Normal workload than in Peaky. Moreover, differences on the percentage of dissatisfac-tion presented in Figure 12 reinforces this apparent con-tradiction. The explanation for these results lay in an observation that was irrelevant in scenarios where QoS violations take place frequently: although its changes are more abrupt, Peaky is smoother, in the sense that
normal peaky Workload Scenarios 0 1 2 3 4 5 6 7 Allocated Resource Time (s )
×107 FIFO+UT LPF+UT LPF+UPT
Figure 11: Unbounded: Comparison of resource-time usage for FIFO+UT, LPF+UT, LPF+UPT.
normal peaky Workload Scenarios 0.00 0.01 0.02 0.03 0.04 0.05 0.06 0.07 0.08 0.09 % of Dissatisfaction
FIFO+UT LPF+UT LPF+UPT
Figure 12: Unbounded: Percentage of user dissatisfaction for FIFO+UT, LPF+UT, LPF+UPT.
normal peaky Workload Scenarios 0 5 10 15 20 25 30 35 40 Time (s )
FIFO+UT LPF+UT LPF+UPT
x105
Figure 13: Unbounded: Aggregate request slowdown for FIFO+UT, LPF+UT, LPF+UPT.
modifications on its upwards/downward orientation are less frequent than in Normal (6 against 15); QoS
vi-olations are more likely to occur during these shifts, which justifies the observed difference. Additionally, Figure 10 shows that FIFO+UT delivered less QoS vio-lations than the other two strategies for the Peaky work-load; this happened because patience-aware strategies focus on the minimization of user dissatisfaction rather than QoS violations, and sacrificing the latter may be necessary in order to excel on the first.
Conversely, results presented in Figure 12 suggest that the impact of QoS violations on end-user patience on Normal was considerably larger than on Peaky. Di-rect comparison with Figure 10 suggests that the num-ber of violations play a major role on this phenomenon, so we investigated the aggregate request slowdown.
The results are presented in Figure 13 and show that the values for Peaky and Normal are close; con-sequently, individual QoS violations typically involved much larger delays on Peaky than on Normal. From this, we conclude that having several small delays is more harmful to user dissatisfaction than a few long delays. Finally, Figure 11 reinforces the benefit of us-ing a patience-aware auto-scalus-ing triggerus-ing strategy. Whereas user dissatisfaction levels for all configurations are basically the same in both workloads, LPF+UPT consumed 9% less resources than the other strategies.
To evaluate the impact of provisioning time on the auto-scaling strategies described in this work, we per-formed an experiment with provisioning time of 10 ± 5 seconds and 10,000 as a maximum number of end-users — that is, |U|= 10, 000 when computing the number of users in the system at at time t. The minimum number
of resources, b, was set to 450. This scenario presents demand peaks that exceed 2,000 VMs. Figure 14 and Figure 15 summarise the results for allocated-resource time and percentage of dissatisfactions, respectively.
We can observe that the patterns identified in previ-ous experiments hold under this last scenario; there is a reduction in the amount of allocated resource time resulting into a small increase in the number of re-quests that suffer from insufficient QoS. Further inves-tigation revealed that this is the case because, although resources can be provisioned quickly, LPF delays auto-scaling operations by exploiting users patience levels, eventually leading to dissatisfactions as resource utili-sation and triggering of auto-scaling decisions are taken at discrete intervals. Although the patience-based auto-scaling strategy could be made more responsive to vari-ations in resource utilisation, that would lead to an in-crease in the cost with infrastructure as resources would be activated and released more often, and eventually render the consideration of users’ patience levels in auto-scaling unusable.
normal peaky Workload Scenarios 0.0 0.2 0.4 0.6 0.8 1.0 1.2 1.4 1.6 1.8 Allocated Resource Time (s )
×108 FIFO+UT LPF+UT LPF+UPT
Figure 14: Unbounded: Comparison of resource-time usage for FIFO+UT, LPF+UT, LPF+UPT under provisioning time of 10±5 sec-onds and |U|= 10, 000 users.
normal peaky Workload Scenarios 0.00 0.02 0.04 0.06 0.08 0.10 0.12 % of Dissatisfaction
FIFO+UT LPF+UT LPF+UPT
Figure 15: Unbounded: Percentage of user dissatisfaction for FIFO+UT, LPF+UT, LPF+UPT under provisioning time of 10±5 sec-onds and |U|= 10, 000 users.
5. Related Work
Projects related to our work fall into categories of scheduling, user behaviour, and cloud computing auto-scaling. Scheduling is a well-studied topic in several domains for which a large number of theoretical prob-lems, solutions, heuristics, and practical applications have been considered [13, 14]. Some of the used al-gorithms include FIFO, priority-based, deadline-driven, hybrid approaches that use backfilling techniques [15], among others [16, 17]. In addition to priorities and deadlines, other factors have been considered, such as fairness [18], energy-consumption [19], and context-awareness [9]. Moreover, utility functions were used to model how the importance of results to users varies over time [20, 21].
User behaviour has been explored for optimising
re-source management in the context of Web caching and page pre-fetching [22, 23, 24, 25, 26, 27]. The goal in previous work was to understand how users access Web pages, investigate how tolerant users are to delays, and pre-fetch or modify page content to enhance user expe-rience. Techniques in this area focus mostly on adapting Web content and minimising response time of user re-quests. Service research has also investigated the impact of delays in users’ behaviour. For instance, Taylor de-scribed the concept of delays and surveyed passengers affected by delayed flights in order to test various hy-potheses [28]. Brown et al. and Gans et al. investigated the impact of service delays in call centres [29, 30]. In behavioural economics, Kahneman and Tversky [10] in-troduced Prospect Theory to model how people make choices in situations that involve risk or uncertainty. Netto et al. introduced a scheduling strategy that con-siders information on how quickly users consume re-sults generated by service providers [7]. Our previous work investigated the scheduling of user requests con-sidering their patience and expectations, but with no auto-scaling of cloud resources [6].
Shen et al. introduced a system for automating elas-tic resource scaling for cloud computing [31]. Their system does not require prior knowledge on the appli-cations running in the cloud. Other projects consider auto-scaling in different scenarios and proposed several approaches, such as modifying the number of resources allocated for running MapReduce applications [32, 33], comparing vertical versus horizontal auto-scaling [34], minimising operational costs [35], and providing inte-ger model based auto-scaling [36] .
Unlike previous work, our proposed auto-scaling technique considers information on user patience while interacting with a service offered by a service provider using resources from a cloud infrastructure.
6. Conclusions and Future Work
In this article, we extended our investigation on patience-based algorithms for auto-scaling strategies. Traditional mechanisms are based solely on resource utilisation information and other system metrics, ignor-ing actual users’ needs with respect to their desired QoS levels. As a consequence, resources are over-provisioned under scenarios where they are not strictly needed; that is, where additional resources do not lead to significant improvement in QoS.
We conducted extensive experiments using FIFO and Lowest Patience First as scheduling algorithms, and auto-scaling triggers that rely either on utilisation or
user patience and utilisation. Our experiments consid-ered scenarios where the maximum number of resources could be either bounded or unbounded, and different versions of the auto-scaling algorithms were designed to cope with both possibilities. Our experiments consid-ered non-trivial (i.e., larger than 0) provisioning time.
Experimental results suggest that patience-based strategies can indeed provide significant economic gains to service providers. Namely, we observed that these strategies were able to reduce resource-time usage by approximately 9% while keeping QoS at the same level as those based solely on utilisation. We conclude that the identification of unnecessary buffers in QoS lev-els that will not necessarily improve user experience in cloud environments is a key element for service providers, as it may enable savings in infrastructure costs and bring competitive advantage for adopters.
We believe the proposed strategies fill an important gap in the literature. As sensors and Internet of Things become more pervasive, more data will be available that can be used to determine factors that influence users’ pa-tience. By using this data, one could certainly specialise and improve the techniques presented here. With re-spect to resource management, the strategies presented in this work handled horizontal resource elasticity and assumed that resources are pairwise indistinguishable. In future work, we aim to relax such assumptions, han-dling vertical elasticity and the allocation of multiple types of virtual machine instances.
Acknowledgements
Some experiments presented in this paper were car-ried out using the Grid’5000 experimental testbed, be-ing developed under the Inria ALADDIN development action with support from CNRS, RENATER and sev-eral Universities, as well as other funding bodies (see https://www.grid5000.fr). This work has also been sup-ported and partially funded by FINEP/ MCTI, under subcontract no. 03.14.0062.00.
References
[1] M. Armbrust, A. Fox, R. Griffith, A. D. Joseph, R. H. Katz, A. Konwinski, G. Lee, D. A. Pat-terson, A. Rabkin, I. Stoica, M. Zaharia, Above the clouds: A Berkeley view of Cloud comput-ing, Technical report UCB/EECS-2009-28, Elec-trical Engineering and Computer Sciences, Uni-versity of California at Berkeley, Berkeley, USA (February 2009).
[2] R. Barga, D. Gannon, D. Reed, The client and the cloud: Democratizing research computing, IEEE Internet Computing 15 (1) (2011) 72–75.
[3] J. Ramsay, A. Barbesi, J. Preece, A psycholog-ical investigation of long retrieval times on the world wide web, Interacting with computers 10 (1) (1998) 77–86.
[4] The communications market report: United king-dom (August 2013).
[5] F. Venturini, Five insights into consumers’ online video viewing and buying habits, Outlook, Point of View (July 2013).
[6] C. Cardonha, M. D. Assunc¸˜ao, M. A. S. Netto, R. L. F. Cunha, C. Queiroz, Patience-aware scheduling for cloud services: Freeing users from the chains of boredom, in: 11th International Conference on Service Oriented Computing (IC-SOC’13), 2013.
[7] M. A. S. Netto, et al., Leveraging attention scarcity to improve the overall user experience of cloud services, in: Int. Conf. on Network and Service Management (CNSM’13), 2013.
[8] R. L. F. Cunha, M. D. de Assuncao, C. Cardonha, M. A. S. Netto, Exploiting user patience for scal-ing resource capacity in cloud services, in: 7th IEEE International Conference on Cloud Comput-ing (IEEE Cloud 2014), IEEE, 2014, pp. 448–455. [9] M. D. de Assuncao, M. A. S. Netto, F. Koch, S. Bianchi, Context-aware job scheduling for cloud computing environments, in: IEEE/ACM Fifth International Conference on Utility and Cloud Computing (UCC 2012) Workshops, IEEE Computer Society, Washington, USA, 2012, pp. 255–262. doi:10.1109/UCC.2012.33.
URL http://dx.doi.org/10.1109/UCC.
2012.33
[10] D. Kahneman, A. Tversky, Prospect theory: An analysis of decision under risk, Econometrica: Journal of the Econometric Society (1979) 263– 291.
[11] M. A. S. Netto, C. Cardonha, R. L. F. Cunha, M. D. de Assuncao, Evaluating auto-scaling strategies for cloud computing environments, in: 22nd IEEE Int. Symp. on Modeling, Analysis and Simulation of Computer and Telecommunication Systems (MASCOTS 2014), IEEE, 2014.
[12] M. Mao, M. Humphrey, A performance study on the VM startup time in the cloud, in: IEEE 5th International Conference on Cloud Computing (CLOUD 2012), 2012, pp. 423–430.
[13] J. Blazewicz, K. Ecke, G. Schmidt, J. Weglarz, Scheduling in Computer and Manufacturing Sys-tems, 2nd Edition, 1994.
[14] M. L. Pinedo, Planning and Scheduling in Manu-facturing and Services, 2nd Edition, 2007. [15] D. Tsafrir, Y. Etsion, D. G. Feitelson,
Backfill-ing usBackfill-ing system-generated predictions rather than user runtime estimates, IEEE Transactions on Par-allel and Distributed Systems 18 (6) (2007) 789– 803.
[16] T. D. Braun, et al., A comparison of eleven static heuristics for mapping a class of independent tasks onto heterogeneous distributed computing systems, Journal of Parallel and Distributed com-puting.
[17] D. G. Feitelson, L. Rudolph, U. Schwiegelshohn, K. C. Sevcik, P. Wong, Theory and practice in parallel job scheduling, in: Workshop on Job Scheduling Strategies for Parallel Processing (JSSPP’97), 1997.
[18] N. D. Doulamis, A. D. Doulamis, E. A. Varvari-gos, T. A. Varvarigou, Fair scheduling algorithms in grids, IEEE Transactions on Parallel and Dis-tributed Systems 18 (11) (2007) 1630–1648. [19] J.-F. Pineau, Y. Robert, F. Vivien,
Energy-aware scheduling of bag-of-tasks applications on master–worker platforms, Concurrency and Com-putation: Practice and Experience 23 (2) (2011) 145–157.
[20] C. B. Lee, A. Snavely, Precise and realistic utility functions for user-centric performance analysis of schedulers, in: Int. Symp. on High-Performance Distributed Computing (HPDC’07), 2007. [21] A. AuYoung, et al., Service contracts and
ag-gregate utility functions, in: 15th IEEE Int. Symp. on High Performance Distributed Comput-ing (HPDC’06), 2006.
[22] D. F. Galletta, R. M. Henry, S. McCoy, P. Polak, Web site delays: How tolerant are users?, Journal of the Association for Information Systems 5 (1) (2004) 1–28.
[23] F. Alt, A. Sahami Shirazi, A. Schmidt, R. Atterer, Bridging waiting times on web pages, in: 14th Int. Conf. on Human-computer interaction with mo-bile devices and services (Momo-bileHCI’12), ACM, New York, NY, USA, 2012, pp. 305–308.
[24] R. Atterer, M. Wnuk, A. Schmidt, Knowing the user’s every move: user activity tracking for website usability evaluation and implicit interac-tion, in: 15th Int. Conf. on World Wide Web (WWW’06), ACM, New York, NY, USA, 2006, pp. 203–212.
[25] C. R. Cunha, C. F. B. Jaccoud, Determining www user’s next access and its application to
pre-fetching, in: 2nd IEEE Symp. on Computers and Communications (ISCC ’97), Washington, DC, USA, 1997, pp. 6–.
[26] N. Bhatti, A. Bouch, A. Kuchinsky, Integrat-ing user-perceived quality into web server design, Computer Networks 33 (1) (2000) 1–16.
[27] A. Bouch, A. Kuchinsky, N. Bhatti, Quality is in the eye of the beholder: meeting users’ require-ments for internet quality of service, in: SIGCHI conference on Human factors in computing sys-tems, ACM, 2000, pp. 297–304.
[28] S. Taylor, Waiting for service: the relationship be-tween delays and evaluations of service, The Jour-nal of Marketing (1994) 56–69.
[29] L. Brown, N. Gans, A. Mandelbaum, A. Sakov, H. Shen, S. Zeltyn, L. Zhao, Statistical analysis of a telephone call center: A queueing-science per-spective, Journal of the American Statistical Asso-ciation 100 (2005) 36–50.
[30] N. Gans, G. Koole, A. Mandelbaum, Tele-phone call centers: Tutorial, review, and research prospects, Manufacturing & Service Operations Management 5 (2) (2003) 79–141.
[31] Z. Shen, S. Subbiah, X. Gu, J. Wilkes, Cloudscale: elastic resource scaling for multi-tenant cloud sys-tems, in: 2nd ACM Symposium on Cloud Com-puting, ACM, 2011, p. 5.
[32] Y. Chen, S. Alspaugh, R. Katz, Interactive ana-lytical processing in big data systems: A cross-industry study of mapreduce workloads, Proc. VLDB Endow.
[33] Z. Fadika, M. Govindaraju, DELMA: Dynami-cally ELastic MapReduce Framework for CPU-Intensive Applications, in: 11th IEEE/ACM Inter-national Symposium on Cluster, Cloud and Grid Computing (CCGrid’11), 2011, pp. 454–463. [34] M. Sedaghat, F. Hernandez-Rodriguez, E.
Elm-roth, A virtual machine re-packing approach to the horizontal vs. vertical elasticity trade-off for cloud autoscaling, in: ACM Cloud and Autonomic Com-puting Conference (CAC’13), ACM, 2013. [35] M. Mao, M. Humphrey, Auto-scaling to minimize
cost and meet application deadlines in cloud work-flows, in: Int. Conf. for High Performance Com-puting, Networking, Storage and Analysis (SC), IEEE, 2011, pp. 1–12.
[36] M. Mao, J. Li, M. Humphrey, Cloud auto-scaling with deadline and budget constraints, in: 11th IEEE/ACM International Conference on Grid Computing (GRID), IEEE/ACM, 2010, pp. 41–48.

![Figure 2: Prospect theory modelling variations of user patience as a function of QoS [10]; where QoS can represent expectations on, for instance, request response time and jitter.](https://thumb-eu.123doks.com/thumbv2/123doknet/14653630.737999/4.892.149.379.159.416/prospect-modelling-variations-patience-function-represent-expectations-instance.webp)