Publisher’s version / Version de l'éditeur:
Vous avez des questions? Nous pouvons vous aider. Pour communiquer directement avec un auteur, consultez la première page de la revue dans laquelle son article a été publié afin de trouver ses coordonnées. Si vous n’arrivez pas à les repérer, communiquez avec nous à [email protected].
Questions? Contact the NRC Publications Archive team at
[email protected]. If you wish to email the authors directly, please see the first page of the publication for their contact information.
https://publications-cnrc.canada.ca/fra/droits
L’accès à ce site Web et l’utilisation de son contenu sont assujettis aux conditions présentées dans le site LISEZ CES CONDITIONS ATTENTIVEMENT AVANT D’UTILISER CE SITE WEB.
mAbs, 11, 4, pp. 757-766, 2019-04-16
READ THESE TERMS AND CONDITIONS CAREFULLY BEFORE USING THIS WEBSITE. https://nrc-publications.canada.ca/eng/copyright
NRC Publications Archive Record / Notice des Archives des publications du CNRC :
https://nrc-publications.canada.ca/eng/view/object/?id=724e35ab-5b1c-4719-93cf-1a6577f11545 https://publications-cnrc.canada.ca/fra/voir/objet/?id=724e35ab-5b1c-4719-93cf-1a6577f11545
NRC Publications Archive
Archives des publications du CNRC
This publication could be one of several versions: author’s original, accepted manuscript or the publisher’s version. / La version de cette publication peut être l’une des suivantes : la version prépublication de l’auteur, la version acceptée du manuscrit ou la version de l’éditeur.
For the publisher’s version, please access the DOI link below./ Pour consulter la version de l’éditeur, utilisez le lien DOI ci-dessous.
https://doi.org/10.1080/19420862.2019.1595307
Access and use of this website and the material on it are subject to the Terms and Conditions set forth at
Detection and quantification of free sulfhydryls in monoclonal
antibodies using maleimide labeling and mass spectrometry
REPORT
Detection and quantification of free sulfhydryls in monoclonal antibodies using
maleimide labeling and mass spectrometry
Anna C. Robotham and John F. Kelly
Human Health Therapeutics Research Centre, National Research Council of Canada, Ottawa, Ontario, Canada
ABSTRACT
The detection of free sulfhydryls in proteins can reveal incomplete disulfide bond formation, indicate cysteine residues available for conjugation, and offer insights into protein stability and structure. Traditional spectroscopic methods of free sulfhydryl detection, such as Ellman’s reagent, generally require a relatively large amount of sample, preventing their use for the analysis of biotherapeutics early in the development cycle. These spectroscopic methods also cannot accurately determine the location of the free sulfhydryl, further limiting their utility. Mass spectrometry was used to detect free sulfhydryl residues in intact proteins after labeling with Maleimide-PEG2-Biotin. As little as 2% cysteine residues with free sulfhydryls (0.02 mol SH per mol protein) could be detected by this method. Following reduction, the free sulfhydryl abundance on antibody heavy and light chains could be measured. To determine free sulfhydryl location at peptide-level resolution, free sulfhydryls and cysteines involved in disulfide bonds were differentially labeled with N-ethylmaleimide and d5-N-ethylmaleimide, respectively. Following enzymatic digestion and nanoLC-MS, the abundance of free sulfhydryls at individual cysteine residues was quantified down to 2%. The method was optimized to avoid non-specific labeling, disulfide bond scrambling, and maleimide exchange and hydrolysis. This new workflow for free sulfhydryl analysis was used to measure the abundance and location of free sulfhydryls in 3 commercially available monoclonal antibody standards (NIST Monoclonal Antibody Reference Material (NIST), SILu™Lite SigmaMAb Universal Antibody Standard (Sigma-Aldrich) and Intact mAb Mass Check Standard (Waters)) and 1 small protein standard (β-Lactoglobulin A).
ARTICLE HISTORY Received 3 December 2018 Revised 27 February 2019 Accepted 8 March 2019 KEYWORDS
Thiol; free sulfhydryl; NIST mAb; monoclonal antibody; mass spectrometry; cysteine; maleimide; disulfide
Introduction
Cysteine residues play a unique and essential role in protein structure, function, and stability. In extracellular and secreted proteins, disulfide bonds between cysteine residues provide important scaffolding that allows proteins to achieve and main-tain their three-dimensional structure. There have been numer-ous efforts to map the disulfide bonds in proteins in order to gain insight into protein architecture and to detect aberrant disulfide bonding in recombinant proteins.1,2Less focus has been directed towards free sulfhydryls in recombinant proteins (cysteine resi-dues that are not involved in a disulfide bond), although there is increasing evidence to indicate that free sulfhydryls are directly related to protein stability, aggregation and affinity.3–7
Immunoglobulins, also known as antibodies, are one of the most commonly produced recombinant proteins due to their important role as biotherapeutics.8The disulfide bonding patterns of immunoglobulins are well conserved,9 and non-canonical cysteines rarely arise naturally in immunoglobulins, even in the variable regions.5However, free sulfhydryls have been detected in immunoglobulins extracted from serum or produced recombinantly.3,6,9–17 Reduced disulfide bonds can result from multiple causes, including incomplete processing within host cells, especially under conditions of cellular stress,18or reduction by intra-cellular host proteins such as thioredoxin and
thioredoxin reductase during the harvest and purification of recombinant antibodies.19,20 Free sulfhydryls in a monoclonal antibody resulting from a reduced disulfide bond may have an effect on affinity,3increase the propensity of the antibody towards aggregation4,5,7 or decrease the antibody thermal stability.6 For these reasons, it is important to monitor and minimize the free sulfhydryl levels of monoclonal antibodies. There is no established acceptable level for free sulfhydryls in monoclonal antibodies and free sulfhydryl tolerance is likely antibody dependent. Additionally, in some cases, non-canonical cysteines are inten-tionally designed into an immunoglobulin in order to increase thermal stability through the formation of additional disulfide bonds21or to provide handles for drug conjugation.22In these cases, it is important to monitor the status of the sulfhydryls to determine if the added cysteines are forming disulfide bonds or remaining free for conjugation, as intended.
Several spectroscopy-based methods have been developed for measuring free sulfhydryls. The best known is the Ellman’s reagent method in which 5,5ʹ-dithio-bis-(2-nitrobenzoic acid) (DTNB) is reacted with free sulfhydryl groups to form quantifi-able, yellow-colored 2-nitro-5-thiobenzoic acid (TNB).23 The low sensitivity of Ellman’s reagent, however, makes it impractical for the detection of free sulfhydryls in recombinant antibodies, especially during early development when only small amounts of
CONTACTAnna C. Robotham [email protected] Human Health Therapeutics Research Centre, National Research Council of Canada, 100 Sussex Drive, Ottawa, Ontario K1A 0R6, Canada
Supplemental data for this article can be accessed on thepublisher’s website. MABS
2019, VOL. 11, NO. 4, 757–766
https://doi.org/10.1080/19420862.2019.1595307
© 2019 The Author(s). Published with license by Taylor & Francis Group, LLC.
This is an Open Access article distributed under the terms of the Creative Commons Attribution-NonCommercial-NoDerivatives License (http://creativecommons.org/licenses/by-nc-nd/4.0/), which permits non-commercial re-use, distribution, and reproduction in any medium, provided the original work is properly cited, and is not altered, transformed, or built upon in any way.
antibodies typically are available. Some improvements in the sensitivity of this method were gained through the use of enzy-matic amplification.24 The use of fluorescent labels, such as N-(1-pyrenyl)maleimide, has significantly improved the sensi-tivity of spectroscopic free sulfhydryl detection.25However, all spectroscopy-based methods have the inherent disadvantage that they only measure the overall free sulfhydryl content of a sample, and cannot provide data on the location or distribution of free sulfhydryls within proteins. Furthermore, they are sensi-tive to contaminants such as thiol-containing small molecules.
Mass spectrometry (MS) is well suited for the detection of free sulfhydryls and can provide useful data about free sulfhy-dryl abundance, location, and distribution. The reduction of a disulfide bond increases the mass of a protein by 2 Da, which, for small proteins, can be detected by high-resolution intact mass analysis. For example, MS has been used to identify NIST mAb Fab and Fc/2 fragments with free sulfhy-dryls after separation using a diphenyl column.26 However, small increases in protein mass are not reliable indicators of free sulfhydryls because other post-translational modifica-tions, such as deamidation and citrullination, increase the protein mass by a similar amount. Additionally, small mass shifts are more difficult to detect for larger proteins, such as intact antibodies. Therefore, a labeling strategy that clearly identifies the free sulfhydryl is usually the preferred choice. Most commonly, haloalkyl derivatives (such as iodoacetamide or iodoacetic acid)14,27 or maleimide derivatives (such as N-ethylmaleimide (NEM) or N-tert-butylmaleimide)13,28 have been used to label-free sulfhydryls. Maleimide labels have the advantage of being reactive at acidic pH, thus redu-cing the risk of disulfide bond scrambling during labeling, which can occur at higher pH.29MS following protein diges-tion and reverse-phase high-performance liquid chromatogra-phy (RP-HPLC) has been used to identify free sulfhydryl location at peptide-level resolution.17 Quantification of the abundance of free sulfhydryls at different sites has been demonstrated using differential labeling where free sulfhy-dryls were first labeled with12C-iodoacetic acid at pH 8, then the remaining cysteines were labeled with13C-iodoacetic acid after reduction.27 However, labeling with iodoacetic acid at pH 8 comes with a high risk of disulfide bond scrambling. To our knowledge, differential labeling and quantification of free sulfhydryls at different sites using a maleimide derivative and acidic pH have not been previously published.
This paper describes a strategy for quantitatively determining the overall free sulfhydryl level of proteins using intact protein LC-MS and the relative abundance of free sulfhydryl at indivi-dual cysteine residues using peptide-level nanoLC-MS analysis. The free sulfhydryls are labeled with NEM derivatives under acidic conditions in order to minimize the possibility of disulfide bond scrambling or non-specific labeling. Importantly, only a small amount of protein is required for the entire assay, i.e., as little as 40 µg intact protein for determining total free sulfhy-dryl abundance and an additional 40 µg protein for determining free sulfhydryl location and abundance at the peptide level resolution by nanoLC-MS. Therefore, this workflow is suitable for free sulfhydryl detection and quantification during biother-apeutic development where protein quantities are limited.
Results
Detection of free sulfhydryls in intact protein
To evaluate this workflow for free sulfhydryls detection, we used a set of four standard proteins: a model small protein with one known free sulfhydryl (β-lactoglobulin A) and three commer-cially available antibody standards (NIST Monoclonal Antibody Reference Material (NIST), SILu™Lite SigmaMAb Universal Antibody Standard (Sigma-Aldrich) and Intact mAb Mass Check Standard (Waters), which are hereafter referred to as “NIST mAb”, “SigmaMAb”, and “Waters mAb”, respectively). SigmaMAb has a non-canonical cysteine in the light chain located immediately adjacent to a canonical cysteine (Cys 90/ Cys 91) and was hypothesized to have two free sulfhydryls per protein. Each of these proteins was labeled with maleimide-PEG2-biotin at pH 5.5, according to the optimized labeling
protocol, and analyzed by LC-MS intact and following reduction with TCEP. To measure the intermediate precision of the assay, the assay was repeated in triplicate on three different days. Maleimide-PEG2-biotin labeling could be clearly detected on
each protein at levels that varied based on the protein. The maleimide-PEG2-biotin label adds a mass of 525 Da to each
free sulfhydryl. The known free sulfhydryl of β-lactoglobulin A was completely labeled with maleimide-PEG2-biotin (Figure
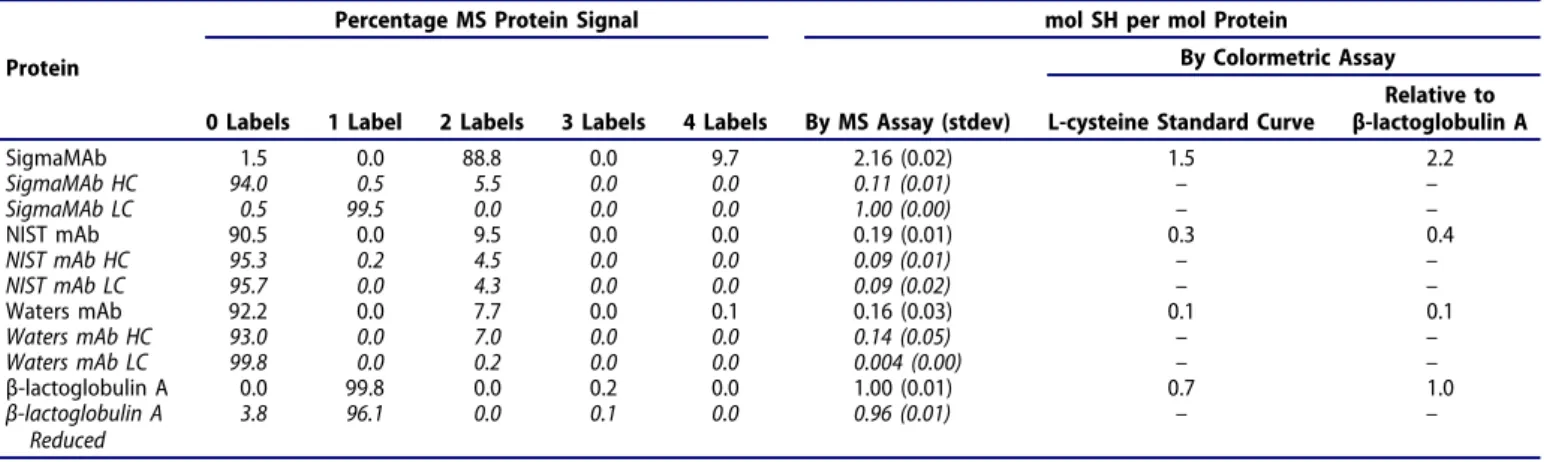
1a) as seen by a protein mass shift of 525 Da. For NIST mAb (Figure 1b) and Waters mAb (Figure 1c), a mass was observed at approximately 1050 Da greater than the mass of unlabeled immunoglobulin, consistent with the addition of two maleimide labels over one reduced disulfide bond in a minority of the molecules. SigmaMAb (Figure 1d) was fully labeled with two maleimide labels, with partial labeling with an additional two maleimide labels. The reduced protein results indicate that the maleimide label is added on both the light and heavy chains of NIST mAb (Figure 1, insert ii and iii), while for Waters mAb, the maleimide label is located mostly on the heavy chain (Figure 1, insert iv and v). The results for SigmaMAb indicate complete addition of one label to each light chain and partial addition of a label to the heavy chain (Figure 1, insert vi and vii). To quantify these results, the “mol SH per mol protein (or chain)” was calculated for the intact protein and each reduced chain (Table 1). When the “mol SH per mol protein” for the intact protein was compared to the sum of the “mol SH per mol chain” for each reduced chain, the agreement was very good for SigmaMAb, while for NIST mAb and Waters mAb, the sum of labeling on each reduced chain was slightly greater than the labeling calculated for the intact protein. The low level of labeling detected for these antibodies may have increased the error in the measurement.
Interestingly, despite the common assertion that cysteine-maleimide labeling is stable and that cysteine-maleimide does not react with TCEP,30slightly less maleimide label was observed on β-lactoglobulin A following reduction than before reduction (Figure 1, insert i). A series of experiments were conducted where labeled β-lactoglobulin A was treated with TCEP at various temperatures, concentrations or incubation lengths. Under all conditions, if the disulfide bonds were effectively reduced, ~5% maleimide label loss was observed (Supplementary Table S1).
A standard curve was prepared to estimate the limit of detection for maleimide-PEG2-biotin label on an intact
anti-body and the accuracy of quantifying the total amount of free sulfhydryls from intact protein data (Supplementary Figure S1). Unlabeled SigmaMAb (0% with two maleimide labels) and labeled SigmaMAb (98% with two or four maleimide labels) were mixed in set ratios and analyzed by intact protein MS.
Labeled SigmaMAb could be easily detected in mixes contain-ing as little as 2% (the lowest percentage of labeled antibody tested), indicating that the limit of detection is ≤2% (Supplementary Figure S1B). A free sulfhydryl level of 2% is equivalent to 0.02 mol SH per mol protein. The linearity of the signal was very good across the entire range with a R2value of 0.9984 and a slope of 0.96. These results indicate that
Table 1.Number of maleimide-PEG2-biotin labels observed on each protein or reduced protein chain by mass spectrometry and comparison of overall “mol SH per
mol protein” calculated by mass spectrometry or by papain-amplified colorimetric assay. Mass spectrometry results are averages of triplicate analyses and “mol SH per mol protein” is calculated by the equation ∑n*(Fraction of protein with n labels). The colorimetric assay results are from the average absorbance at 410 nm of single samples of papain-SSCH3 and BAPNA-treated protein analyzed twice. The “mol SH per mol protein” is reported either directly calculated from the L-cysteine standard curve or after correction relative to the “mol SH per mol protein” observed for β-lactoglobulin A (mol SH per mol protein for β-lactoglobulin A = 1).
Percentage MS Protein Signal mol SH per mol Protein
Protein By Colormetric Assay
0 Labels 1 Label 2 Labels 3 Labels 4 Labels By MS Assay (stdev) L-cysteine Standard Curve
Relative to β-lactoglobulin A SigmaMAb 1.5 0.0 88.8 0.0 9.7 2.16 (0.02) 1.5 2.2 SigmaMAb HC 94.0 0.5 5.5 0.0 0.0 0.11 (0.01) – – SigmaMAb LC 0.5 99.5 0.0 0.0 0.0 1.00 (0.00) – – NIST mAb 90.5 0.0 9.5 0.0 0.0 0.19 (0.01) 0.3 0.4 NIST mAb HC 95.3 0.2 4.5 0.0 0.0 0.09 (0.01) – – NIST mAb LC 95.7 0.0 4.3 0.0 0.0 0.09 (0.02) – – Waters mAb 92.2 0.0 7.7 0.0 0.1 0.16 (0.03) 0.1 0.1 Waters mAb HC 93.0 0.0 7.0 0.0 0.0 0.14 (0.05) – – Waters mAb LC 99.8 0.0 0.2 0.0 0.0 0.004 (0.00) – – β-lactoglobulin A 0.0 99.8 0.0 0.2 0.0 1.00 (0.01) 0.7 1.0 β-lactoglobulin A Reduced 3.8 96.1 0.0 0.1 0.0 0.96 (0.01) – –
Figure 1.Deconvoluted mass spectra for intact β-lactoglobulin A (a), NIST mAb (b), Waters mAb (c) and SigmaMAb (d) before (blue trace) and after (black trace) labeling of free sulfhydryls with maleimide-PEG2-biotin. Each maleimide-PEG2-biotin label addition increases the mass by 525 Da. Inserts show the deconvoluted
mass spectra after reduction for the entire reduced protein (Insert i), the light chain (Insert ii, iv and vi) and the heavy chain (Insert iii, v and vii).
maleimide-PEG2-biotin labeling likely does not affect the
ioni-zation efficiency of a large protein by electrospray ioniioni-zation MS, and that labeled and unlabeled forms can be directly compared.
Detection of free sulfhydryls at peptide-level resolution
We developed a protocol for the differential labeling of free sulfhydryls and cysteines involved in disulfide bonds that can be used to determine the location and relative abundance of free sulfhydryls in proteins. The labeling reagents, d0-NEM
and d5-NEM, increase the mass of a labeled cysteine by 125
Da or 130 Da, respectively. After protein enzymatic digestion, the labeled peptides can be detected using nanoLC-MS. For most analyses, it is beneficial to label the generally low abun-dant free sulfhydryl cysteines with d0-NEM and the high
abundant disulfide-bonded cysteines with d5-NEM in order
to avoid overlap between the two isotopic profiles. In this way, low levels of d0-NEM free sulfhydryl labeling can be detected
easily (Figure 2), and d0-NEM and d5-NEM-labeled peptide
forms can be quantified on the basis of MS signal intensity. To determine the accuracy of this method for the quantifica-tion of free sulfhydryl abundance on individual peptides, reduced SigmaMAb labeled with d0-NEM only and reduced SigmaMAb
labeled with d5-NEM only were mixed in a defined series of
ratios, digested with trypsin and then analyzed by nanoLC-MS /MS. After filtering the data to remove low abundant peptides and peptides with interfering co-eluting peaks (as described in Methods), 19 cysteine-containing peptides, covering 16 of the SigmaMAb’s 17 unique cysteine residues, were confidently detected. The cysteine not detected (Cys 204 or “C4”) was located
on a very large tryptic peptide that was not observed during LC-MS/MS (Supplementary Figure S2A). The proportion of d0
-NEM labeling observed on each peptide in every mix was plotted (Supplementary Figure S2B). All peptides consistently reflected the expected protein labeling ratio, including the lowest ratio tested of 2% d0-NEM-labeled protein. The linear regressions had
slopes varying from 0.96 to 1.03. This result confirms that d0
-NEM and d5-NEM-labeled peptides have the same ionizability
and can be directly compared by this method. At least 2% d0
-NEM labeling can be reliably detected for a diverse range of peptides, assuming sufficient signal intensity.
During the preliminary work for the mix tests described above, we noted that some NEM exchange and hydrolysis occurred after tryptic digestion. In initial experiments, after mixing d0-NEM and d5-NEM labeled SigmaMAb, the pH was
raised from 5.0 to 8.0 for the overnight trypsin digestion. For peptides with a single cysteine residue, the ratio of d0-NEM to
d5-NEM labeled peptide observed was as expected. However,
peptides containing two cysteines were detected with two d0
-NEM labels, two d5-NEM labels or one d0-NEM and one d5
-NEM label. This latter combination should not have been possible from the experiment design and can only be explained by maleimide exchange occurring after mixing of the labeled stocks. The experiment was repeated with trypsin digestion occurring at either pH 8, 7, or 6. The mass spectrum for a peptide containing two cysteines is shown in Figure 3. Peptide labeled with both a d0-NEM and a d5-NEM label (due
to maleimide exchange), as well as evidence for maleimide hydrolysis (mass increase of 18 Da), was only observed in the pH 8 digest. Therefore, the digestion was carried out at pH 7 for the mix tests and the optimized protocol to minimize maleimide exchange.
The relative abundance of free sulfhydryls at individual cysteine residues was measured in triplicate digests of the four test proteins (Figure 4, Supplementary Table S2). Some free sulfhydryl was observed at nearly all cysteines covered by the protein digests, although the levels were very low (<2%) for most cysteines in the three immuno-globulins. For peptides containing multiple cysteines, such as the hinge cysteines, the free sulfhydryl abundance could only be determined for the peptide as a whole, and not for the individual cysteine residues. Cysteines that are cano-nically disulfide bonded to each other tended to have similar free sulfhydryl abundances. The hinge cysteines and the cysteines linking the light and heavy chains had particularly low free sulfhydryl levels, as might be expected given the structural importance of these disulfide bonds. Interestingly, the primary free sulfhydryl site on the SigmaMAb antibody was determined to be light chain Cys 22 (~67%), while Cys 90/Cys 91 (the site of the additional non-canonical cysteine) was significantly less free (~20%). Evidence for a disulfide bond between Cys 90 and Cys 91 was observed previously during disulfide bond mapping of SigmaMAb (Supplementary Figure S3). The free sulfhydryl of β-lactoglobulin A was determined to be located on the peptide including Cys 106, Cys 119, and Cys 121 in ~88% of the proteins, but, due to the limitation of tryptic digestion, the extent of labeling at each of these cysteines residues could not be determined.
Figure 2.Example of a mass spectrum observed for a peptide with a relatively high free sulfhydryl abundance (percentage d0-NEM labeling = ~12%) (a) and for a peptide
with a low free sulfhydryl abundance (percentage d0-NEM labeling = ~1.5%) (b). In
both cases, the d0-NEM labeled peptide can be clearly distinguished from the d5-NEM
labeled peptide (mass difference = 5 Da). The peptides shown are SigmaMAb peptides SGNTASLTISGLQAEDEADYYCCSYAGDYTPGVVFGGGTK (a) and STSGGTAALGCLVK (b). Panel B is zoomed eightfold as the intensity for the d0-NEM
Comparison with spectroscopic methods for free sulfhydryl measurement
Comparison of this assay to published spectroscopic assays proved to be challenging due to numerous problems encoun-tered with the spectroscopic assays. Use of Ellman’s reagent (5,5ʹ-dithiobis-(2-nitrobenzoic acid)) is the classic colori-metric assay for the measurement of thiols in small molecules or bulk serum-derived immunoglobulin.23 However, this assay has poor sensitivity, and the large amount of protein required made it impractical for analysis of the three test immunoglobulins. Instead, we explored alternative spectro-scopic assays for free sulfhydryl analysis.
First, we tested the Thiol Detection Assay Kit (Cayman Chemical). This kit labels free sulfhydryls with a proprietary label for fluorescent detection. Using the recommended N-acetyl-L-cysteine standard curve, this kit significantly underestimated the free sulfhydryls in our test proteins (for example, “mol free SH per mol protein” calculated for β-lactoglobulin A was ~0.2, not 1.0 as predicted). Better results for the test mAbs were obtained using a standard curve of β-lactoglobulin A (assuming 1 mol SH per mol β-β-lactoglobulin A), but the slope of the standard curve was very shallow and consistent results could not be attained (data not shown).
Next, we investigated the N-(1-pyrenyl)maleimide (NPM) fluorescence method used by other groups for free sulfhydryl analysis of antibodies.6,10NPM labels free sulfhydryls through maleimide chemistry and only fluoresces when reacted with a -SH group.31 Learning from the difficulties encountered with the Thiol Detection Assay Kit, several molecules with a single free sulfhydryl were investigated as suitable standards:
Figure 3.SigmaMAb with all cysteines labeled with d0-NEM was mixed 1:1
with SigmaMAb with all cysteines labeled with d5-NEM, prior to the pH
being raised for overnight tryptic digestion. The mass spectrum for peptide THTCPPCPAPELLGGPSVFLFPPKPK is shown after tryptic digestion at pH 8 (a), pH 7 (b) or pH 6 (c). Peptide labeled with 2 d0-NEM or 2 d5-NEM was
observed under all digestion conditions. Peptide labeled with 1 d0-NEM and
1 d5-NEM (*), indicative of maleimide exchange, was only observed when
the digestion was carried out at pH 8. A mass increase of 18 Da (●), indicative of maleimide hydrolysis, was also observed when the digestion was carried out at pH 8.
Figure 4.Color-coded map of the observed free sulfhydryl abundance for each cysteine of SigmaMAb (a), NIST mAb (b), Waters mAb (c) and β-lactoglobulin A (d). Cysteines are colored based on the average percentage of peptides observed labeled with d0-NEM, from triplicate analysis (detailed data provided in Supplemental
Table S2). Adjacent cysteines that could not be discriminated because they were only observed on the same tryptic peptide are outlined with a box and color-coded with the overall free sulfhydryl abundance of the peptide containing the multiple cysteines. Canonical immunoglobulin disulfide bonds are indicated with lines connecting cysteines. Cysteines involved in the interchain hinge are indicated with a bracket.
N-acetyl-L-cysteine, β-lactoglobulin A and bovine serum albumin (BSA). The standard curves for all three standards were linear but varied greatly in slope (Supplementary Figure S4). The BSA standard curve provided the estimate of free sulfhydryl abundance that best agreed with the MS results for SigmaMAb and for Waters mAb, but over-estimated the free sulfhydryl abundance for β-lactoglobulin A by ~75% and for NIST mAb by ~100%. We hypothesized that the dramatic differences between the standard curves were due to protein local environment influencing fluorescence. In an attempt to disrupt the protein local environment and collapse the stan-dard curves into one universal stanstan-dard curve, the NPM-treated standard curve proteins were NPM-treated with pepsin. However, while pepsin treatment did change the slope of the standard curves, it failed to equalize the standard curves.
Finally, the colorimetric Thiol and Sulfide Quantification kit (Molecular Probes) was investigated as an alternative to the fluorescence-based assays. This enzyme-amplified method measures the abundance of free sulfhydryls by exploiting them to activate papain-SSCH3, through an intermediate cystamine, which in turn cleaves Nα-benzoyl-L-arginine
4-nitroanilide hydrochloride (L-BAPNA) into colored p-nitroaniline. This method is claimed to be 100x more sen-sitive than the Ellman’s reagent method.32 Nevertheless, the signal-to-noise ratio at the microplate scale was too small to produce reliable data. Despite this assay being based on enzyme activation, increasing incubation time did not increase signal (Supplementary Figure 5A). Production of p-nitroaniline halted after ~20-min incubation of free sulfhy-dryls with papain-SSCH3 at room temperature, regardless of starting free sulfhydryl concentration. Better signal-to-noise ratio was attained by repeating the assay at a larger volume (400 µL versus 206 µL). An L-cysteine standard curve gener-ated using the modified papain-SSCH3 assay consistently underestimated the free sulfhydryl ratio of our test proteins by approximately 30% (Supplementary Figure 5B, Table 1). However, when “mol SH per mol protein” was normalized using a “mol SH per mol protein = 1” for β-lactoglobulin A, then the spectroscopic results for the other proteins were a better match to the results obtained by MS (Table 1).
Discussion
The method we described here exploits the resolution and sensitivity of MS in order to detect and quantify free sulfhy-dryls at the intact protein, the reduced protein chain, and the peptide level. It provides comprehensive information about protein free sulfhydryls whilst using a fraction of the amounts of protein required for most other reported methods. The entire derivatization and analysis protocol at the intact and reduced protein level (including controls) requires only 40 µg of each sample. Peptide-level LC-MS/MS analysis only requires an additional 40 µg of material. In comparison, the Ellman’s reagent method often requires low milligrams quan-tities of monoclonal antibody. Additionally, we found that the NPM fluorescence method required ~170 μg of each mAb and the papain-amplified colorimetric assay required up to ~235 μg of mAb in order for the expected free sulfhydryl abun-dance to fall within the standard curve. No standard curves
are necessary to determine the abundance of free sulfhydryls using this mass-spectrometry-based method as all measure-ments are relative within the LC-MS spectra. Additionally, all the reagents used in this protocol are commercially available and typical LC-MS conditions were used for the intact mass and peptide LC-MS/MS analysis.
Spectroscopic assays can detect the presence of free sulfhy-dryls in proteins and, with the use of appropriate standards, can estimate the average mol SH per mol protein. However, as this study has shown, attaining reliable results for a variety of proteins with spectroscopic assays can be challenging. In comparison, our LC-MS protocol can calculate average mol SH per mol protein easily for proteins varying greatly in terms of structure or free sulfhydryls abundance while also provid-ing information about sulfhydryl distribution. This was ably demonstrated using our test proteins, all of which are com-mercially available and can be used as benchmarking stan-dards across different labs. Furthermore, differential isotopic labeling combined with nanoLC-MS/MS analysis reveals further details about free sulfhydryl location and free sulfhy-dryl abundance at individual cysteine residues. This level of detail allowed us to identify Cys 22 as the primary free sulfhydryl site on the light chain of SigmaMAb, not, as may have been hypothesized, the non-canonical cysteine located further along the chain. Choice of protease is a factor in the resolution of identifying labeled free sulfhydryls. For β-lactoglobulin A, using trypsin as the protease, the free sulfhy-dryl was correctly determined to be located at either Cys 106, Cys 119, or Cys 121, but the known free sulfhydryl at Cys 12133could not be pinpointed due to a lack of cleavage sites between these three cysteines and ambiguous MS/MS data. Nevertheless, a comprehensive assessment of the abundance and distribution of free sulfhydryls in a protein to the level attained by this workflow would be very difficult, if not impossible, to complete using most previously reported methods.
The protocol uses low pH conditions to minimize the possibility of disulfide bond scrambling, a phenomenon that is known to occur at neutral to basic pH.29The use of biotin-PEG2-maleimide label (+525 Da) for the intact protein
analy-sis, a larger label than what was typically used previously, ensures that the mass of the labeled protein is shifted above the range of most common protein modifications such as oxidation (+16 Da), phosphorylation/sulfation (+80 Da), C-terminal lysine (+128 Da) and glycation (+162 Da). This facilitates the detection of even trace levels of free sulfhydryl. Reducing protein heterogeneity by removing N-linked gly-cans, though not essential, also aids in the detection of the low level of the label. While this label was primarily selected for its mass, the biotin portion of the label opens up new opportunities for the isolation of free sulfhydryl-containing proteins. In contrast with spectroscopic methods, this LC-MS-based assay is much less sensitive to the presence of contam-inating proteins or free sulfhydryl-containing small molecules. In addition, LC-MS is also capable of detecting, based on their characteristic mass shifts, free sulfhydryls that were modified prior to analysis by cysteinylation or glutathionylation.
The results of this study support previous findings that antibodies typically have a low, but non-zero, level of open
disulfide bonds. We found the level of free sulfhydryls for NIST mAb and Waters Intact Mass mAb standard to be approximately 0.2 mol free sulfhydryls per mol antibody. Very similar results were reported previously for IgG extracted from serum analyzed using the Ellman’s reagent method15-17 or using radiolabeling,12 as well as for Chinese hamster ovary cell-produced recombinant mAb analyzed using the NPM labeling method.10Previously, the free sulfhy-dryl levels for NIST mAb Fc/2 and Fab fragments were mea-sured using UV detection of partially reduced isoforms separated on a diphenyl column separation;26 the overall free sulfhydryl level of NIST mAb calculated from these values is 0.2 mol SH per mol antibody. Higher levels of free sulfhy-dryl content, similar to what was observed for SigmaMAb, have been reported previously for particular antibodies such as omalizumab.3,11,16 The location of the reduced disulfide bond is variable, and similar to previous studies,12,17,27 we observed that most immunoglobulin cysteines have a small probability (~2%) of having a free sulfhydryl. The cysteines least likely to have a free sulfhydryl are those involved in interchain disulfide bonds. More widespread use of commer-cially available standards such as NIST mAb and SigmaMAb when reporting free sulfhydryl abundances would enable bet-ter comparison of different methods for free sulfhydryl ana-lysis. The creation of a library of benchmarked free sulfhydryl measurements for biotherapeutic proteins would increase understanding of the typical prevalence of free sulfhydryls in immunoglobulins and designs and processing processes that affect free sulfhydryl abundance.
In the course of development of this method, several com-monly held assumptions regarding maleimide-cysteine chem-istry were found to not be universally true. Maleimides are generally held to specifically and permanently label cysteine residues at pH 6.5–7.5 and not react with TCEP.30However, in early experiments, a very high level of maleimide-protein labeling was sometimes observed, even at acidic pH (pH 6.4) or for proteins not containing any cysteine residues (data not shown). The investigation led to the identification of lysine-maleimide labeling, which has been reported previously.34 Lysine labeling was effectively prevented by carefully control-ling the ratio of maleimide to protein during the labecontrol-ling stage, maintaining an acidic pH and incubating at room temperature. Maleimide labeling proved to be effective and fast (<15 minutes to complete labeling) at pH 5.5. At mildly basic conditions (pH 8 and 37°C), maleimide exchange and maleimide hydrolysis were observed. Maleimide exchange (also called the retro-Michael reaction) and maleimide hydro-lysis have been noted previously under physiological pH and excess thiols,35,36 but the reported t1/2for N-ethylmaleimide
exchange and hydrolysis at pH 7.4 were very long (400 and 220 h, respectively).36However, the findings from this experi-ment indicate that maleimide exchange and hydrolysis is very sensitive to even mildly basic buffer conditions commonly used during protein digestion, and a neutral or acidic pH must be maintained to avoid these processes. Care must also be taken when using TCEP as a reducing agent, which, despite claims in some literature to the contrary, does react with maleimides37and must be accounted for when titrating mal-eimide reagent for complete labeling of cysteine in the
presence of TCEP. Evidence was also observed in this study for some loss of maleimide label attached to protein during reduction with TCEP. While minor, this phenomenon merits further exploration.
The aim of this study was to develop sensitive and reliable MS assays to support the under-developed field of free sulf-hydryl detection and measurement. Free sulfsulf-hydryls have been correlated with affinity, stability, and aggregation issues in biotherapeutic proteins.3–7 This workflow enables the detection of protein biologic candidates with potentially pro-blematic free sulfhydryls early in the development cycle when amounts of available protein are insufficient for traditional assays. It complements existing disulfide-bond mapping assays to build a more complete picture of the role of cysteines in proteins. As interest in cysteine-based antibody-drug con-jugates increases and new biotherapeutics designs are intro-duced, this LC-MS workflow can be used to answer key questions about the status of individual cysteine residues.
Material and methods Test proteins
Four protein standards were used in the development of this assay: SILu™Lite SigmaMAb Universal Antibody Standard human (Sigma-Aldrich, Cat# MSQC4), NISTmAb Humanized IgG1κ Monoclonal Antibody (National Institute of Standards and Technology, Reference Material 8671, Lot 14HB-D-001), Intact mAb Mass Check Standard (Waters, Cat# 186006552), β-Lactoglobulin A from bovine milk (Sigma, Cat# L7880).
Labeling of intact protein free sulfhydryls with maleimide-PEG2-biotin
Proteins were deglycosylated (if necessary) with PNGaseF (Sigma-Aldrich, Cat# F8435), then buffer exchanged into 6 M guanidine hydrochloride, 100 mM sodium acetate pH 5.5 using Amicon® Ultra-0.5 10 KDa cut-off centrifugal filters (Sigma-Aldrich, Cat# UFC5010), to a final protein concentra-tion of 0.5 mg/mL. A 15 mg/mL EZ-Link maleimide-PEG2
-biotin stock (Thermo Scientific, Cat# 21901BID) was prepared in dimethyl sulfoxide (DMSO) and diluted to 3 mg/mL with 100 mM sodium acetate pH 5.5 immediately prior to use. Proteins were labeled with a 150x molar excess of maleimide-PEG2-biotin to protein at room temperature for 1 h. To
remove excess maleimide, proteins were buffer exchanged again into 6 M guanidine hydrochloride, 100 mM sodium acetate pH 5.5, using the same centrifugal filters. A portion of each labeled protein was reduced into constituent chains with 5 mM TCEP (Thermo Scientific, Cat# 77720) at 37°C for 15 min. To check intermediate precision of the assay, the test proteins were labeled in triplicate over three different days.
LC-MS analysis of intact and reduced proteins
Labeled protein, with and without reduction, as well as unla-beled controls, were analyzed on an Agilent 1100 series high performance liquid chromatography instrument (Agilent,
California) equipped with a POROS™ R2 10 µm, 2.1 × 30 mm column (Thermo Scientific, Cat# 1111212) coupled to a LTQ-Orbitrap XL mass spectrometer equipped with an electrospray ionization source (Thermo Scientific, Massachusetts). The mobile phase A was 0.1% formic acid in ddH2O, and the
mobile phase B was acetonitrile. The flow rate was 3 mL/ min, and the column temperature was maintained at approxi-mately 80°C. Approxiapproxi-mately 5 µg of protein was injected. Intact antibodies were eluted with a linear gradient of 20% to 90% mobile phase B over 3 min, while reduced antibodies and small proteins (β-lactoglobulin A) were eluted with a linear gradient of 10% to 75% mobile phase B over 3 min. LC effluent was split to 100 µL/min to the LTQ-Orbitrap XL. MS analysis of intact proteins was done in positive electro-spray ionization mode and using appropriate tune files for analysis of large or small intact proteins. Data was deconvo-luted using the MaxEnt1 algorithm available through MassLynx software (Waters, Massachusetts).
Differential labeling with N-ethylmaleimide and protein digestion
Proteins were deglycosylated (if necessary) with PNGaseF; then, buffer exchanged into 6 M guanidine hydrochloride, 100 mM sodium acetate pH 5.5 using Amicon® Ultra-0.5 10 KDa cut-off centrifugal filters, to a final protein concentration of 0.5 mg/mL. A 25 mg/mL non-deuterated N-ethylmaleimide stock (Sigma-Aldrich, Cat# E3876) was prepared in DMSO and diluted to 3 mg/mL with 100 mM sodium acetate pH 5.5 immediately prior to use. Proteins were labeled with a 150x molar excess of N-ethylmaleimide to protein at room tem-perature for 30 min. To remove excess N-ethylmaleimide, proteins were buffer exchanged into 6 M guanidine hydro-chloride, 100 mM sodium acetate pH 5.5 using the same centrifugal filters. Protein was treated with 5 mM TCEP (Thermo Scientific, Cat# 77720) at 37°C for 15 min to reduce all disulfide bonds. A 25 mg/mL d5-N-Ethylmaleimide stock
(CDN Isotopes, Cat# D6141) was prepared in DMSO. Reduced cysteines were labeled with a 150x molar excess of d5-N-ethylmaleimide at room temperature for 30 min. To
remove excess d5-N-ethylmaleimide, proteins were buffer
exchanged into 6 M guanidine hydrochloride, 100 mM sodium acetate pH 5.5 to a final protein concentration of 1.0 mg/mL. Protein solution was diluted sixfold with 100 mM Tris-HCl pH 7.0 to reduce the Guanidine-HCl con-centration to ~1 M and to raise the pH to ~7.0. Protein was digested overnight at 37°C with 1:10 sequencing grade mod-ified trypsin (Promega, Cat# V511C). To check intermediate precision, the test proteins were labeled and digested in tri-plicate over three different days. Control digests were pre-pared concurrently that underwent all steps described above except for labeling of free sulfhydryls with non-deuterated N-ethylmaleimide.
nanoLC-MS analysis of NEM-labeled peptides
Peptide digests were analyzed on a LTQ-Orbitrap XL mass spectrometer equipped with an electrospray ionization source (Thermo Scientific, Massachusetts) connected to
a nanoACQUITY UPLC (Waters, Massachusetts). Approximately 2 pmol of digested protein was injected (or sufficient to acquire a strong MS signal). Reverse phase chro-matography was performed on a nanoACQUITY BEH 1.7 µm 100 µm × 100 mm C18 column (Waters, Cat# 186003546) with a C18 PepMap100 5 µm trap (Thermo Scientific, Cat# 160454). Mobile phase A was 0.1% formic acid in ddH2O, and
mobile phase B was 0.1% formic acid in acetonitrile. Peptides were eluted over a linear gradient of 0.2% to 40% mobile phase B over 45 min, 40% to 95% mobile phase B over 4 min, with a flow rate of 0.5 µL/min. MS spectra were acquired from 400 to 2000 m/z in positive electrospray ionization mode at 60 K resolution. Top three most intense ions from each scan were selected for enhanced CID MS/MS in the ion trap with dynamic exclusion (20 s) using the following set-tings: isolation width = 3.0, activation Q = 0.250, activation time = 30 ms, and normalized collision energy = 35.0.
Data analysis of peptide results
CID data was converted to mzXML using Msconvert from the ProteoWizard package with the following parameters: – mzXML −32 – filter ‘peakPicking true [2,3]’. MGF files (*.mgf) were generated from the mzXML file using MzXML2Search from the Trans Proteomics Pipeline project and searched with Mascot (Matrix Science, Massachusetts) against a database con-taining the test protein sequences with the following parameters: enzyme = trypsin; modifications = oxidation (M, variable), NEM:2H(5) (C, variable); peptide tolerance = 1.5 Da; fragment tolerance = 1.2 Da. Peptides were subsequently filtered to remove peptides with a Mascot score <35 and a delta mass >10 ppm following correction for systemic mass error based on the median ppm value of high scoring peptides (score >60). Using this information, a list of identified d5-NEM labeled peptides and
the calculated d0-NEM labeled peptides (same retention time as
d5-NEM labeled peptides, but mass 5.0433 Da less) was prepared
and these peptides were quantified based on the peak area of the MS signal intensity in both control and test samples using MatchRx (in-house software).38 To maximize signal, the M and M + 1 isotopic peaks were quantified for 1+ and 2+ ions, the M + 1 and M + 2 isotopic peaks were quantified for 3+ ions, and the M + 2 and M + 3 isotopic peaks were quantified for 4+ or greater ions. The percentage of d0-NEM and d5-NEM
labeling observed for each peptide was calculated.
To limit false positives due to co-eluting peaks, the inten-sity results for a peptide were omitted if, in the d5-NEM-only
control, there was a signal at the d0-NEM labeled peptide m/z
that was >2% the signal at the equivalent d5-NEM labeled
peptide m/z. Peptides with a weak MS signal, where the intensity of d0-NEM labeled peptide + d5-NEM labeled
pep-tide was less than a selected value (~20 x the limit of detec-tion), were also omitted. The average percentage of d0-NEM
labeling for each site was calculated.
Cayman Thiol detection assay kit
The Thiol Detection Assay Kit was used according to the kit instructions (Cayman Chemical, Cat# 700340). Standard curves spanning 0 nM to 1000 nM were prepared using
N-acetyl-L-cysteine (Sigma-Aldrich, Cat# A7250) and β-Lactoglobulin A from bovine milk (Sigma, Cat# L7880). Guanidine-HCl was added to the 1x Thiol Assay Buffer to a final buffer composition of 4 M guanidine-HCl, 100 mM potassium phosphate, 1 mM ethylenediaminetetraacetic acid (EDTA), pH 7.4. The concen-tration of the protein samples was adjusted to 400 nM (~12 μg in 200 μL) with degassed 1x Thiol Assay Buffer + 4 M guanidine-HCl so that the expected free sulfhydryl concentration would be between 15 and 1000 nM. After addition of the proprietary thiol detector, fluorescence was read with an Infinite M200 Pro vari-able wavelength fluorescence detector (TECAN, Männerdorf, Switzerland) using an excitation wavelength of 385 nm and an emission wavelength of 515 nm.
NPM-labeling fluorescence assay
The NPM-labeling fluorescence assay was carried out following the method described previously.10Standard curves spanning 0 nM to 20 µM were prepared for N-acetyl-L-cysteine (Sigma-Aldrich, Cat# A7250), β-Lactoglobulin A from bovine milk (Sigma, Cat# L7880) and BSA (Sigma-Aldrich, Cat# A3059) in degassed 6 M Guanidine-HCl, phosphate-buffered saline (PBS) pH 7.4. The concentration of the protein samples was adjusted to 8 μM (~170 μg mAb in 150 μL) with degassed 6 M Guanidine-HCl, PBS pH 7.4 so that the expected free sulfhydryl concentration would be between 0.6 and 20 μM. A 0.5 mM NPM (Sigma-Aldrich, Cat# P7908) solution was prepared in DMSO. Ten microliters of 0.5 mM NPM was incubated with 50 µL standard or sample in a black half-area 96-well plate (Corning) at room temperature for 2 h. The incubation was halted by the addition of 10 µL 100 mM HCl. For one replicate of each standard curve, 8 µL of 10 mg/mL pepsin in ddH2O (Sigma-Aldrich, Cat# P7012) was added to
each well and incubated at room temperature for 30 min. Fluorescence was read with an Infinite M200 Pro variable wavelength fluorescence detector (TECAN, Männerdorf, Switzerland) using an excitation wavelength of 330 nm and an emission wavelength of 376 nm.
Free sulfhydryl colorimetric assay
The Thiol and Sulfide Quantification Kit (Molecular Probes, Cat# T-6060) was used according to the kit instructions with some modifications. Briefly, a L-cysteine standard curve span-ning 0 µM to 2.0 µM final concentration was prepared in degassed 5 mM sodium acetate, 50 mM NaCl, 0.5 mM EDTA, pH 4.7. Sufficient amounts of lyophilized protein (28.75 μg SigmaMAb, 232.54 μg Waters mAb, 232.54 μg NIST mAb, 7.35 μg β-Lactoglobulin) were dissolved in 20 μL degassed 6 M guanidine-HCl, 100 mM sodium acetate pH 5.5 so that the expected free sulfhydryl concentration in the final dilution would be between 0.5 and 2 μM. To 20 µL of each standard or sample, added 20 µL of 4 mM cystamine, 90 µL of 1.2 mg/mL papain-SSCH3, and 90 µL of 40 mM sodium phosphate, 2 mM EDTA, pH 7.6, then incubated at room temperature for 1 h. Added 180 µL of 4.9 mM L-BAPNA in 50 mM bis-Tris, 1mM EDTA, pH 6.3 to each standard or sample then incubated at room temperature. The absorbance of each sample and stan-dard was measured at 410 nm using a GENESYS™20 visible
spectrophotometer (Thermo Scientific, Massachusetts) 50 and 102 min after the addition of L-BAPNA.
Acknowledgments
The authors would like to thank Dr. Jennifer Hill for assistance with MatchRx software, which allowed for the reliable quantification of NEM-labeled peptides, as well as for her support, encouragement, and guidance throughout this project. We would also like to thank Luc Tessier and Sam Williamson for their continuous efforts maintaining and preparing the mass spectrometry set-ups.
Abbreviations
BSA bovine serum albumin
Cys cysteine
Da daltons
ddH2O double-distilled or MilliQ-filtered deionized water
DMSO dimethyl sulfoxide
DTNB 5,5ʹ-dithio-bis-(2-nitrobenzoic acid) EDTA ethylenediaminetetraacetic acid ESI electrospray ionization
LC liquid chromatography
L-BAPNA N
α-Benzoyl-L-arginine 4-nitroanilide hydrochloride
mAb monoclonal antibody
MS mass spectrometry
NEM N-ethylmaleimide
NIST National Institute of Standards and Technology
NPM N-(1-pyrenyl)maleimide
PEG polyethylene glycol
PNGaseF Peptide:N-glycosidase F
RP-HPLC reverse-phase high-performance liquid chromatography
SH free sulfhydryl
t1/2 half-life
TCEP Tris(2-carboxyethyl)phosphine TNB 2-nitro-5-thiobenzoic acid
ORCID
Anna C. Robotham http://orcid.org/0000-0002-6464-736X John F. Kelly http://orcid.org/0000-0003-1998-3572
References
1. Lakbub JC, Shipman JT, Desaire H. Recent mass
spectrometry-based techniques and considerations for disulfide bond characterization in proteins. Anal Bioanal Chem.2018;410 (10):2467–84. doi:10.1007/s00216-017-0772-1.
2. Tsai PL, Chen S-F, Huang SY. Mass spectrometry-based strategies for protein disulfide bond identification. Rev Anal Chem.2013;32 (4):257–68. doi:10.1515/revac-2013-0011.
3. Harris RJ. Heterogeneity of recombinant antibodies: linking struc-ture to function. In: Mire-Sluis AR, editor. State of the art analy-tical methods for the characterization of biological products and assessment of comparability. Basel (Switzerland): Karger;2005. p. 117–27.
4. Trivedi MV, Laurence JS, Siahaan TJ. The role of thiols and disulfides on protein stability. Curr Protein Pept Sci. 2009;10 (6):614–25. doi:10.2174/138920309789630534.
5. Buchanan A, Clementel V, Woods R, Harn N, Bowen MA, Mo W, Popovic B, Bishop SM, Dall’Acqua W, Minter R, et al. Engineering a therapeutic igg molecule to address cysteinylation, aggregation and enhance thermal stability and expression. MAbs. 2013;5(2):255–62. doi:10.4161/mabs.23392.
6. Lacy ER, Baker M, Brigham-Burke M. Free sulfhydryl measure-ment as an indicator of antibody stability. Anal Biochem. 2008;382(1):66–68. doi:10.1016/j.ab.2008.07.016.
7. Chung WK, Russell B, Yang Y, Handlogten M, Hudak S, Cao M, Wang J, Robbins D, Ahuja S, Zhu M. Effects of antibody disulfide bond reduction on purification process performance and final drug substance stability. Biotechnol Bioeng. 2017;114(6):1264–74. doi:10.1002/bit.26265.
8. AlDeghaither D, Smaglo BG, Weiner LM. Beyond peptides and mabs– current status and future perspectives for biotherapeutics with novel constructs. J Clin Pharmacol. 2015;55(Suppl 3):S4–20. doi:10.1002/ jcph.407.
9. Liu H, May K. Disulfide bond structures of igg molecules: structural variations, chemical modifications and possible impacts to stability and biological function. MAbs. 2012;4(1):17–23. doi:10.4161/ mabs.4.1.18347.
10. Zhang W, Czupryn MJ. Free sulfhydryl in recombinant monoclonal antibodies. Biotechnol Prog. 2002;18(3):509–13. doi:10.1021/ bp025511z.
11. Zhang T, Zhang J, Hewitt D, Tran B, Gao X, Qiu ZJ, Tejada M, Gazzano-Santoro H, Kao YH. Identification and characterization of buried unpaired cysteines in a recombinant monoclonal igg1 antibody. Anal Chem.2012;84(16):7112–23. doi:10.1021/ac301426h. 12. Buchwald BM, Connell GE. Thiol groups of normal human
immunoglobulin g. Biochem J.1974;137:281–89.
13. Ouellette D, Alessandri L, Chin A, Grinnell C, Tarcsa E, Radziejewski C, Correia I. Studies in serum support rapid forma-tion of disulfide bond between unpaired cysteine residues in the vh domain of an immunoglobulin g1 molecule. Anal Biochem. 2010;397(1):37–47. doi:10.1016/j.ab.2009.09.027.
14. Chumsae C, Gaza-Bulseco G, Liu H. Identification and localiza-tion of unpaired cysteine residues in monoclonal antibodies by fluorescence labeling and mass spectrometry. Anal Chem.2009;81 (15):6449–57. doi:10.1021/ac900815z.
15. Schauenstein E, Sorger S, Reiter M, Dachs F. Free thiol groups and labile disulfide bonds in the igg fraction of human serum. J Immunol Methods.1982;50:51–56.
16. Luks CI, Connell GE. Aggregation of an immunoglobulin frag-ment by sulfhydryl oxidation. Can J Biochem.1968;46:961–64. 17. Huh JH, White AJ, Brych SR, Franey H, Matsumura M. The
identifica-tion of free cysteine residues within antibodies and a potential role for free cysteine residues in covalent aggregation because of agitation stress. J Pharm Sci.2013;102(6):1701–11. doi:10.1002/jps.23505. 18. Moritz B, Stracke JO. Assessment of disulfide and hinge
modifica-tions in monoclonal antibodies. Electrophoresis. 2017;38 (6):769–85. doi:10.1002/elps.201600425.
19. Trexler-Schmidt M, Sargis S, Chiu J, Sze-Khoo S, Mun M, Kao YH, Laird MW. Identification and prevention of antibody disulfide bond reduction during cell culture manufacturing. Biotechnol Bioeng.2010;106(3):452–61. doi:10.1002/bit.22699. 20. Kao YH, Hewitt DP, Trexler-Schmidt M, Laird MW. Mechanism
of antibody reduction in cell culture production processes. Biotechnol Bioeng.2010;107(4):622–32. doi:10.1002/bit.22848. 21. Zabetakis D, Olson MA, Anderson GP, Legler PM, Goldman ER.
Evaluation of disulfide bond position to enhance the thermal stability of a highly stable single domain antibody. PLoS One. 2014;9(12):e115405. doi:10.1371/journal.pone.0115405.
22. Junutula JR, Raab H, Clark S, Bhakta S, Leipold DD, Weir S, Chen Y, Simpson M, Tsai SP, Dennis MS, et al. Site-specific conjugation of a cytotoxic drug to an antibody improves the therapeutic index. Nat Biotechnol.2008;26(8):925–32. doi:10.1038/nbt.1480.
23. Ellman GL. Tissue sulfhydryl groups. Arch Biochem Biophys. 1959;82:70–77.
24. Singh R, Blattler WA, Collinson AR. Assay for thiols based on reactivation of papain. In: Packer L, editor. Biothiols part a monothiols and dithiols, protein thiols, and thiyl radicals. San Diego (USA): Academic Press;1995. p. 229–37.
25. Wu CW, Yarbrough LR. N-(1-pyrene)maleimide: A fluorescent cross-linking reagent. Biochemistry.1976;15:2863–68.
26. Faid V, Leblanc Y, Bihoreau N, Chevreux G. Middle-up analysis of monoclonal antibodies after combined igde and ides hinge proteolysis: investigation of free sulfhydryls. J Pharm Biomed Anal.2018;149:541–46. doi:10.1016/j.jpba.2017.11.046.
27. Xiang T, Chumsae C, Liu H. Localization and quantitation of free sulfhydryl in recombinant monoclonal antibodies by differ-ential labeling with 12c and 13c iodoacetic acid and lc-ms analysis. Anal Chem. 2009;81(19):8101–08. doi:10.1021/ ac901311y.
28. Cheng Y, Chen MT, Patterson LC, Yu XC, Zhang YT, Burgess BL, Chen Y. Domain-specific free thiol variant characterization of an igg1 by reversed-phase high-performance liquid chromatography mass spectrometry. Anal Biochem.2017;519:8–14. doi:10.1016/j. ab.2016.12.003.
29. Sung WC, Chang CW, Huang SY, Wei TY, Huang YL, Lin YH, Chen HM, Chen SF. Evaluation of disulfide scrambling during the enzymatic digestion of bevacizumab at various ph values using mass spectrometry. Biochim Biophys Acta.2016;1864(9):1188–94. doi:10.1016/j.bbapap.2016.05.011.
30. Thermo Scientific. Thermo scientific crosslinking technical hand-book. Waltham (USA): Thermo Scientific; 2012. Thermo Scientific Brochure 1602163.
31. Winters RA, Zukowski J, Ercal N, Matthews RH, Spitz DR. Analysis of glutathione, glutathione disulfide, cysteine, homocys-teine, and other biological thiols by high-performance liquid chromatography following derivatization by n-(1-pyrenyl)malei-mide. Anal Biochem. 1995;227(1):14–21. doi:10.1006/ abio.1995.1246.
32. Singh R, Blattler WA, Collinson AR. An amplified assay for thiols based on reactivation of papain. Anal Biochem. 1993;213 (1):49–56. doi:10.1006/abio.1993.1384.
33. Hambling SG, McAlpine AS, Sawyer L. β-lactoglobulin. In: Fox PF, editor. Advanced dairy chemistry. London (New York): Elsevier Applied Science;1992. p. 141–90.
34. Brewer C, Riehm J. Evidence for possible nonspecific reactions between n-ethylmaleimide and proteins. Anal Biochem. 1967;18:248–55. doi:10.1016/0003-2697(67)90007-3.
35. Baldwin AD, Kiick KL. Tunable degradation of maleimide-thiol adducts in reducing environments. Bioconjug Chem. 2011;22 (10):1946–53. doi:10.1021/bc200148v.
36. Fontaine SD, Reid R, Robinson L, Ashley GW, Santi DV. Long-term stabilization of maleimide-thiol conjugates. Bioconjug Chem.2015;26(1):145–52. doi:10.1021/bc5005262.
37. Shafer DE, Inman JK, Lees A. Reaction of tris(2-carboxyethyl) phosphine (tcep) with maleimide and alpha-haloacyl groups: anomalous elution of tcep by gel filtration. Anal Biochem. 2000;282(1):161–64. doi:10.1006/abio.2000.4609.
38. Haqqani AS, Kelly JF, Stanimirovic DB. Quantitative protein profil-ing by mass spectrometry usprofil-ing label-free proteomics. Methods Mol Biol.2008;439:241–56. doi:10.1007/978-1-59745-188-8_17.