HAL Id: hal-01348309
https://hal.archives-ouvertes.fr/hal-01348309
Submitted on 10 Dec 2019
HAL is a multi-disciplinary open access
archive for the deposit and dissemination of
sci-entific research documents, whether they are
pub-lished or not. The documents may come from
teaching and research institutions in France or
abroad, or from public or private research centers.
L’archive ouverte pluridisciplinaire HAL, est
destinée au dépôt et à la diffusion de documents
scientifiques de niveau recherche, publiés ou non,
émanant des établissements d’enseignement et de
recherche français ou étrangers, des laboratoires
publics ou privés.
Distributed under a Creative Commons CC0 - Public Domain Dedication| 4.0 International
License
comparison and participants’ attitudes
Timo Smieszek, Stefanie Castell, Alain Barrat, Ciro Cattuto, Peter J. White,
Gérard Krause
To cite this version:
Timo Smieszek, Stefanie Castell, Alain Barrat, Ciro Cattuto, Peter J. White, et al.. Contact
di-aries versus wearable proximity sensors in measuring contact patterns at a conference: method
com-parison and participants’ attitudes. BMC Infectious Diseases, BioMed Central, 2016, 16, pp.341.
�10.1186/s12879-016-1676-y�. �hal-01348309�
R E S E A R C H A R T I C L E
Open Access
Contact diaries versus wearable proximity
sensors in measuring contact patterns at
a conference: method comparison and
participants
’ attitudes
Timo Smieszek
1,2†, Stefanie Castell
3*†, Alain Barrat
4,5, Ciro Cattuto
5, Peter J. White
1,2and Gérard Krause
3,6Abstract
Background: Studies measuring contact networks have helped to improve our understanding of infectious disease transmission. However, several methodological issues are still unresolved, such as which method of contact measurement is the most valid. Further, complete network analysis requires data from most, ideally all, members of a network and, to achieve this, acceptance of the measurement method. We aimed at investigating measurement error by comparing two methods of contact measurement– paper diaries vs. wearable proximity sensors – that were applied concurrently to the same population, and we measured acceptability.
Methods: We investigated the contact network of one day of an epidemiology conference in September 2014. Seventy-six participants wore proximity sensors throughout the day while concurrently recording their contacts with other study participants in a paper-diary; they also reported on method acceptability.
Results: There were 329 contact reports in the paper diaries, corresponding to 199 contacts, of which 130 were noted by both parties. The sensors recorded 316 contacts, which would have resulted in 632 contact reports if there had been perfect concordance in recording. We estimated the probabilities that a contact was reported in a diary as:P = 72 % for <5 min contact duration (significantly lower than the following, p < 0.05), P = 86 % for 5-15 min, P = 89 % for 15-60 min, and P = 94 % for >60 min. The sets of sensor-measured and self-reported contacts had a large intersection, but neither was a subset of the other. Participants’ aggregated contact duration was mostly substantially longer in the diary data than in the sensor data. Twenty percent of respondents (>1 reported contact) stated that filling in the diary was too much work, 25 % of respondents reported difficulties in remembering contacts, and 93 % were comfortable having their conference contacts measured by sensors.
Conclusion: Reporting and recording were not complete; reporting was particularly incomplete for contacts <5 min. The types of contact that both methods are capable of detecting are partly different. Participants appear to have overestimated the duration of their contacts. Conducting a study with diaries or wearable sensors was acceptable to and mostly easily done by participants. Both methods can be applied meaningfully if their specific limitations are considered and incompleteness is accounted for.
Keywords: RFID, Proximity sensor, Contact network, Contact diary, Measurement error, Acceptability, Infectious disease, Network epidemiology, Network model, Infection transmission
* Correspondence:stefanie.castell@helmholtz-hzi.de
†Equal contributors
3Department for Epidemiology, Helmholtz-Centre for Infection Research,
Braunschweig, Germany
Full list of author information is available at the end of the article
© 2016 The Author(s). Open Access This article is distributed under the terms of the Creative Commons Attribution 4.0 International License (http://creativecommons.org/licenses/by/4.0/), which permits unrestricted use, distribution, and reproduction in any medium, provided you give appropriate credit to the original author(s) and the source, provide a link to the Creative Commons license, and indicate if changes were made. The Creative Commons Public Domain Dedication waiver (http://creativecommons.org/publicdomain/zero/1.0/) applies to the data made available in this article, unless otherwise stated.
Background
Contact patterns are important drivers of infectious dis-ease dynamics [1], and failure to incorporate relevant properties of network structures may result in faulty predictions of disease spread [2, 3] and, hence, inefficient allocation of scarce public health resources. Various methods have been developed to measure social mixing [4], in particular contact diaries [5–8], wearable sensors [9–16], and video analyses [17].
These methods are heavily used to parameterize models that inform public health policy [7, 18] and support contact tracing [19]. However our understanding lacks evidence regardingwhat kind of contact definitions are good proxies for situations when transmission happens, how well the existing methods capture these contacts [19–21], and how measurement quality differs with con-text. Among the few studies that addressed methodo-logical aspects of contact measurements, five focussed on reporting problems in diary studies [20–24], two compared sensor-measured to diary-reported contact data [20, 21], both in a high school context, and one re-lated sensor-measurements to direct observations [25]. Notably, some robust features have emerged from these studies: in particular, that reporting of transient con-tacts is poor whereas extended concon-tacts are reported reliably [20–22]. Other results, such as reporting prob-abilities, vary between studies. Overall, more studies are needed, especially for contacts occurring in different contexts.
An important factor affecting the validity of contact measurements and the participants’ response in contact studies is acceptability, not only of the data collection as such, but also of the specific measurement method used. To our knowledge, there are no specific data available on the acceptability of wearable sensors used in contact studies, and only two studies assessed the acceptability of paper diaries [5, 8]. Both studies report positive sub-jective assessments, e.g., that filling in diaries seems easy to many participants. This is in contrast to the reporting errors observed, e.g., by Smieszek et al. [20, 22]. More-over, both Smieszek et al. [20] and Mastrandrea et al. [21] obtained a higher participation rate for sensor-based measurements than for diaries collected in the same populations (high school members), i.e., many more students agreed to wear sensors and actually wore them than students were willing to complete and submit a contact diary.
Here, we aimed at a joint investigation of measure-ment errors in contact studies and participants’ attitudes and self-assessments. This paper contributes to the exist-ing literature in three ways: First, we measured contacts with both contact diaries and wearable proximity sensors at a scientific conference in Germany, adding another setting to the few existing datasets that allow an analysis
of measurement differences and errors. Second, we investi-gate the potential impact of these differences on estimates of the basic reproduction number, R0, and contact
dur-ation. Third, we investigate the sentiments of participants towards both methods, in particular regarding practicabil-ity, privacy, participation’s effects on social interaction, and the feasibility of potential future study designs.
Methods
Protocols, material, code and data
Code, questionnaire, contact diary as well as the final anonymous datasets are provided as online supplemen-tary material (Additional files 1, 2, 3, 4, 5, 6, 7, 8, 9, 10, 11 and 12).
Recruitment
We conducted a study involving participants of a scientific conference on epidemiology (“Jahrestagung der Deutschen Gesellschaft für Epidemiologie”, http://dgepi.de/ jahrestagungen.html) in Ulm, Germany, September 2014. Study participants were recruited during the first half of the first conference day. Of the approximately 300 conference attendees, 100 could have participated in our study (number of available sensors); we were able to recruit 76 participants. All but one of them returned the sensors, and 74 contact diaries were handed back. Of these, 6 did not fill in any of the questions on acceptability and study design that were placed at the end of the diary booklet, and an additional 6 participants completed only the last page with questions on future studies, presumably by mistake.
Data collection Wearable sensors
We used active Radio Frequency Identification (RFID) sensors developed by the SocioPatterns collaboration; a precise description of the devices’ functionality has been published [15], which we briefly summarise here: Partici-pants wore the sensors in a pouch that was attached to a lanyard; the sensors exchange low-power radio signals only on short distance (~1.5 m) if unobstructed [15], e.g., not covered by hands, and can thereby detect close-proximity face-to-face events between participants; detected interaction events are sent to and logged by radio receivers; the final data is aggregated with a temporal resolution of 20 seconds. Of note, it is possible that situations occur where two individuals are in close proximity but do not face each other, e.g., sitting next to each other in a lecture hall, resulting potentially in no registered contact event by the sensors while exchanging more than 10 words would be reported in the diary (see also paragraph “Difference in the contact definition” in the discussion). Fourteen re-ceivers were deployed at the conference venue as depicted in Additional file 13: Figure S1. Activated sensors were
given to the participants together with a contact diary after signing the consent form.
Paper-based contact diaries
We handed out paper-based contact diaries, which were similar in content to those from previous contact studies [6, 7, 22]. Participants were asked to report any contact with another study participant that fulfilled at least one of the two following conditions: (i) physical contact and/ or (ii) mutual conversation of at least 10 words. Here, a contact with a specific person is defined as the aggregate of all individual contact events with that person through-out the entire study period. We equipped the pouches containing the sensors with clearly visible, short identifiers (IDs, consisting of a letter and a one-digit number, e.g., “B4”), which allowed study participants to recognise each other and to report contacts unambiguously. If partici-pants were not able to recall the ID, they were still asked to report the contact and to tick an “ID un-known” box instead. Participants further logged for each contact gender and estimated age of their counter-part, an estimate of the aggregated (i.e., total) contact dur-ation (categories: <5 min, 5-15 min, 15-60 min, and >60 min), kind of contact (physical contact and/or conver-sation), and familiarity with the counterpart (well-known or not).
Questionnaire on acceptability
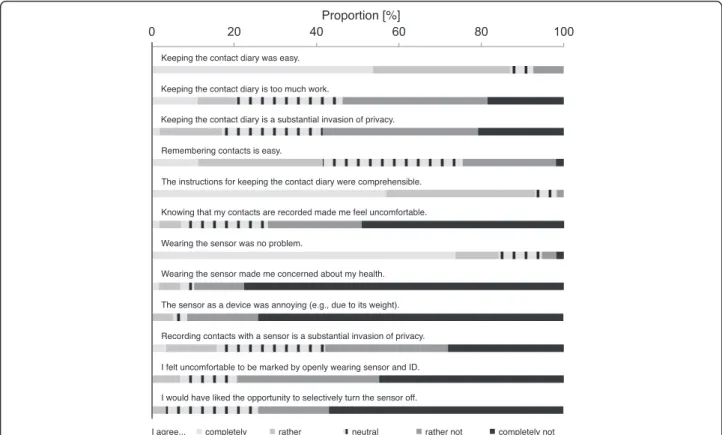
A questionnaire on demographic data (gender and age in 10-year categories) and acceptability of the two methods was also part of the diary booklet. We asked participants to rate twelve acceptability items (5 categories, for details see Fig. 3 and Additional file 1), to estimate the time needed for completing the diary, to evaluate if study participation affected their contact patterns, and to assess their own, perceived, reporting quality. Finally, we asked the partici-pants if they deemed potential long-term population-based study designs based on wearable sensors feasible.
Data handling and processing
Booklet data entry, cleaning, and imputation
Diaries and questionnaires were entered twice by differ-ent staff members, and differences were resolved with the help of a third staff member. Missing information about a participant’s age or gender was inferred by using the age and gender information that was reported by the participants’ contact partners. Unambiguous imputation was possible for all missing gender entries and for all but one missing age entries.
Processing and cleaning of the sensor data
Raw contact data were retrieved from the 14 receivers, and processed following previously used protocols [15]. During the recruitment and deployment phase, sensors
were successively prepared and activated by inserting the battery. However, deployment logistics required to pre-pare several sensors at once resulting in small heaps of activated sensors, which might have led to illegitimate contact recordings before or while the sensors were handed over to the participants. To correct this, we tested various filters and identified two, which produced contact data that were plausible and maximally consist-ent with the data from the diaries: (i) filtering out all groups of more than four simultaneous contact partners (filter 1), (ii) for filter 2, we proceeded in the same way, and additionally removed all contacts that involved already removed sensors and occurred immediately before or after the grouped contacts removed by filter 1. Filter 2 allowed us to discard sets of sensors laying acti-vated on the table in changing constellations. Finally, the temporally resolved data were aggregated over the entire contact day.
Data matching
Diary and sensor data were matched directly when par-ticipants reported contacts including their counterpart’s ID. Contact reports with a missing or unknown ID were, for sensitivity analysis, treated as discordant or matched based on plausibility. In the latter case, we created two different matched datasets, one optimizing the concord-ance within the diary data, the other optimizing the concordance between sensor and diary data. A necessary condition for a plausible match was in either case that a potential counterpart matches the reported demograph-ics. For the diary-optimized dataset, a second condition for a match was that the potential counterpart reported contact to the reporting participant; for the other data-set, the second condition was that the sensors recorded contact between the reporting participant and the poten-tial counterpart. Contact reports with an“unknown ID” that could not be matched were deemed to represent discordant contact reports.
For reasons of data protection, we merged categories such that no demographic group (gender and age com-bined) had ≤5 participants; as a consequence, age has been dichotomised (<40 years,≥40 years).
Resulting datasets
For both self-reported and sensor-recorded data, three datasets were available for analyses: The self-reported sets consist of (i) raw data, (ii) data with matched con-tact reports (diary-optimized), and (iii) matched concon-tact reports (sensor-optimized). The sensor-recorded sets consist of raw data and filtered data, using filter 1 and 2. As results for both filtered datasets were similar, we only show results for the data obtained after applying the stricter filter, i.e., filter 2, and refer to them as filtered data.
Analysis
Probabilities of reporting contacts
Our study population was a clearly defined group and, in an ideal world with perfect reporting, every contact among participants would be reported by both involved participants. Deviations from this ideal indicate report-ing errors. To account for these, we estimated the com-plementary contact reporting probabilities using a unit square approach as described previously [20, 22] and validated with another method [26]. This approach is similar to capture-recapture methods [27]. We estimated the probability P of reporting a contact of specific dur-ation, which is equivalent to sensitivity, based on the num-bers of concordant and discordant contact reports under the following assumptions: (i) contact underreporting is possible, but no contacts are fabricated; (ii) contact reports are stochastically independent; (iii) in a matching pair of contact reports, we assume the higher duration value to be true if the reported durations are not equal. We ap-proximated 95 % confidence intervals (CI) based on 10000 resamples of the study population (bootstrapping), and we also tested reporting differences between duration cat-egories for statistical significance with these resamples. Differences between diary and sensor data
The mapping of contact reports on sensor measure-ments allows estimating the probabilities (a) of a sensor-detected contact to be reported by a participant and (b) of a contact report to be also picked up by a sensor. The best estimates for these probabilities are the empirical proportions of reported or measured contacts. CIs and statistical significance were, again, determined using bootstrapping with 10000 resamples.
In addition, to estimate correlation between the num-bers of distinct contact partners (degree) measured with both methods we computed Kendall’s τ-b and visualised the agreement of both methods with Bland-Altman-Plots. Degree distributions and R0
We compared descriptively the degree distributions in the diary data, amended diary data (discordant reports made concordant by imputing unreciprocated reports), and in the sensor data. Mean degrees play a pivotal role in models of infection spread and for estimating the basic reproduction number R0. It is, however, known
that both degree dispersion as well as contact durations and their distributions affect R0[6, 28, 29]. Therefore,
we report the results for the most basic correction, R0,het=R0,hom∙(1 + CV2) - with CV being the coefficient
of variation of the degree and the indices hom and het indicating R0 assuming a homogeneous degree and R0
corrected for degree heterogeneity, respectively [28, 29] -to determine how R0 differs from the homogeneous
mixing model, when we allow for degree dispersion. We
also report the results of the same correction for a degree information that only includes contacts of more than 15 minutes, as previous research suggested that these con-tacts might be more relevant for the transmission of several infections than shorter ones [30] and since contact duration is deemed to affect transmission probability [6]. Finally, we project relative differences in R0,het between
diary and sensor data (for both all contacts and >15 min contacts only), applying the common assumption in mod-elling thatR0,homis proportional to the mean degree.
Differences in strength between diary and sensor data We compared for each participant the strength [31], which is here the sum of the durations of all contacts a participant had with all its contacts partners throughout the study day, as measured by the sensors and as com-puted from contact diaries. The strength is considered a good indicator for a person’s potential for disease trans-mission [12, 32]. From the sensor data, we could derive strength point estimates. Duration in the self-reported data was a priori categorised. Hence, the diary strength of each participant was established as an interval ranging from the minimal to the maximal plausible strengths.
To compute the minimal plausible strength of an indi-vidual A, we consistently assume the smallest possible durations (including 0) for all contacts in which A was involved (i.e., either A reported a contact or another per-son reported a contact with A, or both). For the maximal plausible strength of an individual, we instead consistently used the upper bound of the reported categories for each contact in which that individual was involved. Since the highest duration category (>60 min) had no given upper bound, we defined an upper bound of two hours.
For statistical analyses, we also defined an intermediate strength, which was based on the mid-points of the dur-ation categories. In a comparison of sensor-measured and diary-based strength values, we can distinguish three dis-tinct cases: (i) participants whose diary-based strength range (minimum to maximum) enclosed their sensor-measured strength; (ii) those whose maximally plausible self-reported strength was less than their sensor-measured strength; (iii) those whose minimally plausible self-reported strength was higher than their sensor-detected one. Questionnaire
For analysis of questionnaire items that required ex-perience in keeping a contact diary (F1 to F4, Add-itional file 1), we considered only participants who reported contacts. To compare groups (e.g., differences between genders or age strata), Chi2- or Fisher’s Exact tests, when appropriate, were used for categorical variables and Wilcoxon or Kruskal-Wallis tests for continuous variables after evaluating distribution. We considered p-values < 0.05 as significant.
Analyses were conducted with STATA 12 IC (StataCorp LP) and, most of the contact data analyses, with code written for Enthought Canopy Python 2.7.3.
Results
Study population
Of 74 study participants, 61 % were female (n = 45) and 39 % were male (n = 29); 68 % were <40 years (n = 50) and 31 % were≧40 (n = 23); for one person age was not reported. Of all participants <40 years, 74 % (n = 37) were female, whereas in the older age group 35 % (n = 8) were female.
Description of contact data
In total, 329 contact reports were obtained from the contact diaries, corresponding to 199 contacts: 130 con-tacts were noted by both parties (corresponding to 260 reports), 35 contacts were only reported by one partici-pant (incl. 3 contacts to a participartici-pant who did not return the contact diary), and 34 contacts with unknown ID were reported (Table 1). Thus, crude overall concordance was 66.3 % (130/196; denominator without the 3 contacts con-tacts to a participant who did not return the diary).
After matching contact reports with unknown IDs with unreciprocated reports (diary-optimized matching variant), we obtained 189 contacts of which 137 were concordant (i.e., 137 pairs of individuals reporting each a contact with the other), 25 contacts that were only re-ported by one participant, and 27 remaining contacts with unknown ID. Overall, 54.5 % (103/189) of contacts were physical and 67.7 % (128/189) of contacts were with a well-known counterpart (see Additional file 13: Table S1 and Additional file 13: Table S2).
The sensors recorded 316 contacts among the study participants, which would have resulted in 632 contact reports in the diaries if both capturing systems had assessed all contacts completely (Table 2).
Comparing the crude survey and sensor datasets, we found 191 contact reports in the diaries (out of 329) that were also recorded by the sensors; 407 instances where the participants did not report a contact, but a contact was recorded by the sensors; 104 diary contact reports that did not match with the sensor recordings and 34 had an unknown ID. However, comparing edited survey data including matched“unknown IDs” (sensor-optimized) with filtered sensor data, we observed 219 concordant measurements, 313 instances without a diary report that were sensor-recorded, 106 reports that were not measured by the sensors, and 4 reports with a remaining unknown ID (Table 2). Of the 313 instances that were only recorded by sensors, 87 % (272/313) had a duration of one minute or less, and 10 % (30/313) had a duration between one and five minutes. Hence, only 3 % (11/313) of the instances that were only recorded by the sensors had a duration of more than 5 minutes.
Diary reporting probability
From the diary data, we estimated the probabilities that a contact according to the diary contact definition was re-ported for the four different duration categories. For the matched dataset (diary-optimized), we estimatedP = 72.2 % [63.5-81.1 %] for durations <5 min,P = 86.4 % [77.3-94.3 %] for durations 5-15 min,P = 89.2 % [80.6-96.3 %] for dura-tions 15-60 min, andP = 94.4 % [88.5-98.8 %] for durations >60 min. The estimated probability for durations <5 min was significantly lower than the estimates for all three other categories (p < 0.01); none of the other differences was statistically significant.
Differences between sensor and diary data
For the filtered and matched datasets, we estimated a congruency of 33.9 % [28.0-40.5 %] for <5 min; 78.0 % [64.7-90.9 %] for 5-15 min; 93.8 % [84.4-100.0 %] for 15-60 min. The estimated probabilities for all duration
Table 1 Number of contacts stratified by duration as reported in the diaries
Reported duration: higher value
Reported duration: lower value <5 min 5-15 min 15-60 min >60 min Duration missing Σ No report 17 (20) 4 (6) 3 (4) 0 (0) 1 (2) 25 (32)a Unknown ID 10 (14) 8 (10) 4 (4) 4 (5) 1 (1) 27 (34) <5 min 30 (28) 22 (19) 3 (3) 3 (3) n.d. 58 (53) 5-15 min n.d. 11 (11) 8 (8) 3 (3) n.d. 22 (22) 15-60 min n.d. n.d. 17 (17) 6 (5) n.d. 23 (22) >60 min n.d. n.d. n.d. 22 (22) n.d. 22 (22) Duration missing 5 (5) 5 (4) 1 (1) 0 (0) 1 (1) 12 (11) Σ 62 (67) 50 (50) 36 (37) 38 (38) 3 (4) 189 (196)
For concordant reports that differ in duration, columns contain the higher, rows the lower duration report (i.e., there were 22 pairs of individuals such that one of the pair reported a contact of less than 5 min while the other one reported a contact of 5-15 min); discordant reports and unknown IDs are also shown in rows; bold numbers show data after matching (diary-optimized), numbers in parentheses show crude data; n.d. = not defined.
a
categories were significantly different from all other esti-mates (each comparison p < 0.05). Most discrepancies in the shortest duration category (<5 min) were due to very short contacts (≦1 min). Contacts of ≦1 min duration had a congruency of 25.3 % [19.4-32.1 %], whereas all contacts of a longer duration within this category had a congruency estimate of >60 %.
We analysed if there was a potential gender or age effect in reporting of contacts <5 min (for details see Additional file 13); however, assessing the confidence intervals of the respective proportions, none of the group comparisons re-vealed a significant difference. Stratified estimates for the other duration categories were not meaningful because of very wide confidence intervals.
If using the reported contacts as denominator, and cal-culating the proportion of all reported contacts that were also detected by the sensor network, we estimated a detec-tion probability 57.5 % [45.5-68.8 %] in the <5 min dur-ation category; 60.3 % [46.0-75.0 %] in the 5-15 min category; 66.1 % [51.4-82.0 %] in the 15-60 min category; 95.2 % [87.0-100 %] in the >60 min category. The esti-mated probability for durations >60 min was significantly higher than the estimates for all three other categories (p < 0.01); none of the other comparisons was statisti-cally significant. The detection probability of contact reports with missing duration was 53.3 % [20.8-87.5 %].
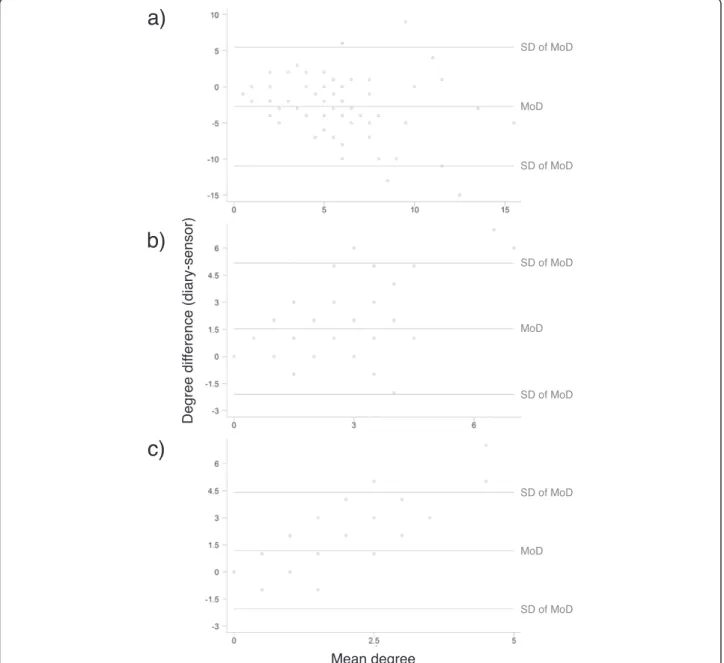
We further analysed if the reported and recorded degrees were correlated: Kendall’s τ-b as measure of de-gree correlation for both methods was for all contacts 0.29 (p <0.001), for contacts ≥5 min 0.50 (p <0.001), for contacts≥15 min 0.37 (p < 0.001). Figure 1 illustrates dif-ferences in reported and recorded degree as a function of the mean degree of both measurements: For all con-tacts regardless of duration, diaries measure an average of 2.7 contacts per participant less than the electronic devices; for contacts ≥5 min they measure 1.5 contacts more and for contacts≥15 min 1.2 more. All three con-stellations show very few outliers, with a systematic devi-ation to the effect that for both analyses with restriction
on duration outliers occur only in one direction, i.e., that diaries measure more contacts (Fig. 1b and c).
Degree distributions and reproduction numbers
Simple homogeneous mixing models typically define the basic reproduction number,R0, as the product of
trans-missibility, contact rate (here defined as mean degree per day), and duration of infectivity. However, R0
actu-ally depends on a complex interplay between degree dis-tribution [28, 29, 33, 34], contact duration and intensity distribution [6, 35], and biological factors [36]. Details of degree distribution parameters of our data are provided in Additional file 13: Table S3.
When calculating the basic reproduction number R0
accounting for degree heterogeneity, we found that one would expect the heterogeneous R0.het to be between
133 % (recorded, filtered data) and 148 % (reported, crude data) ofR0,hom(when using the homogeneity assumption
that all individuals have the same degree), and between 213 % (reported, matched) and 319 % (recorded, crude) when only considering contacts with a duration of at least 15 min (see Additional file 13: Table S3), which are thought to be of more relevance for the transmission of many infectious disease [30, 37, 38].
WithR0.hombeing proportional to the mean degree and
R0.hetbeing a function ofR0.homand the coefficient of
vari-ation of the degree, we were able to project ratios ofR0.het
andR0.homfor various reported and recorded contact data
from our study. When both short and long contacts are included in the analysis, the basic reproduction number R0.hetresulting from the diary data would only be 76 % of
that coming from the sensor data. The opposite is true if only contacts >15 min are included in the analysis; then R0.hetfrom the reported data is 236 % of the
correspond-ing value from the recorded data.
Diary-reported versus sensor-detected strength
Figure 2 shows the plausible range of strength (aggregated duration of all contacts) values as obtained from diaries Table 2 Number of diary reports versus sensor recordings stratified by contact duration
Sensor
Diary No detection <5 min 5-15 min 15-60 min >60 min Unknown ID Σ No report n.d. 302a(394b) 9 (11) 2 (2) 0 (0) n.d. 313 (407) <5 min 49 (49) 63 (52) 5 (4) 1 (1) 0 (0) 2 (14) 120 (120) 5-15 min 29 (27) 37 (29) 5 (5) 2 (2) 0 (0) 0 (10) 73 (73) 15-60 min 18 (18) 27 (26) 6 (5) 6 (6) 0 (0) 2 (4) 59 (59) >60 min 3 (3) 20 (11) 16 (17) 21 (24) 2 (2) 0 (5) 62 (62) Duration missing 7 (7) 8 (7) 0 (0) 0 (0) 0 (0) 0 (1) 15 (15) Σ 106 (104) 457 (519) 41 (42) 32 (35) 2 (2) 4 (34) 642 (736)
Columns contain sensor measurements, rows diary reports; bold numbers show data after filtering (sensor data) and matching (sensor-optimized), numbers in parentheses show crude data; n.d. = not defined;a
272≦1 min duration,b
vs. the strength measured by sensors. In addition, Table 3 shows median strength in each of the comparison categor-ies. More than one third of participants have diary-computed strengths compatible with sensor data, and diary data overestimate sensor data for more than half. An underestimation in the diaries with respect to sensors is obtained only for 6 participants.
Self-assessed workload and reporting quality
The retrospectively assessed median time of filling in the contact diary was 5 minutes (interquartile range (IQR) 5-10,n = 61). It took participants 1.25 minutes per con-tact (median; IQR 1-2.5, n = 56) to fill in all required
information. There was no statistically significant differ-ence regarding gender (p = 0.45) or age (p = 0.42).
Seventy-eight percent (45/58, 95 %-CI 65-87) thought that they assessed the number of their contacts to other study participants correctly, i.e., that they did not forget or fabricate contacts; 21 % (12/58, 95 %-CI 11-33) thought they underestimated their number of contacts, and 2 % (1/58, 95 %-CI 0-9) reported an overestimation. We detected no statistically significant association of this self-assessment with gender (p = 0.38) or age (p = 0.33).
Using the absolute difference between self-reported num-ber of contacts and sensor-measured ones as a marker for underreporting, respondents who classified themselves as
Fig. 1 Bland-Altman plots for degree measured by both methods: including a all contacts, b only contacts≥5 minutes, c ≥15 minutes. SD: standard deviation, MoD: mean of degree difference
“underreporter” had a median of 5 missing contacts (range 1-13) and respondents who assessed their reporting as correct had a median of 4 (range 0-15); no significant differ-ence between these two groups was identified (p = 0.4).
Seventy-four percent (45/61, 95 %-CI 61-84) evaluated their social interaction as unchanged by the study (no stat-istical significant association with gender or age). Of those who perceived a change (16/61), 93 % (14/15, 95 %-CI 68-100) reported an increase in contact numbers and 90 % (9/10, 95 %-CI 55-100) thought their contacts were longer than without study participation.
Acceptability
Only 20 % of respondents (11/54, 95 %-CI 11-34) with at least one reported contact stated that filling in the diary is too much work. A quarter of respondents re-ported difficulties in remembering contacts (13/53, 95 %-CI 14-38); however, 85 % of these (11/13, 95 %-CI 55-98) assessed themselves as having reported the right number of contacts. Reported easiness of filling in the diary, perceived workload and easiness of remembering
contacts were not associated with the time spent per contact of filling in the diary (p = 0.72, p = 0.20 and p = 0.24) or number of contacts (p = 0.33, p = 0.33 and p = 0.51). Participants who rated filling in the diary and re-membering contacts as easy reported a higher, but not significantly different, proportion of familiarity with their counterparts than those who disagreed: median of 60 % versus 50 % and of 62.5 % versus 50 %; however, partici-pants with neutral positions had even higher median proportions (67 and 63.3 %).
Ninety-three percent (53/57, 95 %-CI 83-98) had no negative sentiment towards having their conference con-tacts measured by a wearable sensor. Additionally, only 16 % (9/57, 95 %-CI 7-28) see it as a strong invasion of privacy. Fig. 3 depicts the answer categories for all twelve items. We detected no significant association with age or gender for any of the items.
Future study design
When asked whether participants thought participation in a future study using wearable sensors would be possible for
Fig. 2 Sensor-based (abscissa) versus diary-based (ordinate) strength per participant. Diary-based strength is given as range, from the minimal plausible to the maximal plausible strength value that was consistent with the reported duration categories. Sensor-based strength values are point-estimates and jittered, where necessary. Dotted line indicates equal strength. Blue ranges include the corresponding sensor-based strength, red ranges exclude it
Table 3 Diary- and sensor-based strength among the three groups that result from the diary-sensor-strength comparison
Diary-based strength lower than the sensor measurement
Diary-based strength includes sensor measurement
Diary-based strength higher than the sensor measurement N (%) 6 (8 %) 26 (35 %) 42 (57 %)
Diary-based strength (median) 0 43 min 171 min Sensor-based strength (median) 3 min 18 min 19 min Degree (median), diary 0a 4 5 Degree (median), sensor 3 8 6.5
a
them if the device were to be worn once a week on a ran-domly chosen day over a one-year period, 51 % (28/55, 95 %-CI 37-65) agreed. Seventeen percent of respondents (10/59, 95 %-CI 8-29) agreed completely that a population-based study using wearable sensors or another digital detector is feasible, 69 % agreed rather or partly (41/59, 95 %-CI 56-81), and 14 % (8/59, 95 %-CI 6-25) dismissed the idea.
Discussion
Both sensor-measured contacts and self-reported con-tacts were distinct sets with a large intersection, but none was an entire subset of the other. Using the diary reports, we estimated reporting probabilities between 72 and 94 %, with lower probabilities for shorter contacts, consistent with previous studies [20–22]. When compar-ing both contact measurement methods, we obtained a substantial overlap in reporting and recording, but also important differences, with in each case contacts re-ported or recorded by one method but not the other. Relating diary reports to sensor recordings, we found reporting probabilities between 34 and 94 %, again with lower probabilities for shorter contacts, and relating sen-sor recordings to diary reports, we estimated recording probabilities between 57 and 95 %. Both methods of contact measurement were acceptable to the participants
in our specific setting: Only 20 % of respondents with at least one reported contact stated that filling in the diary was too much work and 25 % reported difficulties in re-membering contacts. Almost all participants (93 %) were comfortable having their conference contacts measured by a wearable sensor.
Differences between diary and sensor data
Differences between diary and sensor contact data can be classified into three different categories: (i) legitimate dif-ferences due to different underlying contact definitions, (ii) differences due to limited receiver coverage, (iii) differ-ences due to reporting and measurement errors.
Differences in contact definitions
The proxy for a potentially contagious contact in contact diaries is social interaction, i.e., conversation and/or physical contact. The definition underlying sensor mea-surements is broader in a sense that every short-distance, face-to-face collocation of two participants was recorded. It is likely that in our study sensor-recorded face-to-face events without conversation or physical contact occurred that were legitimately not reported in the diaries. Con-versely, participants might have reported conversations that were not clearly face-to-face but angled or even
side-Fig. 3 Answer categories to items of acceptability questionnaire (missing values: first two questions:n = 15; questions 3, 4, 5, 8, 9, 11, 12: n = 16; questions 6, 7, 10:n = 17)
to-side, or over a distance of more than ~1.5 m, which were then not recorded by the sensors.
Under- and overrecording with sensors
The SocioPatterns infrastructure used here required sta-tionary receivers to store contact data (unlike, e.g., TelosB motes [16], which store contact data directly on the sensors). As a consequence, only contacts that took place in an area covered by at least one receiver were recorded. The positioning of receivers is often - and was in our study - constrained by health-and-safety requirements (e.g., no exposed wires someone could trip over), the avail-ability of power sockets, the arrangement and orientation of walls, etc. Blind spots in the study area due to these constraints might have been present. Furthermore, we only covered the rooms, lecture theatres, and open spaces used for the conference, but we did not cover the canteen or outdoor spaces (see Additional file 13: Figure S1). It is highly likely that some contacts took place there, too.
Underrecording can also happen when participants do not adhere to the instructions and place their sensor under a jacket or at another inappropriate place that shields electromagnetic signals. We observed, e.g., one participant placing his sensor in a backpack. These rea-sons as well as reporting of angled or distant conversa-tions might explain why about 42 % of short contacts (less than 5 min) that were reported were not recorded by the sensors.
Overrecording happened during the recruitment phase, when activated sensors had to be distributed to many par-ticipants within very short time. We attempted to remove these artefactual recordings by filtering the raw data (see section“Processing and cleaning of the sensor data”).
Taken together, this highlights the fact that using sen-sors for contact measurements is not fully free of meas-urement errors.
Under- and overreporting with contact diaries
It is generally assumed that discordant reporting is due to underreporting and that no contacts are fabricated [20, 22, 26]. As expected, we found differences in report-ing quality dependreport-ing on duration of contact, with short contacts showing relatively more discordant reports than extended ones.
Our estimates of reporting probabilities were based on three assumptions, one of which was the independence of reporting. Unlike in previous studies, where the reporting was retrospective [20, 21] or well-integrated into the daily routine [22], participants in this study were branded by wearing the sensor pouch with their visible ID number and the study participation itself could have triggered con-versation among participants. Hence, it is likely that the independence assumption was partly violated and con-cordant reports (in either way: both reporting or both not
reporting) might have been overrepresented. As a conse-quence, true reporting probabilities might be lower than estimated here.
Of note, our results confirm two important facts: on the one hand, participants forget to report a proportion of – especially short – contacts [20–22]; on the other hand, there seems to be a tendency to overestimate con-tact duration if concon-tacts are reported (see Fig. 2, and Mastrandrea et al. [21]). Indeed, diary-based estimation of individual strength are larger than the corresponding measure based on sensor data for about 60 % of partici-pants, even if very strict definitions concerning the re-ported strength are applied (see method section). A possible reason for this discrepancy in duration esti-mates could be that durations of contacts as measured by sensors might not meet assumptions of participants about contacts, i.e., they might take the whole duration of a meeting as a contact and not brief periods with face-to-face contacts, leading to overreporting of dura-tions. Another reason could be due to underrecording by the sensors as discussed above. We suppose that the latter factor does not explain a major part of the ob-served difference. Diary-based strength smaller than sensor-based strength was obtained only for few partici-pants; however, given 5/6 of these participants did not report any contact, they had no real opportunity to bias their contact duration.
The majority of participants, nearly 80 %, thought that their reporting concerning the number of contacts was correct. This self-evaluation confirms findings from a previous study: in McCaw et al. most participants of this three-day paper diary study thought that they got the number of contacts right. [5] However, taking actual reporting errors into account, the comparison shows that even scientifically trained participants are subject to misperceptions (72 % reporting probability for short contacts).
A problem for contact studies is that measuring behav-iour can influence it: about one quarter of our study par-ticipants reported more frequent and longer contact events that they attributed to the study, although in longer studies, e.g., over a week, this effect could wear off and it might be of less impact in studies without visible ID. Comparison of contact reporting with previous studies The crude overall concordance of contact reporting, i.e., contacts that were reported by both parties, we observed in our study was at 68.8 % considerably higher than in previous studies conducted at a university (30.2 %), a US high school (23.5 %), and a French high school (44.9 %) [4, 20, 21] and similar to the one of a study done at a research institute over one week (65.0 %) [22]. Interest-ingly, Conlan et al. reported a concordance of 61 % from a contact study investigating social network primary
school students aged 4 to 11 years [23]; however, in this study contact networks were built on general reports from children about their social network and were not specific to a given study period. Also, degree was a priori limited by questionnaire design. Both characteristics might contribute to high mutual reporting and render direct comparison with our study not feasible.
Stratifying for duration, the reporting probabilities in our study are qualitatively in line with previous studies. However, in Smieszek et al. [22], participants reported short contacts with a probability of 49.0 % compared to 72.2 % in our study, despite having a high reporting probability in other duration categories. One reason might be that the 2012 study asked the participants to report contacts over several days, which increases the overall workload of participants, and that there were more contacts to be reported. In Smieszek et al. 2014 [20], the reporting probabilities of all duration categories were considerably lower - with the exception of contacts >60 min - which might be due to the retrospective study design, and the particular group of study participants (high school students). Finally, Mastrandrea et al. [21] found 40 % reporting probability for contacts <5 min, and 72 % for contacts >60 min.
Reasons for the particularly high reporting probabilities in our study compared to previous ones could be: the low density of study participants among conference attendees and the fact that a very structured conference day is asso-ciated with a low workload; the study duration was also comparatively short (4 to 8 hours); moreover, the study population consisted mostly of scientists, who are familiar with filling in questionnaires and who are probably intrin-sically motivated to produce data of good quality.
Interestingly, in our study the reporting by men was not lower than that of women, in contrast to findings from a previous study [20] where the reporting by female study participants was about twice as high as that of males. However, in that previous study, gender specific results might be specific to the age of most of the participants (teenagers) and hence not necessarily generalizable.
Comparing the correlations between reported and re-corded degree with the results from Smieszek et al. 2014 [20], again, we found better correspondence between the data from both methods (Smieszek et al. 2014: τ = 0.01 (all contacts), τ = 0.14 (contacts ≥5 min), τ = 0.21 (con-tacts ≥15 min) with corresponding values of 0.29, 0.50 and 0.37. Nonetheless, the correlation between the de-grees reported and recorded are still weak for all three combinations of contact duration.
Implications of study findings for modelling
We found, in line with previous research, that the discrep-ancies within survey data as well as between sensor- and survey-data are highest in contacts of short duration.
Several studies found that only mixing matrices of con-tacts≥15 min could explain population-wide seroconver-sion of a multitude of infections better than, e.g., random mixing models [30, 37, 38]. If only contacts of a minimal duration of 15 min are included in infection transmission models, then the absolute number of discrepancies de-creases substantially. If we believe short contacts not to be relevant then the high proportion of reporting errors in contacts of short duration might be not as problematic as it appears. However, all published evidence is based on self-reported contact data; it is very likely that the report-ing of short contacts in those studies was also poor, which implies that the findings might be biased.
Even though non-intense and short contacts most likely play a role in infection transmission, the transmission probability per contact for such contacts can be expected to be substantially lower than for extended contacts for most infectious diseases [6, 30, 32, 37–39], which is – be-sides perhaps poor data quality – most likely one of the reasons why no study has found short contacts to be explanatory for serological survey data.
We also found that the correction for pure degree het-erogeneity results in higherR0increases with respect to
a homogeneous mixing R0 hypothesis for contacts
≥15 min than for all (short and long) contacts: in other words, contact data including short and long duration contacts were found to behave closer to random mixing [16, 36] than networks containing only contacts of lon-ger duration, which are much sparser and more struc-tured. Of note, our diary data are expected to produce lowerR0values than the sensor data (for identical
trans-missibility and infection duration) if all contacts are con-sidered, but much higher R0 for contacts≥15 min only.
The underlying reason for this, i.e., the situation that shorter contacts are reported less and longer contacts are reported slightly more often than recorded, is also reflected in the Bland-Altman plots (Fig. 1) and may be due to the fact that the durations of contacts were esti-mated to be longer than the corresponding recording of duration by sensors, as discussed above.
Acceptability
When interpreting participants’ attitudes and assess-ments we have to bear in mind the specific setting the study took place in, i.e., a semi-public space where as-pects of privacy, social control and familiarity with other people might be different both from completely public or private spaces. Privacy regarding both reporting con-tacts in a diary and being recorded with a digital device worried only a minority of respondents in our setting. The same applies for being tagged with the visible ID. Consistent with this, only a very small minority of par-ticipants would like to be able to turn off the sensor. In all, respondents had a very relaxed attitude towards
reporting and being reported in our specific setting. Apart from aspects of social control (that are already in place at a conference setting and cause contact measure-ments not to be an additional control), it might be the case that our participants– mostly German epidemiolo-gists– know and trust the national data protection laws. Hence, issues of privacy might play a more prominent role in different study settings or populations.
In planning future studies, one should take into ac-count that only ca. 50 % of respondents said they would participate in a year-long study with weekly recording for 1 day over the period of one year. This leads to the assumption that network studies can be conducted suc-cessfully only over a couple of weeks and/or in social contexts with a strong social cohesion (which might limit generalizability) or need to provide an effective way to motivate potential participants [21, 23, 40]. Unfortu-nately, social dynamics can also play a negative role and may decrease compliance [20]. Thus, it might be difficult to recruit people into long-term contact studies; how-ever, a majority of those who participated did not object to using diaries or sensors and expressed mostly neutral to positive sentiments. Furthermore, we might want to consider when planning future studies that about 20 % of the participants thought that filling in the diary was too much work; this was also the main concern of non-participants (data not shown). This sentiment leads to the hypothesis that contact studies using digital devices would have a higher response proportion than diary-based ones, as indeed observed in [21].
Compared to literature on attitudes towards contact diaries, our findings are similar. In the study by Beutels et al. about two-thirds of the participants of a two-day paper-based contact diary study associated “little effort” with the diary and in McCaw et al. nearly two-thirds of the participants rated filling in a diary as easy [5, 8]: in our study, nearly 90 % evaluated filling in the diary as easy. In addition, one other issue has been already ad-dressed by a previous study: in Beutels et al. about 60 % of study participants saw (nearly) no change of number or kind of contacts by keeping the diary [8]; in our study this corresponds to 74 % with the lower limit of the con-fidence intervall (61 %) conveying no relevant departure from the previous finding.
Limitations
Wearable sensors record contacts only among people that are equipped with them, meaning that only contacts within clearly defined groups can be measured. While diaries can be distributed to, e.g., a random sample of any population [7], any approach for assessing reporting errors from diary data also requires clearly defined par-ticipant groups. This necessary restriction limits the generalizability of studies’ results: Different groups most
likely vary in cognitive capability or motivation. Further-more, the difficulty of the reporting task differs between study settings. Our study had a low participant density (about 30 % of all conference participants and a median degree of 4) so that the corresponding low workload might have resulted in fewer errors. Also, some items of the acceptability survey might be positively influenced by the low workload, e.g., easiness of filling in the diary or remembering contacts.
Further, it is likely that self-selection biased responses on acceptability towards more positive answers: confer-ence attendees who a priori deemed the study too de-manding or unappealing were probably more likely to refuse participation than others with positive sentiments towards the study. Selection bias might not only have in-fluenced study results by deterring conference attendees with a high expected number of contact events, but also shy attendees or people who are unfamiliar with the community. Whereas the first might lead to an under-estimation of reporting errors, the latter might result in the opposite effect. Finally, regarding statistical differ-ences between or among groups, our study might have not enough power to detect existing differences.
Conclusion
Using data from contact diaries for analysing and explain-ing the transmission of highly contagious infections, i.e., when even short and non-intensive contact may be suffi-cient for transmission like it might be the case with, e.g., pertussis, is questionable. Studies conducted in three dif-ferent settings (scientific conference, high school, work-place) have independently shown that reporting of short contacts (<15 min) is unreliable [20–22]. Reporting of extended contacts is almost complete, but missing data might also not be at random (since, e.g., participants cer-tainly also differ in their levels of motivation for reporting contacts correctly).
Conducting a contact study with diaries or wearable sensors within the context of a scientific conference is well accepted and mostly easily done by participants. However, we have to recognise that measuring contacts might modify them in number and duration, especially if the study involves wearing visible IDs. This effect could be of less importance for studies that carry on for several days and could increase if participants have to report (or are recorded by digital devices) contacts that occur in social situations less desirable by society than a scientific conference.
There are studies that showed a relationship between contact patterns and patterns of infection for both wear-able sensors and contact diaries [30, 41, 42]. However, an-other study did not find that empirical contact matrices explained seroepidemiological data of pertussis transmis-sion better than, e.g., homogeneous mixing [43]. Since
contact data are used to inform public health policy, it is pivotal to deepen our understanding of which events actu-ally result in infection transmission and which contact proxies capture those events best. Three types of studies would be worthwhile for future research: (i) a comparison between contact diaries, wireless sensor networks, and video-assisted observations at the same time, to achieve method triangulation; (ii) modelling studies that test to what extent the presented differences in contact structure between the methods and measurement biases affect model outcomes; (iii) studies that relate transmission events based on pathogen detection to empirical contact data of the same setting to delineate which contact proxy works best and to improve our knowledge about disease transmission.
Additional files
Additional file 1: Study booklet. (PDF 187 kb) Additional file 2: Codebook. (XLSX 27 kb) Additional file 3: Acceptance data. (CSV 6 kb)
Additional file 4: Contact data– sensors filtered. (CSV 5 kb)
Additional file 5: Contact data– sensors filtered (extended). (CSV 5 kb) Additional file 6: Contact data– sensors unfiltered. (CSV 6 kb) Additional file 7: Contact data– survey matched to sensors. (CSV 5 kb) Additional file 8: Contact data– survey matched to surveys. (CSV 5 kb) Additional file 9: Contact data– survey. (CSV 5 kb)
Additional file 10: Demographic data. (CSV 4 kb) Additional file 11: Contact analysis. (PY 67 kb) Additional file 12: Questionnaire analysis. (DO 10 kb)
Additional file 13: Supplementary Figure and Tables. (PDF 304 kb) Abbreviations
CI, confidence interval; CV, coefficient of variation; ID, identifier; IQR, interquartile range; RFID, radio frequency identification
Acknowledgements
The authors thank Dietrich Rothenbacher (conference host), Nicole Kroll (both University Ulm), the staff at Dezernat V, Abt. V-1, University Ulm, the executive board of the German Society for Epidemiology (DGEpi) e.V. for supporting the study, the participants for taking part, Fredrik Schäfer (Helmholtz-Centre for Infection Research) for entering data, Pius Krütli as well as David Preradovic (both ETH Zürich) for supporting the study team logistically.
Funding
TS and PJW thank the UK National Institute for Health Research Health Protection Research Unit (NIHR HPRU) in Modelling Methodology at Imperial College London in partnership with Public Health England (PHE) for funding (grant HPRU-2012-10080). PJW also thanks the UK Medical Research Council for Centre funding (grant MR/K010174/1).
The present work is partially supported by the French ANR project HarMS-flu (ANR-12-MONU-0018) to AB, by the EU FET project Multiplex 317532 to AB and CC, by the A*MIDEX project (ANR-11-IDEX-0001-02) funded by the “Investissements d’Avenir” French Government program, managed by the French National Research Agency (ANR) to AB, by the Lagrange Project of the ISI Foundation funded by the CRT Foundation to CC, and by the S3 project funded by the Fondazione Compagnia di San Paolo to CC. The funding bodies played no role in the design of the study and data collection, analysis, and interpretation of data, decision to publish, and writing of the manuscript.
Availability of data and materials
Questionnaire, contact diary, datasets and code are provided as online supplementary material (Additional files 1, 2, 3, 4, 5, 6, 7, 8, 9, 10, 11 and 12). Authors’ contributions
Conceived and designed the study: TS, SC, AB, CC, PJW, GK; prepared technical equipment for sensor data collection: AB, CC; collected the data: SC, TS; prepared and cleaned the contact data: AB, TS; analysed the contact data: TS, SC; analysed the attitude data: SC; interpreted the study results: TS, SC, AB, CC, PJW, GK; authored the manuscript as lead authors: TS, SC; contributed to manuscript: AB, CC, PJW, GK. All authors have read and approved the final version of the manuscript.
Competing interests
The authors declare that they have no competing interests. Ethics approval and consent to participate
The ethics committee of the Medical School Hannover, Germany, approved the study (approval no. 6714) and the office of the German Federal Commissioner for Data Protection and Freedom of Information approved the data protection protocol. Informed consent was obtained from all participants.
Disclaimer
The views expressed are those of the authors and not necessarily those of the MRC, the NHS, the NIHR, the Department of Health, Public Health England or any other organization the authors’ are affiliated with or received funding from. Author details
1
NIHR Health Protection Research Unit in Modelling Methodology and MRC Outbreak Centre for Outbreak Analysis and Modelling, Department of Infectious Disease Epidemiology, School of Public Health, Imperial College London, London, UK.2Modelling and Economics Unit, Centre for Infectious
Disease Surveillance and Control, Public Health England, London, UK.
3Department for Epidemiology, Helmholtz-Centre for Infection Research,
Braunschweig, Germany.4Aix Marseille Université, Université de Toulon, CNRS, CPT, UMR 7332, Marseille 13288, France.5Data Science Laboratory, ISI
Foundation, Torino, Italy.6Hannover Medical School, Hannover, Germany.
Received: 5 October 2015 Accepted: 10 June 2016 References
1. Keeling MJ, Eames KT. Networks and epidemic models. J R Soc Interface. 2005;2(4):295–307. doi:10.1098/rsif.2005.0051.
2. Pellis L, Ball F, Trapman P. Reproduction numbers for epidemic models with households and other social structures. I. Definition and calculation of R0. Math Biosci. 2012;235(1):85–97. doi:10.1016/j.mbs.2011.10.009.
3. Nishiura H, Chowell G, Safan M, Castillo-Chavez C. Pros and cons of estimating the reproduction number from early epidemic growth rate of influenza A (H1N1) 2009. Theor Biol Med Model. 2010;7:1. doi:10.1186/ 1742-4682-7-1.
4. Read JM, Edmunds WJ, Riley S, Lessler J, Cummings DA. Close encounters of the infectious kind: methods to measure social mixing behaviour. Epidemiol Infect. 2012;140(12):2117–30. doi:10.1017/S0950268812000842.
5. McCaw JM, Forbes K, Nathan PM, Pattison PE, Robins GL, Nolan TM, et al. Comparison of three methods for ascertainment of contact information relevant to respiratory pathogen transmission in encounter networks. BMC Infect Dis. 2010;10:166. doi:10.1186/1471-2334-10-166.
6. Smieszek T. A mechanistic model of infection: why duration and intensity of contacts should be included in models of disease spread. Theor Biol Med Model. 2009;6:25. doi:10.1186/1742-4682-6-25.
7. Mossong J, Hens N, Jit M, Beutels P, Auranen K, Mikolajczyk R, et al. Social contacts and mixing patterns relevant to the spread of infectious diseases. PLoS Med. 2008;5(3):e74. doi:10.1371/journal.pmed.0050074.
8. Beutels P, Shkedy Z, Aerts M, Van Damme P. Social mixing patterns for transmission models of close contact infections: exploring self-evaluation and diary-based data collection through a web-based interface. Epidemiol Infect. 2006;134(6):1158–66. doi:10.1017/S0950268806006418.
9. Toth DJ, Leecaster M, Pettey WB, Gundlapalli AV, Gao H, Rainey JJ, et al. The role of heterogeneity in contact timing and duration in network models of
influenza spread in schools. J R Soc Interface. 2015;12(108):20150279. doi:10.1098/rsif.2015.0279.
10. Barrat A, Cattuto C, Tozzi AE, Vanhems P, Voirin N. Measuring contact patterns with wearable sensors: methods, data characteristics and applications to data-driven simulations of infectious diseases. Clin Microbiol Infection. 2014;20(1):10–6. doi:10.1111/1469-0691.12472.
11. Machens A, Gesualdo F, Rizzo C, Tozzi AE, Barrat A, Cattuto C. An infectious disease model on empirical networks of human contact: bridging the gap between dynamic network data and contact matrices. BMC Infect Dis. 2013;13:185. doi:10.1186/1471-2334-13-185.
12. Smieszek T, Salathe M. A low-cost method to assess the epidemiological importance of individuals in controlling infectious disease outbreaks. BMC Med. 2013;11:35. doi:10.1186/1741-7015-11-35.
13. Hornbeck T, Naylor D, Segre AM, Thomas G, Herman T, Polgreen PM. Using sensor networks to study the effect of peripatetic healthcare workers on the spread of hospital-associated infections. J Inf Dis. 2012;206(10):1549–57. doi:10.1093/infdis/jis542.
14. Stopczynski A, Sekara V, Sapiezynski P, Cuttone A, Madsen MM, Larsen JE, et al. Measuring large-scale social networks with high resolution. PLoS One. 2014;9(4):e95978. doi:10.1371/journal.pone.0095978.
15. Cattuto C, Van den Broeck W, Barrat A, Colizza V, Pinton JF, Vespignani A. Dynamics of person-to-person interactions from distributed RFID sensor networks. PLoS One. 2010;5(7):e11596. doi:10.1371/journal.pone.0011596. 16. Salathé M, Kazandjieva M, Lee JW, Levis P, Feldman MW, Jones JH. A
high-resolution human contact network for infectious disease transmission. Proc Natl Acad Sci U S A. 2010;107(51):22020–5. doi:10.1073/pnas.1009094108. 17. Rainey JJ, Cheriyadat A, Radke RJ, Suzuki Crumly J, Koch DB. Estimating contact
rates at a mass gathering by using video analysis: a proof-of-concept project. BMC Public Health. 2014;14:1101. doi:10.1186/1471-2458-14-1101.
18. Baguelin M, Flasche S, Camacho A, Demiris N, Miller E, Edmunds WJ. Assessing optimal target populations for influenza vaccination programmes: an evidence synthesis and modelling study. PLoS Med. 2013;10(10):e1001527. doi:10.1371/ journal.pmed.1001527.
19. Eames K, Bansal S, Frost S, Riley S. Six challenges in measuring contact networks for use in modelling. Epidemics. 2015;10:72–7. doi:10.1016/j. epidem.2014.08.006.
20. Smieszek T, Barclay VC, Seeni I, Rainey JJ, Gao H, Uzicanin A, et al. How should social mixing be measured: comparing web-based survey and sensor-based methods. BMC Infect Dis. 2014;14:136. doi:10.1186/1471-2334-14-136. 21. Mastrandrea R, Fournet J, Barrat A. Contact Patterns in a High School: A
Comparison between Data Collected Using Wearable Sensors, Contact Diaries and Friendship Surveys. PLoS One. 2015;10(9):e0136497. doi:10.1371/journal.pone.0136497.
22. Smieszek T, Burri EU, Scherzinger R, Scholz RW. Collecting close-contact social mixing data with contact diaries: reporting errors and biases. Epidemiol Infect. 2012;140(4):744–52. doi:10.1017/S0950268811001130. 23. Conlan AJ, Eames KT, Gage JA, von Kirchbach JC, Ross JV, Saenz RA,
et al. Measuring social networks in British primary schools through scientific engagement. Proc Biol Sci. 2011;278(1711):1467–75. doi:10.1098/rspb.2010.1807.
24. Read JM, Eames KT, Edmunds WJ. Dynamic social networks and the implications for the spread of infectious disease. J R Soc Interface. 2008;5(26):1001–7. doi:10.1098/rsif.2008.0013.
25. Lucet JC, Laouenan C, Chelius G, Veziris N, Lepelletier D, Friggeri A, et al. Electronic sensors for assessing interactions between healthcare workers and patients under airborne precautions. PLoS One. 2012;7(5):e37893. doi:10.1371/journal.pone.0037893.
26. Potter GE, Smieszek T, Sailer K. Modelling workplace contact networks: the effects of organizational structure, architecture, and reporting errors on epidemic predictions. Netw Sci. 2015;3(3):298–325. doi:10.1017/nws.2015.22. 27. Hook EB, Regal RR. Capture-recapture methods in epidemiology: methods
and limitations. Epidemiol Rev. 1995;17(2):243–64.
28. Pastor-Satorras R, Vespignani A. Epidemic spreading in scale-free networks. Phys Rev Lett. 2001;86(14):3200–3.
29. Anderson RM, Medley GF, May RM, Johnson AM. A preliminary study of the transmission dynamics of the human immunodeficiency virus (HIV), the causative agent of AIDS. IMA J Math Appl Biol. 1986;3(4):229–63. 30. De Cao E, Zagheni E, Manfredi P, Melegaro A. The relative importance of
frequency of contacts and duration of exposure for the spread of directly transmitted infections. Biostatistics. 2014;15(3):470–83. doi:10.1093/ biostatistics/kxu008.
31. Barrat A, Barthelemy M, Pastor-Satorras R, Vespignani A. The architecture of complex weighted networks. Proc Natl Acad Sci U S A. 2004;101(11):3747–52. doi:10.1073/pnas.0400087101.
32. Rea E, Lafleche J, Stalker S, Guarda BK, Shapiro H, Johnson I, et al. Duration and distance of exposure are important predictors of transmission among community contacts of Ontario SARS cases. Epidemiol Infect. 2007;135(6):914–21. doi:10.1017/S0950268806007771.
33. Holme P, Masuda N. The basic reproduction number as a predictor for epidemic outbreaks in temporal networks. PLoS One. 2015;10(3):e0120567. doi:10.1371/journal.pone.0120567.
34. Henry CJ, Koopman JS. Strong influence of behavioral dynamics on the ability of testing and treating HIV to stop transmission. Sci Reports. 2015;5:9467. doi:10.1038/srep09467.
35. Stehlé J, Voirin N, Barrat A, Cattuto C, Colizza V, Isella L, et al. Simulation of an SEIR infectious disease model on the dynamic contact network of conference attendees. BMC Med. 2011;9:87. doi:10.1186/1741-7015-9-87. 36. Smieszek T, Fiebig L, Scholz RW. Models of epidemics: when contact
repetition and clustering should be included. Theor Biol Med Model. 2009;6:11. doi:10.1186/1742-4682-6-11.
37. Melegaro A, Jit M, Gay N, Zagheni E, Edmunds WJ. What types of contacts are important for the spread of infections?: Using contact survey data to explore European mixing patterns. Epidemics. 2011;3(3-4):143–51. doi:10.1016/j.epidem.2011.04.001.
38. Goeyvaerts N, Hens N, Ogunjimi B, Aerts M, Shkedy Z, Van Damme P, Beutels P. Estimating infectious disease parameters from data on social contacts and serological status. R Stat Soc C. 2010;59:255–77. 39. Pujol JM, Eisenberg JE, Haas CN, Koopman JS. The effect of ongoing
exposure dynamics in dose response relationships. PLOS Comp Biol. 2009;5(6):e1000399. doi:10.1371/journal.pcbi.1000399.
40. Fournet J, Barrat A. Contact patterns among high school students. PLoS One. 2014;9(9):e107878. doi:10.1371/journal.pone.0107878.
41. Voirin N, Payet C, Barrat A, Cattuto C, Khanafer N, Regis C, et al. Combining high-resolution contact data with virological data to investigate influenza transmission in a tertiary care hospital. Infect Control Hosp Epidemiol. 2015;36(3):254–60. doi:10.1017/ice.2014.53.
42. Obadia T, Silhol R, Opatowski L, Temime L, Legrand J, Thiebaut AC, et al. Detailed contact data and the dissemination of Staphylococcus aureus in hospitals. PLoS Comp Biol. 2015;11(3):e1004170. doi:10.1371/journal.pcbi. 1004170.
43. Kretzschmar M, Teunis PF, Pebody RG. Incidence and reproduction numbers of pertussis: estimates from serological and social contact data in five European countries. PLoS Med. 2010;7(6):e1000291. doi:10.1371/journal. pmed.1000291.
• We accept pre-submission inquiries
• Our selector tool helps you to find the most relevant journal • We provide round the clock customer support
• Convenient online submission • Thorough peer review
• Inclusion in PubMed and all major indexing services • Maximum visibility for your research
Submit your manuscript at www.biomedcentral.com/submit