HAL Id: hal-02934942
https://hal.archives-ouvertes.fr/hal-02934942
Submitted on 9 Sep 2020
HAL is a multi-disciplinary open access
archive for the deposit and dissemination of
sci-entific research documents, whether they are
pub-lished or not. The documents may come from
teaching and research institutions in France or
abroad, or from public or private research centers.
L’archive ouverte pluridisciplinaire HAL, est
destinée au dépôt et à la diffusion de documents
scientifiques de niveau recherche, publiés ou non,
émanant des établissements d’enseignement et de
recherche français ou étrangers, des laboratoires
publics ou privés.
Azza Hadj Youssef, Jiawei Zhang, Andreas Dörfler, Gitanjali Kolhatkar,
Alexandre Merlen, Andreas Ruediger
To cite this version:
Azza Hadj Youssef, Jiawei Zhang, Andreas Dörfler, Gitanjali Kolhatkar, Alexandre Merlen, et al..
Topography-induced variations of localized surface plasmon resonance in tip-enhanced Raman
con-figuration. Optics Express, Optical Society of America - OSA Publishing, 2020, 28 (9), pp.14161.
�10.1364/OE.389565�. �hal-02934942�
Topography-induced variations of localized
surface plasmon resonance in tip-enhanced
Raman configuration
A
ZZAH
ADJY
OUSSEF,
1J
IAWEIZ
HANG,
1A
NDREASD
ÖRFLER,
1G
ITANJALIK
OLHATKAR,
2A
LEXANDREM
ERLEN,
3 ANDA
NDREASR
UEDIGER1,*1Institut National de la Recherche Scientifique- Énergie, Matériaux, Télécommunications, 1650 Boulevard Lionel-Boulet, J3X 1S2, Varennes, Québec, Canada
2Nanoelectronics, Faculty of Engineering, Kiel University, 24143 Kiel, Germany
3IM2NP, UMR CNRS 7334, Aix Marseille Université et Université de Toulon, Site de l’Université de Toulon, 83957 La Garde Cedex, France
Abstract: We report on topography-induced changes of the localized surface plasmon reso-nance (LSPR) enhanced luminescence of gold tip on SrTiO3nanostructures with apertureless scanning near-field optical microscopy (aSNOM) in tip-enhanced Raman spectroscopy (TERS) configuration. Our experimental and simulated results indicate that the averaged refractive index of the dielectric environment of the tip apex containing both air and SrTiO3in variable volume ratios, is dependent on the topography of the sample. This reveals that the local topography has to be taken into consideration as an additional contribution to the position of the LSPR.
© 2020 Optical Society of America under the terms of theOSA Open Access Publishing Agreement 1. Introduction
With the rapid growth in the field of nano-technology, there has been an increasing need for optical imaging techniques capable of investigating the material properties with a spatial resolution in the nanometer range.[1–3] Conventional spectroscopy techniques such as confocal Raman and infrared spectroscopy are limited by the diffraction limit to a couple hundred nanometers.[4,5] In order to overcome this limitation, techniques such as apertureless scanning near-field optical microscopy (aSNOM) were developed.[6] aSNOM combines the high spatial resolution of conventional scanning probe microscopy (SPM) with the high sensitivity of surface enhanced optical analysis.[7,8]
In our previous work, we used aSNOM to image changes in average refractive index of a variety of materials at the nanoscale. These studies were performed with a plasmonic gold tip in TERS configuration.[9–11] In this configuration, a laser beam of specific wavelength was focused at the apex of a gold tip, which in turn exhibited a detectable signal of its own. This tip signal is the result of two contributions. The first contribution is the luminescence of the gold tip, which is an intrinsic property that can be attributed to the gold inter-band d-sp transitions. [8,12,13] This gold luminescence has a broad feature extending to high wavenumbers, broad enough to be considered locally flat within the spectral range of interest. The second contribution is the LSPR that results from a large number of free electrons oscillating collectively at the tip apex following its excitation by the incident laser.[12] Compared to the gold luminescence curve, the LSPR curve is a narrower Lorentzian curve, which enhances the gold luminescence and leads to LSPR enhanced gold tip luminescence, the tip signal that we detect. It is well-established that the plasmon resonance is highly sensitive to changes in its surrounding environment. [14] For dispersed noble metal nanoparticles, the LSPR is used for refractive index measurements of liquids.[15–17] Moreover, previous work has shown that the position of the LSPR maximum
#389565 https://doi.org/10.1364/OE.389565
depends on several parameters such as the tip aspect ratio or crystallinity.[12] In addition, in the spectral range under consideration, the LSPR position is linked to the average permittivity of the environment at the very vicinity of the tip apex. [11,18,19] Imaging the LSPR position allows the study of changes in optical properties of materials at the nanoscale that are correlated with changes in the dielectric properties (ε) of the materials, which translates to changes in refractive index (n). [20,21] While our previous studies have shown that the LSPR shift can be exploited to image changes in refractive index of a material, they also suggested an influence of the topography, which remained unexplained. [9] As topography has previously been demonstrated to provide crucial contributions to the interpretation of scanning probe data e.g. in the case of piezoresponse force microscopy, [22] understanding its effect in refractive index imaging is crucial to avoid any misinterpretation of the results.
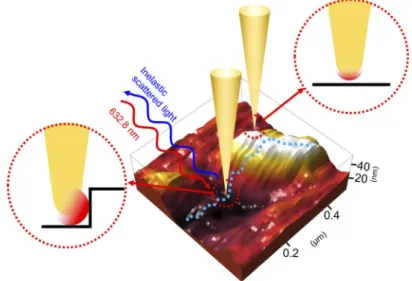
To assess this topography influence, we image the LSPR position on chemically homogeneous strontium titanate (SrTiO3) nanostructures deposited on platinized MgO (100) substrate. These measurements are performed using a gold tip via aSNOM in TERS configuration as shown in Fig.1. We chose SrTiO3as sample system as its bulk structure is Raman-silent due to its symmetry (Pm¯3m). [23] The absence of Raman features ensures that only the LSPR position is measured, while the nanostructures present topography changes strong enough to induce a shift in the enhanced luminescence. By mapping the LSPR position over the nanostructures, we observe a topography influence which is in good agreement with numerical simulations. These results confirm the importance of considering the topography in the data analysis of refractive index imaging. Furthermore, as the LSPR position defines the spectral range that is enhanced in TERS, this study shows that topography changes will also impact the Raman peaks that are amplified. This could lead to changes in Raman peak intensities that are only due to topography effects and not to structural changes of the material.
Fig. 1. 3D representation of the displacement of the gold tip during the mapping of the
LSPR position on SrTiO3nanostructures by aSNOM in TERS configuration. 2. Experimental section
2.1. Sample preparation
The 15 nm thick SrTiO3 nanostructures were grown on (100) platinized magnesium oxide substrates (Pt/MgO (100)) by on-axis radio-frequency (RF)-magnetron sputtering (SPT310,
Plasmionique Inc.) using a polycrystalline SrTiO3ceramic disc (2.54 cm diameter and 0.317 cm thickness) as the sputtering target. The deposition was performed at 650°C with an optimized process gas of argon (Ar) and oxygen (O2) [oxygen partial pressure, PO= O2/ (Ar + O2) = 30%] and the operating pressure was maintained at 40 mTorr during the deposition for an RF power of 15 W. The quality of the SrTiO3 thin films obtained under these conditions is reported elsewhere.[24]
2.2. Structural characterization
X-ray diffraction (XRD) was carried out with Panalytical X’Pert pro diffractometer equipped with a Cu K1source (λ = 1.5406 ). The diffractogram was recorded in the Grazing-incidence configuration (2θ mode) from 20 to 70°.
2.3. Optical characterization
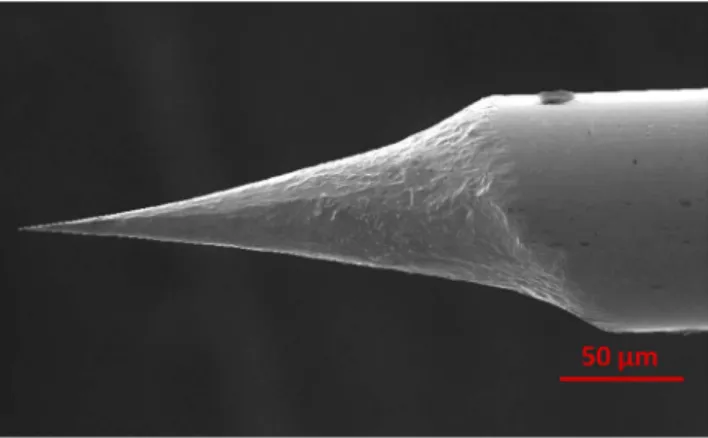
The LSPR mappings were conducted with an AIST-NT OmegaScope 1000 coupled with a Nanofinder 30 Raman spectrometer and a thermoelectrically cooled CCD detector (Andor iDUS) as well as a TEM 00 cw He-Ne laser (632.8 nm). Gold tips were fabricated by electrochemical etching of Au wires (Goodfellow, 99.99%, diameter 125 µm). The Au wire was immersed approximately 1 mm into 37% HCl solution in the center of an Au ring electrode. A 30 µs pulsed voltage of 4.5 V peak to peak with a + 0.5 V offset was applied to the tip at a 3 kHz frequency. The process terminated when the meniscus of the etching solution dropped and thus produced smooth tips with radii of curvature down to 10 nm. Figure2shows the SEM image of a typical gold tip produced by pulsed electrochemical etching. The tips were then glued onto a tuning fork in shear force configuration. The laser with 350 µW power was focused at the apex of the tip through a 0.7 NA Mitutoyo MPlan Apo 100× objective which was tilted at 65◦. The tip-sample distance was maintained constant at ∼1 nm in amplitude-controlled feedback.
Fig. 2.Scanning electron microscopy (SEM) image of a typical gold tip produced by pulsed
electrochemical etching.
2.4. Numerical simulations
To determine the tip plasmon emission, numerical simulations of the absorption in the tip-sample system were performed by resolving Maxwell’s equations with the finite element method in COMSOL 5.4. The modeled system consisted of three different step-terrace configurations of SrTiO3surface where the tip-sample distance was adjusted to 1 nm.
3. Results and discussion
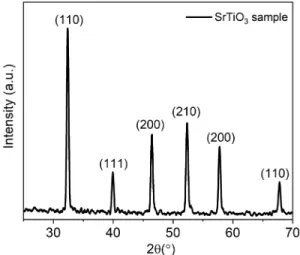
In order to verify the quality of the SrTiO3sample, grazing-incidence X-ray diffraction (GIXRD) was carried to characterize the crystallographic structure as can be seen in the Fig.3. The obtained X-ray pattern shows sharp peaks that indicate the formation of a high quality polycrystalline sample. The X-ray pattern of the studied sample exhibit the characteristic Bragg reflection peaks that are consistent with the single cubic crystallographic structure of SrTiO3(a = 3.905 Å) at room temperature. As for the composition, detailed XPS analysis with identical growth conditions could be obtained elsewhere [24].
Fig. 3.X-ray diffraction pattern of the 15 nm thick SrTiO3sample.
In the spectral range of 480–800 nm, a linear approximation of the permittivity of gold as a function of the wavelength given in ref 13 can be expressed by:
εr= −0.07λ + 32 (1)
where εris the real part of the permittivity of gold and λ the wavelength in nm. The permittivity is in turn correlated to the averaged refractive index of the surrounding environment at the apex of the tip as follows:
εr= − 2 n2 (2)
where n is the averaged refractive index of the surrounding medium.[9,19]
Thus, changes in averaged refractive index can be monitored using the LSPR position of the enhanced gold tip luminescence.
We previously reported on the material influence on the averaged refractive index of the environment at the very vicinity of the tip apex.[9] When the tip is on top of a material with a refractive index n1, the averaged refractive index is a combination of the refractive index of air and n1, which differs from the averaged refractive index obtained when the tip is on top of a different material with a refractive index n2. In our current work, we report on a topography influence. It is noteworthy that in most cases, both effects are likely contributing at the same time, i.e. for the mapping of an inhomogeneous and rough sample surface.
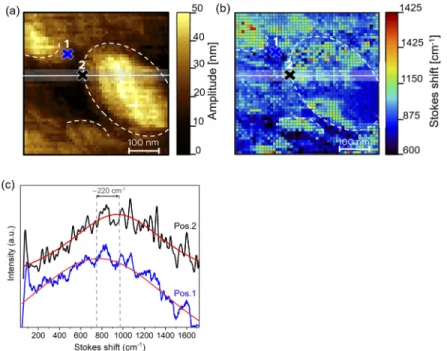
The topography of the studied sample is depicted in Fig.4(a) and monitored simultaneously with the optical properties. It shows the formation of SrTiO3nanostructures with ellipsoidal shape on platinized MgO substrate. The deposited nanostructures have typical diameters of ∼200 nm and layered structures, thus providing steps with variable heights. As for the coverage rate, the nominal film thickness (equivalent thickness if the film was dense) is 15 nm, so that
from the topography of up to 50 nm for nanostructures, we estimate a surface coverage fraction of approximately 50%. Figure4(b) depicts the high resolution map of the LSPR position of the enhanced gold luminescence of the corresponding surface topography with a spatial resolution in the order of 10 nm, which is way below the diffraction limit. The obtained map is acquired by recording a spectrum of the LSPR enhanced gold luminescence at each pixel and fitting it with a Lorentzian equation. The gold tip exhibits a detectable signal which corresponds to its luminescence enhanced by the LSPR at its apex. The LSPR position corresponds to the wavenumber at which this Lorentzian shaped curve reaches its maximum. The LSPR position is linked to the effective permittivity of the surrounding medium, composed of air and SrTiO3in our case. Figure4(c) shows the typical gold tip signal fitted with Lorentzian equation at two different positions of the sample: when the tip moves from a planar surface (dark blue region Pos.1) to a step feature (light blue region, Pos. 2) as illustrated in Fig.4(b). We observe a redshift of the LSPR position when the tip moves from position 1 to position 2 due to the change in the permittivity distribution surrounding the gold tip. In addition, we notice a strong correlation between the sample topography and the LSPR position. These changes cannot be explained by a change in the material composition. The distribution of the LSPR position varies with the topography and is highly dependent on the tip environment and particularly on the air to SrTiO3 volume fraction at the very vicinity of the tip apex.
Fig. 4.a) 500 × 500 nm2topography image of the SrTiO3nanostructures, b) High resolution
map of LSPR position on SrTiO3 nanostructures deposited on platinized substrate. The
white lines correspond to the areas over which the profiles were measured. The exposure time for measuring each spectrum was 1 s and c) Typical gold tip signal spectra acquired on a planar surface (Pos. 1) and at a step feature (Pos. 2) and fitted with Lorentzian function (red line). The value of 220 cm−1corresponds to the difference in the center positions of the
Lorentzian functions obtained by a least-square fit.
Previous work showed that the LSPR position changes with the average refractive index of the surrounding medium. In our experiments, the gold tip is placed above the sample surface with a constant tip-sample distance of ∼1 nm. Thus, instead of being completely immersed in the sample (as it is the case for nanoparticles in liquids), the luminescence of the tip apex is
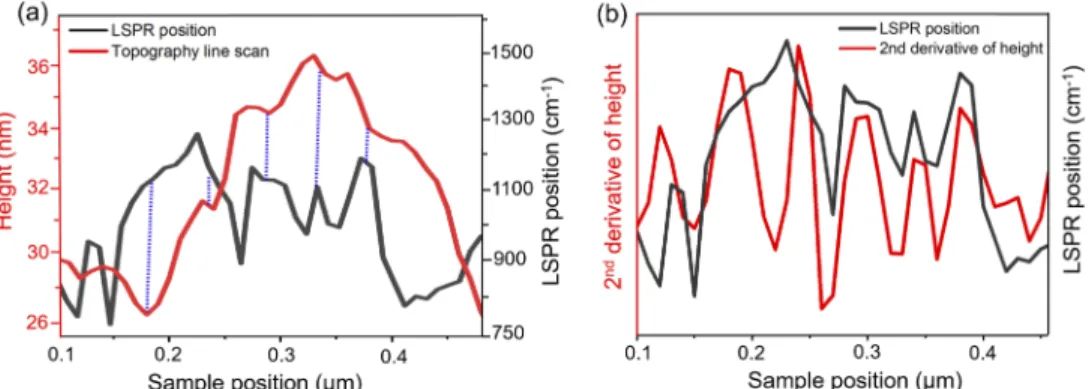
affected not only by the material at the apex, but in addition by the surrounding medium, which is air in our case. Consequently, changes in topography will induce changes in the average medium due to a variation of the fraction of SrTiO3surrounding the gold tip. To confirm our hypothesis, we investigated the changes in topography along a line simultaneously with the shifts in LSPR position (Fig.4(a-b), white lines). This region was chosen as it depicts relatively large step features that also extend vertically, thereby allowing us to average over four horizontal lines and improve the signal to noise ratio (Fig.4(b), white areas surrounding the white lines). Figure5illustrates the effect of topography variation on the LSPR position. We can see from the topography that the SrTiO3nanostructure depicts some step-terraces features. When the tip reaches a step, the LSPR position shifts to higher wavenumbers. This can be explained in the sense that when the tip is scanning a chemically and structurally homogeneous material depicting some topography features, different positions on the sample surface may yield a different volume fraction of the sample material at the very vicinity of the tip. This variation leads to a change in averaged refractive index surrounding the tip apex, thus leading to shifts that we observe experimentally in Fig.5(a). To highlight the correlation between the topography and the LSPR shift, we compared the LSPR position variations to the second derivative of the height of the analyzed topography as depicted in Fig.5(b). The figure indicates that the concave shaped steps of the topography is governing the variation of the LSPR position, thus enhance it shift to higher wavenumbers.
Fig. 5.(a) Quantitative measurement of the anti-correlation between the variation of the
LSPR position and the topography changes. The blue lines show the evolution of the LSPR position when the topography of the SrTiO3nanostructures shows stepped morphology, (b)
Correlation between the variation of the LSPR position and the second derivative of the height.
To further validate the dependence the LSPR position on the topography, we construct a finite element model of the tip contact area. Using this model, we compute absorption spectra and their respective peak shifts for different topographies. To calculate the absorption spectra, an excitation laser is focused on the tip and varied in wavelength. The calculation is done using the COMSOL Multiphysics electric field solver for the time-harmonic wave equation. A semispherical tip with a diameter of 20 nm and a step height of 10 nm is chosen in accordance to step heights obtained from the experimentally measured topography. The exact shape of the steps remains however unknown due to the tip-surface convolution. In the simulation, we compare shifts of tip absorption peaks, which are indicative of the shift of LSPR position.[9,19,25] The absorption at the apex of the gold tip was simulated for three configurations, the tip on top of a planar surface, at a rectangular shaped step and at a concave shaped step. As the SrTiO3 to air volume ratio increases from configuration (a) to (c), the simulation spectra show a shift to higher wavenumber (Fig.6), consistently with experimental results. The fact that the numerical simulation predicts
even larger LSPR shifts than those experimentally determined is attributed to idealized conditions in the simulation, especially with respect to the shape of both tip and surface. These results confirm that the LSPR position shift observed on our SrTiO3 nanostructures is indeed due to a topography effect and not to a change in the material composition. This further shows that the topography of the sample has to be taken into account when performing refractive index mapping. Moreover, it should not be neglected in TERS analysis as changes in topography could induce a change in the Raman peak intensity through a variation in the enhanced spectral range.
Fig. 6.Simulated absorption spectrum shifts due to surface profile.
4. Conclusions
In summary, we report on the effect of topography changes while mapping the LSPR of enhanced gold tip luminescence in TERS configuration across chemically and structurally homogeneous SrTiO3nanostructures with a high spatial resolution in the order of 10 nm. The obtained LSPR position strongly correlates with the topography of the sample, which we attribute to variations in the volume fraction of material interacting with the optical near field. Numerical simulations provide concurring trends, somewhat overestimating the expected LSPR shifts. Our work highlights the importance of considering the sample topography in the interpretation of optical near field data while performing near-field refractive index mapping and TERS experiments for both qualitative and quantitative purposes.
Funding
Natural Sciences and Engineering Research Council of Canada (506289-2017, 506953-17, RGPIN-2014-05024); Canada Foundation for Innovation.
Acknowledgements
A.H.Y. and J.Z. contributed equally to this work. G.K. is thankful for a postdoctoral fellowship from the Alexander von Humboldt Foundation. And we are grateful for the map analysis software developed by Julien Plathier.
Disclosures
References
1. G. Kang, M. Yang, M. S. Mattei, G. C. Schatz, and R. P. Van Duyne, “In Situ Nanoscale Redox Mapping Using Tip-Enhanced Raman Spectroscopy,”Nano Lett.19(3), 2106–2113 (2019).
2. D. M. Mittleman, “Twenty years of terahertz imaging [Invited],”Opt. Express26(8), 9417–9431 (2018).
3. G. Ducourthial, J. S. Affagard, M. Schmeltz, X. Solinas, M. Lopez-Poncelas, C. Bonod-Bidaud, R. Rubio-Amador, F. Ruggiero, J. M. Allain, E. Beaurepaire, and M. C. Schanne-Klein, “Monitoring dynamic collagen reorganization during skin stretching with fast polarization-resolved second harmonic generation imaging,”J. Biophotonics12(5),
e201800336 (2019).
4. K. Eberhardt, C. Stiebing, C. Matthaus, M. Schmitt, and J. Popp, “Advantages and limitations of Raman spectroscopy for molecular diagnostics: an update,”Expert Rev. Mol. Diagn.15(6), 773–787 (2015).
5. D. K. Gramotnev and S. I. Bozhevolnyi, “Plasmonics beyond the diffraction limit,”Nat. Photonics4(2), 83–91 (2010).
6. D. V. Kazantsev, E. V. Kuznetsov, S. V. Timofeev, A. V. Shelaev, and E. A. Kazantseva, “Apertureless near-field optical microscopy,”Phys.-Usp.60(3), 259–275 (2017).
7. Y. Baba, I. Matsuya, M. Nishikawa, and T. Ishibashi, “Measurement of polarization properties of fifth harmonic signals in apertureless-type scanning near-field optical microscopy,”Jpn. J. Appl. Phys.57(9S2), 09TC04 (2018).
8. A. Merlen, J. Plathier, and A. Ruediger, “A near field optical image of a gold surface: a luminescence study,”Phys. Chem. Chem. Phys.17(33), 21176–21181 (2015).
9. G. Kolhatkar, A. Boucherif, C. Dab, S. Fafard, V. Aimez, R. Ares, and A. Ruediger, “Composition variation in Al-based dilute nitride alloys using apertureless scanning near-field optical microscopy,”Phys. Chem. Chem. Phys. 18(44), 30546–30553 (2016).
10. M. Nicklaus, G. Kolhatkar, J. Plathier, C. Dab, and A. Ruediger, “Direct Observation of Core-Shell Structures in Individual Lead Titanate Ferroelectric Nanostructures by Tip-Enhanced Refractive Index Mapping,”Adv. Funct. Mater.29(2), 1806770 (2019).
11. G. Kolhatkar, J. Plathier, and A. Ruediger, “Nanoscale investigation of materials, chemical reactions, and biological systems by tip enhanced Raman spectroscopy – a review,”J. Mater. Chem. C6(6), 1307–1319 (2018).
12. G. Kolhatkar, J. Plathier, A. Pignolet, and A. Ruediger, “Effect of the gold crystallinity on the enhanced luminescence signal of scanning probe tips in apertureless near-field optical microscopy,”Opt. Express25(21), 25929–25937
(2017).
13. J. Zheng, C. Zhou, M. Yu, and J. Liu, “Different sized luminescent gold nanoparticles,”Nanoscale4(14), 4073–4083
(2012).
14. B. Sepúlveda, P. C. Angelomé, L. M. Lechuga, and L. M. Liz-Marzán, “LSPR-based nanobiosensors,”Nano Today 4(3), 244–251 (2009).
15. H. Lin, C. Huang, G. Cheng, N. Chen, and H. Chui, “Tapered optical fiber sensor based on localized surface plasmon resonance,”Opt. Express20(19), 21693–21701 (2012).
16. M. Potara, A. M. Gabudean, and S. Astilean, “Solution-phase, dual LSPR-SERS plasmonic sensors of high sensitivity and stability based on chitosan-coated anisotropic silver nanoparticles,”J. Mater. Chem.21(11), 3625 (2011).
17. P. Chen and B. Liedberg, “Curvature of the localized surface plasmon resonance peak,”Anal. Chem.86(15),
7399–7405 (2014).
18. J. A. Faucheaux, A. L. Stanton, and P. K. Jain, “Plasmon Resonances of Semiconductor Nanocrystals: Physical Principles and New Opportunities,”J. Phys. Chem. Lett.5(6), 976–985 (2014).
19. P. R. West, S. Ishii, G. V. Naik, N. K. Emani, V. M. Shalaev, and A. Boltasseva, “Searching for better plasmonic materials,”Laser Photonics Rev.4(6), 795–808 (2010).
20. E. Ringe, J. M. McMahon, K. Sohn, C. Cobley, Y. Xia, J. Huang, G. C. Schatz, L. D. Marks, and R. P. Van Duyne, “Unraveling the Effects of Size, Composition, and Substrate on the Localized Surface Plasmon Resonance Frequencies of Gold and Silver Nanocubes: A Systematic Single-Particle Approach,”J. Phys. Chem. C114(29), 12511–12516
(2010).
21. A. Agharazy Dormeny, P. Abedini Sohi, and M. Kahrizi, “Design and simulation of a refractive index sensor based on SPR and LSPR using gold nanostructures,”Results Phys.16, 102869 (2020).
22. F. Peter, A. Rüdiger, and R. Waser, “Mechanical crosstalk between vertical and lateral piezoresponse force microscopy,”
Rev. Sci. Instrum.77(3), 036103 (2006).
23. W. G. Nilsen and J. G. Skinner, “Raman Spectrum of Strontium Titanate,”J. Chem. Phys.48(5), 2240–2248 (1968).
24. A. Hadj Youssef, F. Ambriz Vargas, I. Amaechi, A. Sarkissian, A. Merlen, R. Thomas, and A. Ruediger, “Impact of negative oxygen ions on the deposition processes of RF-magnetron sputtered SrTiO3thin films,”Thin Solid Films 661, 23–31 (2018).
25. S. Vedraine, R. Hou, P. R. Norton, and F. Lagugne-Labarthet, “On the absorption and electromagnetic field spectral shifts in plasmonic nanotriangle arrays,”Opt. Express22(11), 13308–13313 (2014).