HAL Id: hal-01889129
https://hal.archives-ouvertes.fr/hal-01889129
Submitted on 5 Oct 2018
HAL is a multi-disciplinary open access archive for the deposit and dissemination of sci-entific research documents, whether they are pub-lished or not. The documents may come from teaching and research institutions in France or abroad, or from public or private research centers.
L’archive ouverte pluridisciplinaire HAL, est destinée au dépôt et à la diffusion de documents scientifiques de niveau recherche, publiés ou non, émanant des établissements d’enseignement et de recherche français ou étrangers, des laboratoires publics ou privés.
the podzolization of soils from the Amazon region using
two analytical spectroscopy techniques
Amanda Tadini, Gustavo Nicolodelli, Bruno Marangoni, Stéphane Mounier,
Celia Montes, Débora M.B.P. Milori
To cite this version:
Amanda Tadini, Gustavo Nicolodelli, Bruno Marangoni, Stéphane Mounier, Celia Montes, et al.. Evaluation of the roles of metals and humic fractions in the podzolization of soils from the Amazon region using two analytical spectroscopy techniques. Microchemical Journal, Elsevier, 2019, 144, pp.454-460. �10.1016/j.microc.2018.10.009�. �hal-01889129�
Evaluation of the roles of metals and humic fractions in the podzolization of soils from the Amazon region using two analytical spectroscopy techniques
Amanda M. Tadini(a,b,d)*, Gustavo Nicolodelli(a,c), Bruno S. Marangoni(c), Stephane
Mounier (d), Célia R. Montes (e), Débora M. B. P. Milori(a)
(a) Embrapa Instrumentation, São Carlos, SP, Brazil
(b) Institute of Chemistry of São Carlos, University of São Paulo, São Carlos, SP, Brazil (c) Institute of Physics, Federal University of Mato Grosso do Sul, P.O. Box 549, 79070-900 Campo Grande, MS, Brazil
(d) Laboratoire PROTEE, EA3819, Université de Toulon, CS 60584, 83041 Toulon CEDEX 9, France
(e) Centro de Energia Nuclear na Agricultura e Núcleo de Pesquisa em Geoquímica e Geofísica da Litosfera, Universidade de São Paulo, Piracicaba, SP, Brazil
*Corresponding author. E-mail: [email protected]
1 2 3 4 5 6 7 8 9 10 11 12 13 14 15 16 17 18 19 20 21 22 23 24 25 26 27 28 29 30 31 32 33 34 35 36 37 38 39 40 41 42 43 44 45 46 47 48 49 50 51 52 53 54 55 56
ABSTRACT
Soil organic matter (SOM) plays an important role in environmental sustainability, since it is involved in carbon and nutrient cycling. Consequently, it is a key factor to consider in studies concerning global climate change and agronomy. Among the main components of SOM are humic substances (HS), which are divided, according to their solubility, into humic acid (HA), fulvic acid (FA), and humin (HU) fractions. Study of the chemical properties of this organic matter is important for understanding the biogeochemical processes occurring in the soil. The aim of this work was to determine the metals iron (Fe) and aluminum (Al), using flame atomic absorption spectrometry (FAAS) and laser-induced breakdown spectroscopy (LIBS), in order to elucidate the role of organic matter in the transport of these metals in Amazonian soils. The results showed that FA was important for Al, while the HA fraction was more selective towards Fe. The translocations of these metals to deeper profiles in two different soils involved either young and less humified organic matter, or older organic matter with a low degree of humification. Therefore, these two humic fractions were involved in the process of soil podzolization, with FA having a predominant role in the transport of Al, while HA was mainly responsible for the transport of Fe.
Keywords: LIBS, FAAS, Organic matter, Amazon. 62 63 64 65 66 67 68 69 70 71 72 73 74 75 76 77 78 79 80 81 82 83 84 85 86 87 88 89 90 91 92 93 94 95 96 97 98 99 100 101 102 103 104 105 106 107 108 109 110 111 112 113 114 115
1. Introduction
The Amazon forest provides important services to humanity and the environment, including high biodiversity, climate regulation, carbon sequestration, and regulation of water and nutrient cycles. Soils play crucial roles in most of the processes that occur on the planet, due to their participation in the main biogeochemical cycles [1]. These involve pedogenetic processes transforming rocks and sediments, whose characteristics are influenced by combinations of soil formation factors such as the source material, climate, microorganisms, and time [2].
In the Amazon, Spodosols develop over time from clay soil or sedimentary formations. Organometallic iron (Fe) and aluminum (Al) oxides present in horizons A and E are transported to deeper soil layers, where they accumulate and give rise to horizons rich in organic matter and organometallic species [3]. Hence, organic matter in these soils plays a key role in environmental sustainability, since it is related to carbon and nutrient cycling, and is a crucial factor to consider in studies in the fields of global climate change and agronomy. Humic substances (HS) are among the main components of SOM and can be classified, according to their solubility, into humic acid (HA), fulvic acid (FA), and humin (HU) fractions [4].
Determination of the chemical properties of the organic matter, as well as its interaction with metallic species, is essential for understanding the main processes that occur in the soil. The techniques that have been described for this purpose include flame atomic absorption spectrometry (FAAS) and, more recently, laser-induced breakdown spectroscopy (LIBS). The latter is an attractive technique due to its high sensitivity and precision, as well as the requirement for only minimal sample preparation, making it attractive for use in applications that comply with the concepts of Green Chemistry [5]. This technique is a type of atomic emission spectrometry that uses the generation of plasma by means of high power pulses, resulting in ablation of a small portion of the sample. This material dissociates into ions and excited atoms, emitting a continuum of radiation that enables the measurement of atomic/ionic emission lines and identification of the main elements present in the sample [6].
The main advantages of LIBS are the potential for simultaneous multi-element soil analysis with minimal sample preparation, high processing speed, and low cost of analysis, compared to traditional methods. The LIBS technique has been evaluated as an alternative method for the quantification of contaminants, macro/micronutrients, and carbon (C) in soils [7-9]. It has been used in investigations of texture, pH, and macro-
119 120 121 122 123 124 125 126 127 128 129 130 131 132 133 134 135 136 137 138 139 140 141 142 143 144 145 146 147 148 149 150 151 152 153 154 155 156 157 158 159 160 161 162 163 164 165 166 167 168 169 170 171 172 173 174
and micronutrients in fertilizers and soil organominerals [10-12]. However, although LIBS has been used for soil analysis, it has not previously been employed to investigate the chemical fractions present in the soil.
The aim of this study was to use the FAAS and LIBS techniques to quantify the metals Fe and Al in Amazonian Spodosols. The metals were quantified in whole soil samples and in the different humic fractions (HA, FA, and HU), in order to understand the role of the SOM in the transport of these metals during the podzolization process.
2. Materials and Methods
2.1. Study area
The soil samples (two Spodosols, denoted P1 and P4) were obtained from a site located in the north of the municipality of Barcelos, near the Demeni River (0°15’18’’N; 62°46’36’’W) in the middle watershed of the Negro River region in the Amazon plains of Brazil. The regional geology is characterized by sediments of the Içá formation. Sample P1 was from a permanently waterlogged podzol covered by herbaceous meadow of scrubs and grass, locally known as “campina”. Sample P4 was from a well-drained podzol under rainforest vegetation, with no influence of groundwater. Further details of the study area can be found in Tadini et al. [13].
2.2. Preparation of the samples for analysis
The procedures adopted for sampling, preservation, and preparation of the soils followed the recommendations of official methods [14-16]. Extraction and purification of the humic acid (HA), fulvic acid (FA), and humin (HU) fractions followed the procedures proposed by the International Humic Substances Society (IHSS), as used by Rice and MacCarthy [17], and Swift [18].
2.3. Flame atomic absorption spectrometry (FAAS)
Sample decomposition was performed using 100 mg portions of the soils and the humic fractions (HA, FA, and HU), following the recommendations of the United States Environmental Protection Agency (Method 3052) [19]. Quantification of Fe and Al was performed using a PerkinElmer PinAAcle 900T flame atomic absorption spectrometer. Calibration curves were constructed using metal standard solutions and a blank (water) prepared in 1.0 mol-1 HCl (comparable to the sample preparation).
180 181 182 183 184 185 186 187 188 189 190 191 192 193 194 195 196 197 198 199 200 201 202 203 204 205 206 207 208 209 210 211 212 213 214 215 216 217 218 219 220 221 222 223 224 225 226 227 228 229 230 231 232 233
2.4. Laser-induced breakdown spectroscopy (LIBS)
The LIBS system employed a Nd:YAG laser operating at 532 nm in the visible (VIS) region . The VIS pulse had a maximum energy of 180 mJ, a width of 4 ns, and was generated by a Quantel Brilliant Q-Switched Nd:YAG laser coupled to a second harmonic generator module. . An ARYELLE 400-Butterfly system was used to detect and select the wavelengths. The spectrometer was operated in the spectral range 175-330 nm, with resolution of 13-24 pm, and was equipped with an intensified charge-coupled device (ICCD) camera (1024 × 1024 pixels). The beam from the lasers was directed and focused on the sample by means of dichroic mirrors at appropriate wavelength. Two lenses were placed between the sample and the tip of the fiber, for efficient collection of the emitted plasma. The sample support was placed in a micro-controlled x-y stage to enable easy and fast scanning by the laser beam impinging on it. An eight-channel pulse generator (Model 9618, Quantum Composers) was used to synchronize the delay time between pulse and the detection acquisition during the experiments.
Acquisition of the LIBS spectra was performed using a 532 nm visible laser beam with energy of 30 mJ and accumulation of 5 laser shots. The beam was focused and aligned to hit the sample in overlapping laser shots mode.. The gate width was set at 1.5 μs and the gate time at 1.0μs. Each whole soil and humic fraction sample was submitted to 30 measurements performed in different positions.
The outlier spectra were excluded using a technique called Spectral Angle Mapper (SAM) [20], involving calculation of a normalized scalar product between the individual spectrum and the average spectrum, returning a value between -1 and 1. The closer the value is to 1, the greater the similarity between the spectra. The imposition of a limit below 1 enables the exclusion of spectra that differ from the average. The use of this procedure resulted in elimination of only around 2% of the spectra, indicative of good stability of the experimental system. Finally, an average spectrum was calculated for each sample.
2.4. Transitions identification
Identification of the Fe and Al transitions was performed using pixel correlation [11] and the NIST database [21]. Briefly, calculation was made of the linear Pearson correlation between the intensity of a specific pixel and the variation of the concentration. This process was repeated for all pixels in the spectrum. The reference
237 238 239 240 241 242 243 244 245 246 247 248 249 250 251 252 253 254 255 256 257 258 259 260 261 262 263 264 265 266 267 268 269 270 271 272 273 274 275 276 277 278 279 280 281 282 283 284 285 286 287 288 289 290 291 292
elemental concentration value was measured by FAAS. In this way, the pixels with higher correlation values were more likely to be representative of a transition line. This analysis assisted in eliminating saturated transitions and those with interference. As a result, three transition lines were selected for each metal: Al I (237.20 nm), Al II (265.25 nm), Al (281.62 nm), Fe I (248.33 nm), Fe II (273.95 nm), and Fe (302.05 and 302.06 nm). The last Fe transition is a superposition of two Fe lines, so the integrated area of the entire region was used as a single intensity value.
2.5. Multivariate calibration
The LIBS intensity was linearly correlated with the Al and Fe concentrations of the samples, resulting in a calibration curve. The LIBS intensity was obtained by means of a multivariate calculation involving the areas for each transition and the area for the background, as shown in Equation 1:
(1)
where Ai is the area of each atomic transition, C is the background area, and αi and β are
positive parameters fitted to the best linear correlation. The Ai values were calculated by
summing the intensities of pixels inside a transition. The value of C was obtained as the sum of the intensities in a region with no apparent transitions.
3. Results and Discussion
Table 1 shows the values for carbon, Fe, and Al in the whole soil samples and in the humic fractions extracted from the Amazonian Spodosols, obtained using FAAS.
298 299 300 301 302 303 304 305 306 307 308 309 310 311 312 313 314 315 316 317 318 319 320 321 322 323 324 325 326 327 328 329 330 331 332 333 334 335 336 337 338 339 340 341 342 343 344 345 346 347 348 349 350 351
Table 1. Concentrations of carbon (%) and the metals Fe and Al (g/kg) in the whole soil samples and in the humic fractions (HA, FA, and HU) extracted from the Amazonian Spodosols.
Samples Carbon (%) Concentration of metals (g/kg)
Metals
Area Horizon Depth (cm) Soils HA FA HU Soils HA FA HU
A 0-15 22.5 ± 0.9 45 ± 3 18.2 ± 0.5 52.03 ± 0.08 1.20 ± 0.01 0.4 ± 0.2 0.07 ± 0.01 0.3 ± 0.1 A-E 15-30 1.01 ± 0.09 51 ± 1 26.9 ± 0.2 24.38 ± 0.01 0.95 ± 0.01 0.3 ± 0.1 * 0.2 ± 0.1 Bh 40-50 2.1 ± 0.2 56.2 ± 0.2 36.8 ± 0.8 36.67 ± 0.03 0.77 ± 0.01 0.3 ± 0.1 0.12 ± 0.01 0.2 ± 0.1 Bh-C 240 3.2 ± 0.2 46 ± 2 47.9 ± 0.1 * 6.44 ± 0.01 0.6 ± 0.2 * 0.4 ± 0.1 P1 C 350 1.2 ± 0.2 51 ± 3 38.7 ± 0.9 5.17 ± 0.00 2.13 ± 0.01 0.2 ± 0.1 0.07 ± 0.01 1.0 ± 0.2 A 0-20 3.9 ± 0.2 45.2 ± 0.3 34 ± 3 41.43 ± 0.07 2.29 ± 0.01 1.8 ± 0.5 0.2 ± 0.1 0.2 ± 0.1 A 20-30 3.5 ± 0.2 49.4 ± 0.01 21.6 ± 0.2 * 2.28 ± 0.01 1.9 ± 0.4 * 0.2 ± 0.1 A 30-40 0.89 ± 0.01 50 ± 2 10.8 ± 0.1 5.76 ± 0.02 2.60 ± 0.01 2.3 ± 0.3 * 0.3 ± 0.1 Bh 110-120 0.42 ± 0.02 50.0 ± 0.1 39.8 ± 0.6 * 1.81 ± 0.01 1.1 ± 0.2 * 0.4 ± 0.1 Bh 170-180 0.38 ± 0.01 52 ± 6 3.1 ± 0.0 5.33 ± 0.02 1.72 ± 0.01 1.4 ± 0.2 * 0.3 ± 0.1 Bh 370-380 0.48 ± 0.01 52.8 ± 0.3 32.8 ± 0.2 2.26 ± 0.01 2.49 ± 0.01 1.2 ± 0.6 * 0.4 ± 0.1 Fe P4 Bh 380-390 0.78 ± 0.01 54.5 ± 0.5 34.5 ± 0.3 * 1.66 ± 0.01 1.3 ± 0.2 * 0.3 ± 0.1 A 0-15 22.5 ± 0.9 45 ± 3 18.2 ± 0.5 52.03 ± 0.08 43 ± 1 * 16.8 ± 0.2 * A-E 15-30 1.01 ± 0.09 51 ± 1 26.9 ± 0.2 24.38 ± 0.01 39 ± 1 * 13.8 ± 0.5 * Bh 40-50 2.1 ± 0.2 56.2 ± 0.2 36.8 ± 0.8 36.67 ± 0.03 57 ± 1 * 8.8 ± 0.3 * Bh-C 240 3.2 ± 0.2 46 ± 2 47.9 ± 0.1 * 92 ± 1 * * * P1 C 350 1.2 ± 0.2 51 ± 3 38.7 ± 0.9 5.17 ± 0.00 52 ± 1 * 20.0 ± 0.1 5.0 ± 0.1 A 0-20 3.9 ± 0.2 45.2 ± 0.3 34 ± 3 41.43 ± 0.07 48 ± 1 6.4 ± 0.4 9.5 ± 0.1 * A 20-30 3.5 ± 0.2 49.4 ± 0.01 21.6 ± 0.2 * 47 ± 1 * 27.2 ± 0.2 * A 30-40 0.89 ± 0.01 50 ± 2 10.8 ± 0.1 5.76 ± 0.02 46 ± 1 * 17.5 ± 0.1 * Bh 110-120 0.42 ± 0.02 50.0 ± 0.1 39.8 ± 0.6 * 39 ± 1 * 13.7 ± 0.4 * Bh 170-180 0.38 ± 0.01 52 ± 6 3.1 ± 0.0 5.33 ± 0.02 49 ± 1 * 16.5 ± 0.3 * Bh 370-380 0.48 ± 0.01 52.8 ± 0.3 32.8 ± 0.2 2.26 ± 0.01 41 ± 1 * 20.5 ± 0.2 * Al P4 Bh 380-390 0.78 ± 0.01 54.5 ± 0.5 34.5 ± 0.3 * 51 ± 1 * 21 ± 1 *
P1: hydromorphic spodosol; P4: well drained spodosol; * below the detection limit of the calibration curve (%C = 0.04; Fe: 0.10 mg/kg and Al: 2.5 mg/kg). 355 356 357 358 359 360 361 362 363 364 365 366 367 368 369 370 371 372 373 374 375 376 377 378 379 380 381 382 383 384 385 386 387 388 389 390 391 392
The Al concentration profile showed an increase with greater depth in the horizons of soils P1 and P4 (Table 1). In the case of Fe, the highest values were found for the subsurface horizons (A and A-E) and the deep Bh horizons: Bh-C 240 (P1) and Bh 370-380 (P4). A possible explanation for this behavior was that in the case of the hydromorphic Spodosol (P1), there was mobilization of suspended organometallic complexes and metal oxides, controlled by the oscillating groundwater level. In flooded soils, anaerobic environments are created, with the organic matter acting as an electron receptor and enabling reduction of the macro- and micronutrients present [23, 24]. Hence, the results suggested that there was greater mobilization of the organometallic complexes and the reduced iron in soil P1, compared to the well-drained Spodosol (P4), with the precipitation of Fe and decreasing mobilization of the organometallic complexes along the profile. Consequently, there was the accumulation of Fe in horizons with greater amounts of organic matter, resulting in spodic Bh horizons in this system.
The results obtained in this study were in agreement with the findings of Ishida [25] and Santos [22] for a Latosol-Spodosol system in the Amazon region. It was reported that there was accumulation of Al and Fe in the Bh horizons, with the highest value obtained for Al. This accumulation was suggested to be due to translocation of the metals, especially Al, to the spodic Bh horizons in the form of organic complexes.
In previous work by Tadini et al. [13], involving the dating of these Amazonian Spodosols and determination of the humification indices, it was observed that soil P1 presented an accumulation of young organic material with a low degree of humification, which was displaced with depth, due to physical and chemical processes. The highest values for humification of the whole soil and for the humic acid fraction were obtained for the Bh-C horizon, at 240 cm. The data obtained in the present study (Table 1) showed that this horizon presented the highest concentrations of Fe and Al in the whole soil and the humic fractions (HA, FA, and HU).
The well-drained Spodosol (soil P4) showed the contribution of old and poorly humified organic matter in horizons Bh 170-180 and Bh 370-380. Therefore, the results indicated that the transfer of iron and aluminum to deeper profiles of soil P1 involved the participation of young and less humified organic matter. Transfer of the metals in soil P4 involved older organic matter with a low degree of humification, which could be attributed to the presence of more recalcitrant compounds derived from lignin [13].
These results indicated that the three humic fractions were involved in the
398 399 400 401 402 403 404 405 406 407 408 409 410 411 412 413 414 415 416 417 418 419 420 421 422 423 424 425 426 427 428 429 430 431 432 433 434 435 436 437 438 439 440 441 442 443 444 445 446 447 448 449 450 451
process of podzolization of the Amazonian Spodosols. The FA fraction played a predominant role in the transport of Al (8.8 to 27.2 g/kg), since this fraction had the highest amount of this metal in its structure, while the HA fraction was responsible for the transport of Fe (0.2 to 2.3 g/kg).
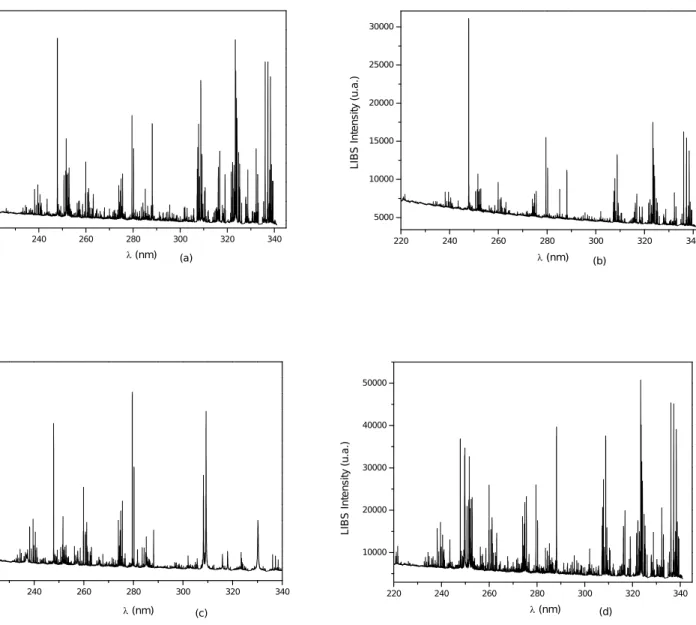
The LIBS technique was also used for analysis of the whole soil samples and the humic fractions extracted from the Amazonian Spodosols. Figure 1 shows typical LIBS spectra obtained for horizon A of the hydromorphic Spodosol (P1).
Figure 1. Typical LIBS spectra for the hydromorphic spodosol (P1 A 0-15 cm): (a) whole soil, (b) humic acids, (c) fulvic acids, and (d) humin.
220 240 260 280 300 320 340 10000 20000 30000 40000 50000 60000 LI B S In te nsi ty ( u. a. ) (nm) (a) 220 240 260 280 300 320 340 5000 10000 15000 20000 25000 30000 LI B S In te nsi ty ( u. a. ) (nm) (b) 220 240 260 280 300 320 340 10000 20000 30000 40000 50000 60000 70000 (nm) LI B S In te nsi ty ( u. a. ) (c) 220 240 260 280 300 320 340 10000 20000 30000 40000 50000 L IB S In te nsi ty ( u. a. ) (nm) (d) 455 456 457 458 459 460 461 462 463 464 465 466 467 468 469 470 471 472 473 474 475 476 477 478 479 480 481 482 483 484 485 486 487 488 489 490 491 492 493 494 495 496 497 498 499 500 501 502 503 504 505 506 507 508 509 510
After obtaining the LIBS spectra, the data for specific lines were treated in order to determine the concentrations of Fe and Al present in the whole soil and in the humic fractions. The lines selected were as follows: 248.32708 nm (Fe I), 273.95474 nm (Fe II), 302.04907 nm (Fe II), 265.2484 nm (Al I), 281.6185 nm (Al II), and 237.2070 nm (Al I). Three transitions were used for each metal, together with the background. A simple multivariate background analysis was used to obtain the LIBS intensity and correlate it with the concentration of Fe or Al.
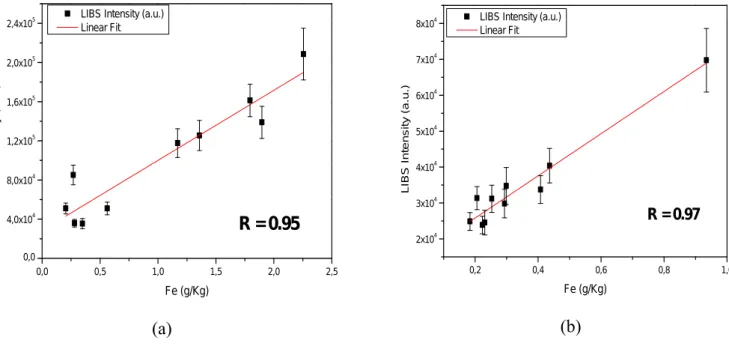
Figure 2 shows the graphs for the correlations between the LIBS intensities and the Fe concentrations (g/kg) obtained by FAAS analysis of the whole soil samples and the humic fractions. Very strong Pearson correlations were obtained for the humic acid and humin fractions, with R values of 0.95 and 0.97, respectively (Figures 2(a) and 2(b)), while weaker correlations were found for the whole soils and the fulvic acid fractions. This suggested that the former two fractions, especially the humic acids, strongly participated in the transport of Fe to other horizons of the Amazonian Spodosols.
Figure 2. Correlations between the LIBS intensities and the Fe concentrations (g/kg) in the Amazonian Spodosol samples: (a) humic acids; (b) humin.
0,0 0,5 1,0 1,5 2,0 2,5 0,0 4,0x10⁴ 8,0x10⁴ 1,2x10⁵ 1,6x10⁵ 2,0x10⁵
2,4x10⁵ LIBS Intensity (a.u.)
Linear Fit L IB S I n te n si ty ( a .u .) Fe (g/Kg) R = 0.95 (a) 0,2 0,4 0,6 0,8 1,0 2x10⁴ 3x10⁴ 4x10⁴ 5x10⁴ 6x10⁴ 7x10⁴
8x10⁴ LIBS Intensity (a.u.)
Linear Fit L IB S I n te n si ty ( a .u .) Fe (g/Kg) R = 0.97 (b)
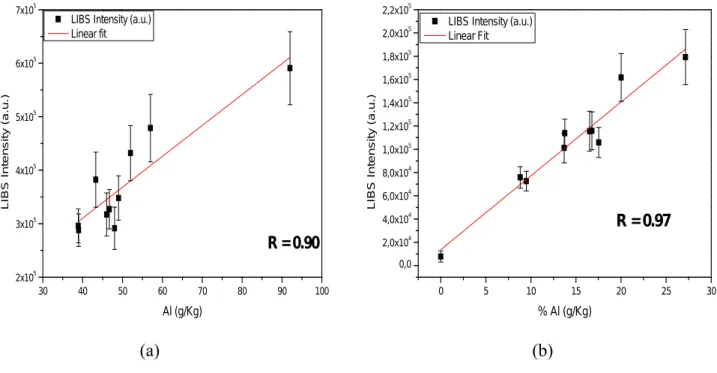
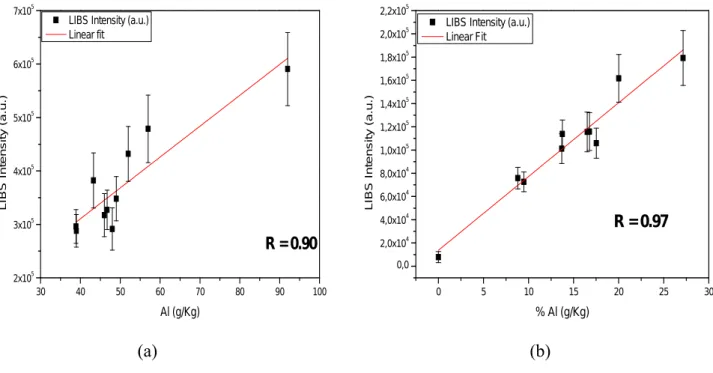
Figure 3 shows the correlation graphs for the LIBS intensity and [Al] (g/kg) determined by FAAS, for the whole soil samples and the fulvic acid fractions. Strong
516 517 518 519 520 521 522 523 524 525 526 527 528 529 530 531 532 533 534 535 536 537 538 539 540 541 542 543 544 545 546 547 548 549 550 551 552 553 554 555 556 557 558 559 560 561 562 563 564 565 566 567 568 569
Pearson correlations were obtained for both the whole soil (R = 0.90) (Figure 3(a)) and the fulvic acid fraction (R = 0.97) (Figure 3(b)), indicating that the simplest fraction of the organic matter of these Amazonian Spodosols (the fulvic acids) was most important for the transport of Al. The results shown in Figures 2 and 3 were in agreement with those presented in Figure 1. Consequently, in the case of the hydromorphic Spodosol (P1), the presence of groundwater outcrops favored the movement of this metal towards the deeper horizons, as observed by the high amounts of this metal in the whole soil (Table 1), compared to the well-drained Spodosol (P4).
Figure 3. Correlations between the LIBS intensities and the Al concentrations (g/kg) in the Amazonian Spodosol samples: (a) whole soil; (b) fulvic acids.
30 40 50 60 70 80 90 100 2x10⁵ 3x10⁵ 4x10⁵ 5x10⁵ 6x10⁵ 7x10⁵
LIBS Intensity (a.u.) Linear fit L IB S I n te n si ty ( a .u .) Al (g/Kg) R = 0.90 (a) 0 5 10 15 20 25 30 0,0 2,0x10⁴ 4,0x10⁴ 6,0x10⁴ 8,0x10⁴ 1,0x10⁵ 1,2x10⁵ 1,4x10⁵ 1,6x10⁵ 1,8x10⁵ 2,0x10⁵ 2,2x10⁵
LIBS Intensity (a.u.) Linear Fit L IB S I n te n si ty ( a .u .) % Al (g/Kg) R = 0.97 (b)
The results demonstrated that use of the LIBS technique enabled acquisition of important information concerning the humic fractions of the soil organic matter. In particular, it was possible to quantify the contributions of the different humic fractions to the processes of podzolization in these soils. The LIBS technique is faster than conventional techniques and was able to provide important information about key elements present in the humic fractions of organic matter in Amazonian soils.
4. Conclusions
The results showed that the fulvic acid fraction was associated with high
573 574 575 576 577 578 579 580 581 582 583 584 585 586 587 588 589 590 591 592 593 594 595 596 597 598 599 600 601 602 603 604 605 606 607 608 609 610 611 612 613 614 615 616 617 618 619 620 621 622 623 624 625 626 627 628
amounts of Al, while the humic acid fraction was more selective towards Fe. The transfer of Fe and Al to deeper profiles involved young and less humified organic matter (soil P1), or older organic matter with a low degree of humification (soil P4). It could therefore be concluded that the three humic fractions (HA, FA, and HU) were involved in the soil podzolization process, with the FA and HA fractions playing predominant roles in the transport of Al and Fe, respectively.
The potential of LIBS as a technique capable of assisting in investigation of the processes of formation of Amazonian Spodosols was also evaluated. The data obtained showed strong correlations with the results of analyses using the reference method (FAAS), for Fe in the humic acid and humin fractions (R = 0.95 and 0.97, respectively), and for Al in the fulvic acid fraction (R = 0.97). This is the first study using LIBS applied to samples of environmental humic fractions. In combination with FAAS, it enabled understanding of the roles of the humic fractions in the transport of nutrients and in the process of formation of Amazonian Spodosols.
5. Acknowledgments
The authors are grateful for the financial support provided by the São Paulo State Research Foundation (FAPESP, grants 2011/03250-2, 2012/51469-6, 2013/07276-1, and 2013/13013-3) and the Brazilian National Council for Technological and Scientific Development (CNPq, grants 303478/2011-0, 306674/2014-9, 150087/2017-9 and 232225/2014-1-SWE). The authors would like to thank Dr. Célia Regina Montes (ESALQ/ USP – Piracicaba, SP) for having given samples for analysis.
6. References
[1] S. Trumbore, P.B. Camargo. Dinâmica do carbono do solo, in: M. Keller, M. Bustamante, J. Gash, P. S. Dias (Eds.), Amazonia and Global Change, 2009, pp. 451– 462.
[2] D.S. Fanning, M.C.B. Fanning. Soil: morphology, genesis and classification. New York: John Willey & Sons, 1989.
[3] C. Doupoux, P. Merdy, C.R. Montes, N. Nunan, A.J. Melfi, O.J.R. Pereira, Y. Lucas. Modelling the genesis of equatorial podzols: age and implications for carbon fluxes. Biogeosciences. 14 (2017) 2429–2440.
[4] F.J Stevenson. Humus chemistry: genesis, composition and reaction. 2. ed. New York: John Wiley, 1994.
634 635 636 637 638 639 640 641 642 643 644 645 646 647 648 649 650 651 652 653 654 655 656 657 658 659 660 661 662 663 664 665 666 667 668 669 670 671 672 673 674 675 676 677 678 679 680 681 682 683 684 685 686 687
[5] A.G. Corrêa, V.G. Zuin. Química Verde: fundamentos e aplicações. Primeira ed.[s.l.] Edufscar, 2009.
[6] D.W. Hahn, N. Omenetto. Laser-Induced Breakdown Spectroscopy (LIBS), part I: review of basic diagnostics and plasma–particle interactions: still-challenging issues within the analytical plasma community. Appl. Spectrosc. 64 (2010) 335–366.
[7] E.C. Ferreira, D.M.B.P. Milori, E.J. Ferreira, L.M. Dos Santos, L. Martin-Neto, A.R.D.A. Nogueira. Evaluation of laser induced breakdown spectroscopy for multielemental determination in soils under sewage sludge application. Talanta 85 (2011) 435–440.
[8] G. Nicolodelli, B.S. Marangoni, J.S. Cabral, P.R. Villas-Boas, G.S. Senesi, C.H. Santos, R.A. Romano, A. Segnini, Y. Lucas, C.R. Montes, D.M.B.P. Milori. Quantification of total carbon in soil using laser- induced breakdown spectroscopy: amethod to correct interference lines. Appl. Opt. 53 (2104) 2170–2176.
[9] G. Nicolodelli, G.S. Senesi, R.A. Romano, I.L.O. Perazzoli, D.M.B.P. Milori. Signal enhancement in collinear double-pulse laser-induced breakdown spectroscopy applied to different soils. Spectrochim. Acta, Part B. 111 (2015) 23-29.
[10] P.R. Villas-Boas, R.A. Romano, M.A.M. Franco, E.C. Ferreira, E.J. Ferreira, S. Crestana, D.M.B.P. Milori. Laser-induced breakdown spectroscopy to determine soil texture: A fast analytical technique. Geoderma 263 (2016) 195-202.
[11] B.S. Marangoni, K.S.G. Silva, G. Nicolodelli, G.S. Senesi, J.S. Cabral, P.R. Villas-Boas, C.S.S. Texeira, A.R.A. Nogueira, V.M. Benites, D.M.B.P. Milori. Phosphorus quantification in fertilizers using laser induced breakdown spectroscopy (LIBS): a methodology of analysis to correct physical matrix effects. Anal. Methods 8 (2016) 78-82.
[12] G. Nicolodelli, G.S. Senesi, I.L.O. Perazzoli, B.S. Marangoni, V.M. Benites, D.M.B.P. Milori. Double pulse laser induced breakdown spectroscopy: A potential tool for the analysis of contaminants and macro/micronutrients in organic mineral fertilizers. Sci. Total Environ. 565 (2016) 1116-1123.
[13] A.M. Tadini, G. Nicolodelli, G.S. Senesi, D.A. Ishida, C.R. Montes, Y. Lucas, S. Mounier, F.E.G. Guimarães, D.M.B.P. Milori. Soil organic matter in podzol horizons of the Amazon region: Humification, recalcitrance, and dating. Sci. Total Environ. 613-614 (2018) 160-167.
[14] R. Boulet, A. Chauvel, F.X. Humbel, Y. Lucas. Analyse structurale et cartographie en pédologie: I – Prise en compte de l‘organisation bidimensionelle de la couverture pédologique: les études de toposéquences et leurs principaux apports à la connaissance dês sols. Séries Pédologie 19 (1982) 309-321.
[15] R.D. Santos, R.C. Lemos, H.G. Santos, J.C. Ker, L.H.C. Anjos, L.H.C. Manual de descrição e coleta de solo no campo. Viçosa: Sociedade Brasileira de Ciência do Solo, 2005. 691 692 693 694 695 696 697 698 699 700 701 702 703 704 705 706 707 708 709 710 711 712 713 714 715 716 717 718 719 720 721 722 723 724 725 726 727 728 729 730 731 732 733 734 735 736 737 738 739 740 741 742 743 744 745 746
[16] Empresa Brasileira de Pesquisa Agropecuária (EMBRAPA). Sistema brasileiro de classificação de solos. Brasília, 2006. 306 p.
[17] J. Rice, P. Maccarthy. Isolation of humin by liquid-liquid partitioning. Sci. Total Environ. 81-82 (1989) 61-69.
[18] R.S. Swift. Organic matter characterization. In: D.L. Sparks, A.L. Page, P.A. Helmke, R.H. Loeppert, P.N. Soltanpour, M.A. Tabatabai, C.T. Johnston, M.E. Summer (Eds), Methods of soil analysis: chemical methods. Madison: Soil Science Society of America, Cap. 35, 2009, pp. 1018-1020.
[19] Environmental Protection Agency (EPA), Method 3052: microwave assisted acid digestion of siliceous and organically based matrices.Washington, 1996. 20 p.
[20] N. Keshava. Distance metrics and band selection in hyperspectral processing with application to material identification and spectral libraries. IEEE Transactions on Geoscience and Remote Sensing 42 (2004) 1552–1565.
[21] NIST Atomic Spectra Database, http://www.nist.gov/pml/data/asd.cfm, accessed February 2018.
[22] C.H. Santos. Estudo da matéria orgânica e composição elementar de solos arenosos de regiões próximas a São Gabriel da Cachoeira no Amazonas. 2014. 155 f. Tese (Doutorado em Química Analítica) – Instituto de Química de São Carlos, Universidade de São Paulo, São Carlos, 2014.
[23] F.A.O. Camargo, G.A. Santos, E. Zonta. Electrochemical Changes in wetland soils. Ciência Rural 29 (1999) 171-180.
[24] R. Sousa, F.A.O. Camargo, L.C. Vahl. Solos alagados: reações de redox. In: E.J. Meurer (Ed.), Fundamentos de química do solo. Porto ALegre: Evangraf, 2010. pp. 171-195.
[25] D. Ishida. Caracterização e Gênese de Solos e de Depósito de Caulim Associado, São Gabriel da Cachoeira - AM. 2010. 192 f. Tese (Doutorado em Geoquímica de Processos) – Instituto de Geociências, Universidade de São Paulo, São Paulo, 2010.
752 753 754 755 756 757 758 759 760 761 762 763 764 765 766 767 768 769 770 771 772 773 774 775 776 777 778 779 780 781 782 783 784 785 786 787 788 789 790 791 792 793 794 795 796 797 798 799 800 801 802 803 804 805
Figure 1. Typical LIBS spectra for the hydromorphic spodosol (P1 A 0-15 cm): (a) whole soil, (b) humic acids, (c) fulvic acids, and (d) humin.
220 240 260 280 300 320 340 10000 20000 30000 40000 50000 60000 LI B S In te nsi ty ( u. a. ) (nm) (a) 220 240 260 280 300 320 340 5000 10000 15000 20000 25000 30000 LI B S In te nsi ty ( u. a. ) (nm) (b) 220 240 260 280 300 320 340 10000 20000 30000 40000 50000 60000 70000 (nm) LI B S In te nsi ty ( u. a. ) (c) 220 240 260 280 300 320 340 10000 20000 30000 40000 50000 LI B S In te nsi ty ( u. a. ) (nm) (d)
the Amazonian Spodosol samples: (a) humic acids; (b) humin. 0,0 0,5 1,0 1,5 2,0 2,5 0,0 4,0x10⁴ 8,0x10⁴ 1,2x10⁵ 1,6x10⁵ 2,0x10⁵
2,4x10⁵ LIBS Intensity (a.u.)
Linear Fit L IB S I n te n si ty ( a .u .) Fe (g/Kg) R = 0.95 (a) 0,2 0,4 0,6 0,8 1,0 2x10⁴ 3x10⁴ 4x10⁴ 5x10⁴ 6x10⁴ 7x10⁴
8x10⁴ LIBS Intensity (a.u.)
Linear Fit L IB S I n te n si ty ( a .u .) Fe (g/Kg) R = 0.97 (b)
Figure 3. Correlations between the LIBS intensities and the Al concentrations (g/kg) in the Amazonian Spodosol samples: (a) whole soil; (b) fulvic acids.
30 40 50 60 70 80 90 100 2x10⁵ 3x10⁵ 4x10⁵ 5x10⁵ 6x10⁵ 7x10⁵
LIBS Intensity (a.u.) Linear fit L IB S I n te n si ty ( a .u .) Al (g/Kg) R = 0.90 (a) 0 5 10 15 20 25 30 0,0 2,0x10⁴ 4,0x10⁴ 6,0x10⁴ 8,0x10⁴ 1,0x10⁵ 1,2x10⁵ 1,4x10⁵ 1,6x10⁵ 1,8x10⁵ 2,0x10⁵ 2,2x10⁵
LIBS Intensity (a.u.) Linear Fit L IB S I n te n si ty ( a .u .) % Al (g/Kg) R = 0.97 (b)
Spodosols.
Samples Carbon (%) Concentration of metals (g/kg)
Metals
Area Horizon Depth (cm) Soils HA FA HU Soils HA FA HU
A 0-15 22.5 ± 0.9 45 ± 3 18.2 ± 0.5 52.03 ± 0.08 1.20 ± 0.01 0.4 ± 0.2 0.07 ± 0.01 0.3 ± 0.1 A-E 15-30 1.01 ± 0.09 51 ± 1 26.9 ± 0.2 24.38 ± 0.01 0.95 ± 0.01 0.3 ± 0.1 * 0.2 ± 0.1 Bh 40-50 2.1 ± 0.2 56.2 ± 0.2 36.8 ± 0.8 36.67 ± 0.03 0.77 ± 0.01 0.3 ± 0.1 0.12 ± 0.01 0.2 ± 0.1 Bh-C 240 3.2 ± 0.2 46 ± 2 47.9 ± 0.1 * 6.44 ± 0.01 0.6 ± 0.2 * 0.4 ± 0.1 P1 C 350 1.2 ± 0.2 51 ± 3 38.7 ± 0.9 5.17 ± 0.00 2.13 ± 0.01 0.2 ± 0.1 0.07 ± 0.01 1.0 ± 0.2 A 0-20 3.9 ± 0.2 45.2 ± 0.3 34 ± 3 41.43 ± 0.07 2.29 ± 0.01 1.8 ± 0.5 0.2 ± 0.1 0.2 ± 0.1 A 20-30 3.5 ± 0.2 49.4 ± 0.01 21.6 ± 0.2 * 2.28 ± 0.01 1.9 ± 0.4 * 0.2 ± 0.1 A 30-40 0.89 ± 0.01 50 ± 2 10.8 ± 0.1 5.76 ± 0.02 2.60 ± 0.01 2.3 ± 0.3 * 0.3 ± 0.1 Bh 110-120 0.42 ± 0.02 50.0 ± 0.1 39.8 ± 0.6 * 1.81 ± 0.01 1.1 ± 0.2 * 0.4 ± 0.1 Bh 170-180 0.38 ± 0.01 52 ± 6 3.1 ± 0.0 5.33 ± 0.02 1.72 ± 0.01 1.4 ± 0.2 * 0.3 ± 0.1 Bh 370-380 0.48 ± 0.01 52.8 ± 0.3 32.8 ± 0.2 2.26 ± 0.01 2.49 ± 0.01 1.2 ± 0.6 * 0.4 ± 0.1 Fe P4 Bh 380-390 0.78 ± 0.01 54.5 ± 0.5 34.5 ± 0.3 * 1.66 ± 0.01 1.3 ± 0.2 * 0.3 ± 0.1 A 0-15 22.5 ± 0.9 45 ± 3 18.2 ± 0.5 52.03 ± 0.08 43 ± 1 * 16.8 ± 0.2 * A-E 15-30 1.01 ± 0.09 51 ± 1 26.9 ± 0.2 24.38 ± 0.01 39 ± 1 * 13.8 ± 0.5 * Bh 40-50 2.1 ± 0.2 56.2 ± 0.2 36.8 ± 0.8 36.67 ± 0.03 57 ± 1 * 8.8 ± 0.3 * Bh-C 240 3.2 ± 0.2 46 ± 2 47.9 ± 0.1 * 92 ± 1 * * * P1 C 350 1.2 ± 0.2 51 ± 3 38.7 ± 0.9 5.17 ± 0.00 52 ± 1 * 20.0 ± 0.1 5.0 ± 0.1 A 0-20 3.9 ± 0.2 45.2 ± 0.3 34 ± 3 41.43 ± 0.07 48 ± 1 6.4 ± 0.4 9.5 ± 0.1 * A 20-30 3.5 ± 0.2 49.4 ± 0.01 21.6 ± 0.2 * 47 ± 1 * 27.2 ± 0.2 * A 30-40 0.89 ± 0.01 50 ± 2 10.8 ± 0.1 5.76 ± 0.02 46 ± 1 * 17.5 ± 0.1 * Bh 110-120 0.42 ± 0.02 50.0 ± 0.1 39.8 ± 0.6 * 39 ± 1 * 13.7 ± 0.4 * Bh 170-180 0.38 ± 0.01 52 ± 6 3.1 ± 0.0 5.33 ± 0.02 49 ± 1 * 16.5 ± 0.3 * Bh 370-380 0.48 ± 0.01 52.8 ± 0.3 32.8 ± 0.2 2.26 ± 0.01 41 ± 1 * 20.5 ± 0.2 * Al P4 Bh 380-390 0.78 ± 0.01 54.5 ± 0.5 34.5 ± 0.3 * 51 ± 1 * 21 ± 1 *