Délivré par le
Centre international d'études supérieures en sciences
agronomiques – Montpellier SupAgro
Préparée au sein de l’école doctorale SIBAGHE
Et de l’unité de recherche UMR 759 - LEPSE
Spécialité : Biologie Intégrative des Plantes
CNU : Physiologie
Présentée par Maryline LIEVRE
Soutenue le 15 décembre 2014 devant le jury composé de
M. Teva VERNOUX, Directeur de Recherche, CNRS RDP Rapporteur M. Bruno ANDRIEU, Directeur de Recherche, INRA EGC Rapporteur Mme Nadia BERTIN, Directeur de Recherche, INRA PSH Examinatrice M. Christian JAY-ALLEMAND, Professeur, Université Montpellier II Examinateur Mme Christine GRANIER, Chargée de Recherche, INRA LEPSE Directrice de thèse M. Yann GUEDON, Chercheur CIRAD, CIRAD AGAP & INRIA,
Virtual Plants
Co-encadrant
Analyse multi-échelle et modélisation de la
croissance foliaire chez Arabidopsis
thaliana.
–
Mise au point et test d’un pipeline d’analyses
permettant une analyse intégrée du
Delivered by the
International center of higher education in agronomic sciences –
Montpellier SupAgro
Prepared in the doctoral school SIBAGHE
And the research unit UMR 759 - LEPSE
Speciality: Plant Integrative Biology
CNU: Physiology
Presented by
Maryline LIEVRE
Defended on December 15th, 2014 Jury:
Mr Teva VERNOUX, Senior Researcher, CNRS RDP Main examiner Mr Bruno ANDRIEU, Senior Researcher, INRA EGC Main examiner Mrs Nadia BERTIN, Senior Researcher, INRA PSH Examiner Mr Christian JAY-ALLEMAND, Professor, University Montpellier II Examiner Mrs Christine GRANIER, Researcher, INRA LEPSE Supervisor Mr Yann GUEDON, Senior Researcher, CIRAD AGAP & INRIA, Virtual Plants Co-supervisor
Multi-scale analysis and modeling of shoot
growth in Arabidopsis thaliana
–
Development and testing of a pipeline of analysis
methods enabling an integrative analysis of the
3
LABORATOIRED’ACCUEIL LEPSE
Laboratoire d’Ecophysiologie des Plantes sous Stress Environnementaux UMR 759 INRA / Montpellier SupAgro
IBIP – Institut de Biologie Intégrative des Plantes Bâtiment 7
2 place Pierre Viala 34060 Montpellier cedex 1
FRANCE
FINANCEMENT CIFRE
Association Nationale de la Recherche et de la Technologie – Ministère français de l’Enseignement supérieur et de la Recherche
&
5
RESUME
Ce travail est basé sur le constat du manque de méthodes permettant l'analyse intégrée des processus contrôlant le développement végétatif d'Arabidopsis thaliana dans les études phénotypiques multi-échelles. Un phénotypage préliminaire de la croissance foliaire de 91 génotypes a permis de sélectionner 3 mutants et des variables d'intérêt pour une étude plus poussée du développement de la pousse. Un pipeline de méthodes d'analyses combinant techniques d'analyse d'images et modèles statistiques a été développé pour intégrer les mesures faites à l'échelle de la feuille et de la pousse. Des modèles multi-phasiques à changements de régime semi-markovien ont été estimés pour chaque génotype permettant une caractérisation plus pertinente des mutants. Ces modèles ont validé l'hypothèse selon laquelle le développement de la rosette peut être découpé en une suite de phases de développement, pouvant varier selon les génotypes. Ils ont aussi mis en évidence le rôle structurant de la variable «trichome abaxial», bien que les phases de développement ne puissent être entièrement expliquées par ce trait. Un 2nd pipeline d'analyses combinant une méthode semi-automatique de segmentation d'images de l'épiderme foliaire et l'analyse des surfaces de cellules par un modèle de mélange de lois gamma à paramètres liés par une loi d'échelle a été développé. Ce modèle nous a permis d'estimer la loi du nombre de cycles d'endoréduplication. Nous avons mis en évidence que cette loi dépendait du rang de la feuille. Le cadre d'analyses multi-échelles développé et testé durant cette thèse devrait être assez générique pour être appliqué à d'autres espèces végétales dans diverses conditions environnementales.
Mots clés : Développement foliaire, analyse multi-échelles, modèle de segmentation,
6
SUMMARY
This study is based on the observation of a lack of methods enabling the integrated analysis of the processes controlling the vegetative development in Arabidopsis thaliana during multi-scale phenotypic studies. A preliminary leaf growth phenotyping of 91 genotypes enabled to select 3 mutants and different variables of interest for a more in depth analysis of the shoot development. We developed a pipeline of analysis methods combining image analysis techniques and statistical models to integrate the measurements made at the leaf and shoot scales. Semi-Markov switching models were built for each genotype, allowing a more thorough characterization of the studied mutants. These models validated the hypothesis that the rosette can be structured into successive developmental phases that could change depending on the genotype. They also highlighted the structuring role of the ‘abaxial trichomes' variable, although the developmental phases cannot be explained entirely by this trait. We developed a second pipeline of analysis methods combining a semi-automatic method for segmenting leaf epidermis images, and the analysis of the obtained cell areas using a gamma mixture model whose parameters of gamma components are tied by a scaling rule. This model allowed us to estimate the mean number of endocycles. We highlighted that this mean number of endocycles was function of the leaf rank. The multi-scale pipeline of analysis methods that we developed and tested during this PhD should be sufficiently generic to be applied to other plant species in various environmental conditions.
Keywords: Shoot development, multi-scale analysis, segmentation model, heteroblasty, Arabidopsis thaliana, epidermal cells.
7
REMERCIEMENTS
La préparation d’une thèse est un travail collectif, et je tiens ici à remercier les personnes qui ont collaboré de près ou de loin à l’aboutissement de mon travail.
Je tiens tout d’abord à remercier Christine d’avoir cru en moi suite au stage de master pendant lequel elle m’a encadrée et pour m’avoir donné l’opportunité de faire cette thèse. Merci pour ton aide et ta disponibilité pendant ces trois (presque quatre) années. Tu n’as pas craint de remettre en question certaines pratiques de phénotypage pourtant bien installées et c’est grâce à ta curiosité que ce projet a pu voir le jour. Le chemin n’a pas toujours été facile mais je suis heureuse qu’on ait su mener notre collaboration à bien et dans de très bonnes conditions. Tu m’as beaucoup appris sur moi d’un point de vue professionnel. Je te remercie aussi grandement de m’avoir céder ton bureau pour le temps de la rédaction pour me permettre de travailler dans mes conditions « vampiresques » sans qu’Anaëlle et Béatriz aient à en souffrir ! Tu apportes un vrai dynamisme dans le laboratoire, scientifiquement et personnellement. Sans les croissants suivant les victoires de Montpellier et les commentaires à la pétanque le LEPSE ne serait pas le même.
Un grand merci aussi à Yann pour son encadrement, son implication dans le projet, la patience avec laquelle il m’a expliqué les tenants et les aboutissants des modèles statistiques que nous avons dû développer. Sans tes compétences et ton intérêt nous n’aurions pas pu mener ce projet à bout. Grâce à toi j’ai vraiment pu développer de nouvelles connaissances dans ce domaine qui m’intéressait mais dans lequel je n’avais que de faibles bases, et c’était une des choses que je souhaitais en m’attelant à cette thèse. Je veux aussi te remercier pour la gentillesse dont tu as su faire preuve lors des périodes difficiles.
Je tiens aussi à remercier plus largement tous ceux qui m’ont aidé à constituer nos jeux de données (et ce ne fut pas une mince affaire !). Un énorme merci donc à Alex, Pablo, Tony, Rémi et Jessica (j’espère n’oublier personne) pour les heures passées penchés sur les tablettes graphiques à dessiner des dizaines de milliers de feuilles (je viens de regarder, plus de 45000 mesures au total sans les repassages nécessaires les gars, c’est nous les boss !) et à corriger les segmentations des empreintes d’épidermes !! On aura au moins pu enrichir mutuellement nos cultures musicales et passer des bons moments à rire et à râler en écoutant les débats à la radio en imagerie. Merci aussi à Myriam, la maman des PHENOPSIS, pour ta disponibilité et ta réactivité. N’oublions pas que sans tes « bébés » je pouvais dire adieu à mes jeux de données ! Merci à tous ceux qui ont pris part aux récoltes, Alex, Tony, Myriam et Jessica à nouveau,
8
Cris, Gaëlle aussi que je n’ai pas encore citée alors que je pouvais toujours compter sur elle, et tous ceux qui sont passés donner un coup de main ponctuel dans les moments de rush. Merci aussi à Mathilde Bettembourg pour les résultats qu’elle a produit pendant son stage.
Tous mes remerciements aussi à Christian qui a accepté de lire ce document en avant-première et m’a aidé à prendre un peu de recul sur certains aspects dans les heures intenses précédant l’envoi du manuscrit. Merci aussi à tous les chercheurs avec qui j’ai pu échanger, en particulier Denis Vile, Olivier Turc, Thierry Simonneau, Angélique Christophe et Éric Lebon pour les occasionnelles discussions scientifiques et sur la recherche en général qui m’ont beaucoup apporté.
Je tiens aussi à remercier toute l’équipe de Virtual Plants qui a fait très bon accueil lors de mes passages dans ses murs. Une attention particulière à l’égard de Léo Guignard qui a participé au développement du protocole de segmentation d’images. Ton expertise a été précieuse et les pauses clopes à la fois agréables et productives. Merci aussi à Christophe Godin pour sa participation aux discussions concernant la segmentation des images.
A ce sujet je veux aussi dire merci à Ullrich Koethe et Niko Krasowski pour les échanges autour de l’utilisation d’ilastik. J’espère que cette expérience aura des retombées positives pour toutes les parties impliquées. Je salue également J. L. Micol qui nous a fourni les graines des 90 mutants SALK que son équipe avait préliminairement screenés.
Je remercie aussi Bayer CropScience pour avoir soutenu (scientifiquement et financièrement) ma thèse. Je suis particulièrement reconnaissante à Rajendra Bari et Korneel Vandenbroucke pour la liberté qu’ils nous ont laissé face à l’orientation du sujet. Merci également à Bernard Pelissier pour avoir bien voulu remplir le rôle de correspondant auprès du GIE AIFOR.
Merci aussi à Nadine Hilgert, Jean-Luc Regnard et Patrick Laufs pour avoir participé à mes comités de thèse. Les discussions que nous avons eues à ces occasions ont été très enrichissantes et ont bien aidé à cadrer le travail à faire. Merci particulièrement à Patrick pour nous avoir fourni des graines pour notre dernière manip. J’espère que les résultats obtenus vous seront utiles.
Je tiens également à remercier les membres du jury pour avoir bien voulu analyser et étudier mon travail. Merci donc à Christian Jay-Allemand pour avoir accepté d’être le président du jury, et à Bruno Andrieu et Teva Vernoux pour avoir accepté la lourde tâche des rapporteurs. Merci également à Nadia Bertin son intérêt pour avoir accepté de faire partie du
9
jury de thèse au titre d’examinatrice.
De manière générale je remercie l’ensemble du LEPSE pour la bonne ambiance qui règne dans ce labo. Merci à Anaëlle, Emilie, Nathalie, Aude, Erwann, Justine, Sébastien, Benoît V. et les joueurs occasionnels pour les parties de tarots du midi (Emilie, tu auras finalement réussi à tenir malgré mes chansonnettes, merci d’avoir résister). Merci à Pauline, Stéphane, Tony, Nico, Alex, Jonathan, Antonin, Romain, Benoît S., Vincent N. et les autres pour les pétanques. Merci à tous pour les pauses de quatre heure, les apéros et barbecues de fin de semaine qui permettaient de relâcher un peu la pression. Merci aussi d’avoir supporté mes discours sans fin sur la politique et la société, les débats ont souvent été enrichissants ! Un immense merci à tous ceux qui ont bien voulu me dépanner multiples cigarettes ces derniers mois, surtout à Alex (fournisseur officiel !). Je vous dois une fière chandelle (et bien plus…). Je tiens d’ailleurs à remercier plus particulièrement Alex. Ta gentillesse, ta bonne humeur et ton écoute attentive m’ont sauvé bien des journées et je t’en serai toujours reconnaissante.
J’aimerais aussi faire des remerciements plus personnels à tous mes proches qui ont vécu cette thèse en même temps que moi. Sandra, tu as été mon soutien indéfectible, merci mille fois pour les heures passées sur Skype ou au téléphone à parler de la recherche et de la vie en général. Tu as toujours su me rassurer et ton regard extérieur a permis de me débloquer plusieurs fois, j’espère pouvoir te retourner la faveur dans l’avenir. Merci aussi bien sûr à celui qui partage ma vie depuis plus de 2 ans, Sam. Tu as toujours été là pour moi, tu as su me soutenir, t’impliquer et me proposer ton aide aux moments clef et même me remettre sur pieds quand j’en ai eu besoin. Je te remercie aussi pour les multitudes de choses que tu m’as fait découvrir, et surtout pour ta façon de me faire rire, toujours. Sans toi, ces années auraient été bien plus difficiles à vivre. Enfin, un grand merci « aux copains », Pablo, Clem, Tom, François, Simon, Alex M., Ian, Sandra C., pour les heures passées à « coincher », à s’enflammer dans des débats sans fin, à refaire le monde, à chanter. Vous m’avez aidé à élargir ma vision du monde et des possibles, et les moments passés avec vous ont souvent été des bouffées d’air bien nécessaires. Merci enfin à ma famille, mes parents et ma petite sœur qui m’ont accompagné de loin dans cette aventure un peu folle qu’est la thèse. Votre soutien et vos encouragements m’ont été précieux.
11
TABLE OF CONTENT
CHAPTER I. CONTEXT, AIM AND STRATEGY OF THE PHD 15 1. Presentation of different processes involved in Arabidopsis thaliana rosette
development 15
2. Interactions between leaf growth related processes occurring at different scales 18
2.1. Contribution of cell division and expansion to final leaf size 18 2.2. Impact of flowering transition on leaf area development and its cellular components 19
3. Practices and pitfalls in leaf growth phenotyping 20
3.1. Interest of phenotyping leaf growth over time 21 3.2. Phenotyping leaf growth over time: late differences can be due to early processes 22 3.3. Comparing growth of successive leaves along the shoot 23
4. Aim and strategy of the PhD 25
CHAPTER II. USE AND LIMITS OF EXISTING PIPELINE OF ANALYSES FOR COMPARING LEAF GROWTH PHENOTYPES IN A. THALIANA: A TEST ON 90
T-DNA INSERTION LINES 27
1. Introduction 27
2. Material and Methods 29
2.1. Biological material 29
2.2. Growth conditions 29
2.3. Growth measurements 30
2.4. Statistical analyses 33
3. Results 33
3.1. Lines with contrasted leaf phenotypes could not be identified robustly when leaf growth
variables were compared 18 days after sowing 33 3.2. Many lines were affected on the different growth variables measured at the opening of the
first flower when compared to the wild-type 35 3.3. Selection of 4 lines with contrasted leaf growth phenotypes for a more in depth
phenotypical study 38
3.4. In depth phenotyping analysis of the 4 contrasted lines 40
4. Discussion 46
4.1. Early stage leaf growth phenotyping does not reflect the final leaf growth phenotype 46 4.2. Considerations regarding the results of the more in depth phenotyping analysis 47
CHAPTER III. INTEGRATIVE MODELS FOR ANALYZING A. THALIANA ROSETTE
DEVELOPMENTAL PHASES 51
1. Introduction 51
2. Material & Methods 53
2.1. Plant material and growth conditions 53 2.2. Growth measurements – Image analyses and variables selection 54 2.3. Integrative multi-scale models for analyzing A. thaliana rosette developmental phases 56
3. Results 61
12
3.2. Comparison of the segmentations into developmental phases between Col-0 and each
T-DNA insertion line 61
3.3. Effect of the mutations on the values of leaf blade length-to-width ratio, final leaf area and
characteristic growth duration 68
3.4. Analysis of global plant shoot development: effects of the mutations on the duration of the vegetative phase, mean leaf apparition rate and final number of leaves 71
4. Discussion 71
4.1. The successive developmental phases structuring A. thaliana rosette are determined by a
combination of leaf growth traits 72 4.2. Our analysis method gives new insights concerning the effect of the mutations in T-DNA
insertions lines. 74
CHAPTER IV. A NEW PIPELINE OF METHODS COMBINING MACHINE LEARNING APPROACHES FOR IMAGE SEGMENTATION AND GAMMA MIXTURE MODELS
FOR ANALYZING CELL DIMENSIONS IN A. THALIANA LEAF EPIDERMIS 77
1. Introduction 77
2. Methodological developments 80
2.1. Plant material and growth conditions 80
2.2. Image acquisition 81
2.3. Image segmentation using ilastik v.0.5.12 81 2.4. Gamma mixture models incorporating a scaling rule between components 85
3. Results 88
3.1. Identification of the scaling rule and selection of the number of components of the mixture
model 88
3.2. Estimation of the endoreduplication factor in the epidermis using the 4-component mixture
model 92
4. Discussion 94
4.1. Semi-automatic method for measuring cell areas in A. thaliana epidermis imprints: an
improvement for analyzing cell size diversity 94 4.2. Analyzing cell size diversity in A. thaliana epidermis using a 4-component gamma
mixture model 94
CHAPTER V. CONCLUSIONS AND PERSPECTIVES 97
1. Added value of our pipeline for the analysis of A. thaliana shoot development 97 2. Added value of our pipeline for the analysis of cell area diversity in A. thaliana leaf
epidermis 99
3. Integrating the estimated endoreduplication factor in our pipeline to analyse shoot
structuring 100
4. What next? Incorporating new variables in the multivariate pipeline and using targeted genotypes for specific questions 104
REFERENCES 107
13
APPENDIX II . SUPPLEMENTARY METHODS FOR INTEGRATIVE MODELS FOR
ANALYZING A. THALIANA ROSETTE DEVELOPMENTAL PHASES 122
APPENDIX III . SUPPLEMENTARY FIGURES FOR INTEGRATIVE MODELS FOR ANALYZING A. THALIANA ROSETTE DEVELOPMENTAL PHASES –
MACROSCOPIC SCALE 125
APPENDIX IV . COMPARISON BETWEEN MANUAL AND SEMI-AUTOMATIC
IMAGE SEGMENTATION METHODS 131
APPENDIX V . SUPPLEMENTARY FIGURES FOR INTEGRATIVE MODELS FOR
ANALYZING A. THALIANA ROSETTE DEVELOPMENTAL PHASES 135
APPENDIX VI . PRELIMINARY ANALYSES ON MUTANT LINES INVESTIGATING THE CROSSTALK BETWEEN MIRNA-DEPENDENT PATHWAYS AND SHOOT
DEVELOPMENT IN A. THALIANA 137
APPENDIX VII . POSTER OF M. LIÈVRE ET AL. (ICAR 2012) 139
15
CHAPTER I. C
ONTEXT
,
AIM AND STRATEGY OF THE
P
H
D
1.
PRESENTATION OF DIFFERENT PROCESSES INVOLVED IN
A
RABIDOPSIS THALIANA ROSETTE DEVELOPMENTThe shoot system is an essential unit of plant architecture as it bears leaves that play important roles in photosynthesis, respiration and photorespiration. Therefore, understanding how leaves develop during shoot formation is an important subject in plant biology research. Because of its small size, short life cycle and genetic resources available in different stock centers, Arabidopsis thaliana (A. thaliana) has been selected as a model plant for the systematic characterization of growth and development (Alonso et al. 2003; Koornneef and Meinke 2010). There has been extensive recent progress in understanding mechanisms controlling growth in this species, even if the circuitry that links the different mechanisms remains unclear. Shoot establishment results from the combination of developmental changes – i.e. the succession of events that contribute to the increase in organ number – with growth – i.e. the irreversible increase in organ dimensions over time. Developmental changes are often abrupt and take the form of a series of discrete events such as leaf initiation, emergence, or end of expansion (see also Boyes et al. 2001) for other developmental changes at the whole plant scale). In contrast, growth, such as the dynamic change in leaf area is gradual and often takes the form of a trend.
During shoot development leaves are initiated at regular intervals as primordia at specific sites on the shoot apical meristem (SAM). This is the first manifestation of the leaf that is not visible by naked eye. The rhythm at which leaf primordia are produced can affect the final number of leaves as shown in different mutants or different environmental conditions (Cookson et al. 2005). It is often but not strictly related to the size of the shoot apical meristem (Clark et al. 1993; Mauseth 2004; Boucheron et al. 2005; Skirycz et al. 2010). Leaf primordia localization is specified by auxin maxima in a flanking region of the SAM (Reinhardt et al. 2000), following a spiral phyllotaxy. The genetic, hormonal and mathematical rules defining this phyllotaxy have been extensively studied (de Reuille et al. 2006; Jönsson et al. 2006; Peaucelle and Laufs 2007; Mandel et al. 2014).
16
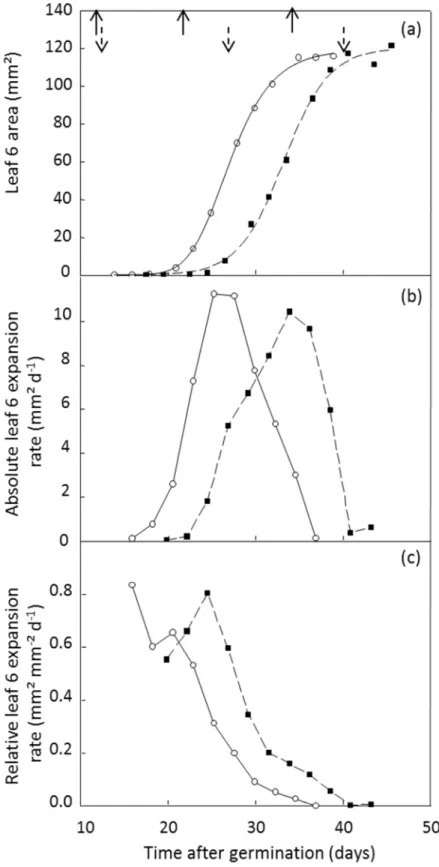
Figure I-1. Dynamics of leaf 6 area (a) and corresponding changes in absolute (b) and relative (c) leaf expansion rate for two A. thaliana genotypes, Ler ( ) and elo-1 ( ) (n = 5 or 6). The curves fitted in (a) are 3-parameter sigmoids for Ler y 116.56/ 1 exp t 17.11 /2.25 and elo-1y 120.22/ 1 exp t 23.18 /2.58 . For each genotype, leaf development was
characterized by three successive stages shown in (a): dates of initiation, emergence and end of expansion. They are indicated from left to right by solid upward and dashed downward arrows for Ler and elo-1 respectively. From Lièvre et al. (2013).
17
The leaf primordium is defined as a group of founder cells that develop further into a leaf after a series of coordinated division and expansion (Horiguchi et al. 2006a; Vanhaeren et al. 2010; Gonzalez et al. 2012). In dicotyledons, these processes co-exist spatially during the first stages of leaf development. One usually refers to the separation between the cell-proliferative area and the area where cells stop dividing and begin expanding and differentiating as the ‘cyclic arrest front’ (Nath et al. 2003). It was initially believed that cell proliferation stopped following a tip-to-base longitudinal gradient, but a recent study demonstrated that, in fact, the cyclic arrest front remains located at an almost constant distance from the leaf base during a certain period and then disappears relatively quickly progressing toward the base (Kazama et al. 2010). Numerous positive and negative regulators of cell proliferation in leaf primordia have been identified (see Tsukaya 2013 for review).
At the individual leaf level, leaf expansion corresponds to a gradual but non-linear gain of surface (Figure I-1 (a)). Individual leaves grow at a maximal relative expansion rate – i.e. a maximal area formed per unit area and unit of time – during the hidden phase (Figure I-1 (c)) whereas absolute leaf expansion rate – i.e. the area formed per unit of time – is low during this phase (Figure I-1 (b)) (Granier and Tardieu 1998). Upon emergence, relative leaf expansion rate decreases over time until the cessation of expansion, whereas absolute leaf expansion rate increases until a maximal value and decreases afterwards (Granier and Tardieu 2009). These trends are similar in eudicots and monocots with differences in the spatial distribution of expansion rate over the lamina resulting in a long phase with linear expansion, i.e. constant absolute expansion rate, in monocots that does not occur in eudicots (see Granier and Tardieu 2009 for details).
In A. thaliana and most flowering plants the cessation of rosette leaf initiation is due to a change in the SAM identity. This transition is the switch from vegetative to reproductive development. Environmentally and genetically induced changes in the timing of floral transition have been extensively studied. We thus start to have a clear knowledge of molecular networks controlling this transition in A. thaliana, as well as of the role of environmental variables such as photoperiod and temperature, as evidenced by recent reviews on the subject (Amasino 2010; Huijser and Schmid 2011; Srikanth and Schmid 2011; Andrés and Coupland 2012).
Floral transition in A. thaliana is visible because of the elongation of the primary axis internodes and the production of novel structures such as flowers. However, as in other higher plants, A. thaliana undergoes another, earlier, less apparent transition. Its vegetative
18
development can be divided into two main phases – a juvenile and an adult vegetative phase (Poethig 1990; Huijser and Schmid 2011). The transition between these phases, called vegetative phase change, corresponds to the acquisition of reproductive competence by the plant. It also involves changes, sometimes quite subtle, in leaves morphological traits. In A.
thaliana, these changes include leaf size, leaf blade length-to-width ratio (Steynen et al. 2001;
Cookson et al. 2007), number and depth of serrations (Röbbelen 1957), patterns of trichome production (Chien and Sussex 1996; Telfer et al. 1997) and epidermal cell area (Cookson et al. 2007; Usami et al. 2009). Recent progresses have been made in understanding the molecular pathways controlling the vegetative phase change (Poethig 2010, 2013; Yang et al. 2011, 2013; Willmann and Poethig 2011; Matsoukas et al. 2013), but the regulation of this transition remains largely unclear.
The different processes that have been presented here have mainly been studied individually, but interactions have been highlighted between processes even if, for now, our knowledge on this field is still limited. The following section presents some examples of these interactions found in the literature.
2.
INTERACTIONS
BETWEEN LEAF GROWTH RELATED PROCESSESOCCURRING AT DIFFERENT SCALES
2.1. Contribution of cell division and expansion to final leaf size
The majority of mutants displaying smaller leaves compared to their wild-type also have similar decreases in both their number and size of cells in the leaf (Horiguchi et al. 2006a). Some mutations increasing both number and size of cells also result in larger organs (Feng et al. 2011). Both the size and number of leaf cells seem to affect and be determinant in the control of the final sizes of leaves. However, the observation of compensation phenomenon in leaf morphogenesis, i.e. an abnormal increase in cell volume triggered by a decrease in cell number, revealed the existence of integration systems linking levels of cell proliferation and cell expansion in leaves (Tsukaya 2002; Ferjani et al. 2007). A study suggesting that in order to the compensation phenomenon to be triggered cell proliferation has to decrease below some threshold (Fujikura et al. 2009) led to the proposal of the existence of a cell-cell communication system (Kawade et al. 2010). The existence of this threshold could indicate that the leaf size is to some extent uncoupled from the size and number of cells by the compensatory system. Moreover, using QTLs analysis and structural equation models, Tisné
19
et al. (2008) showed that, at least in some cases, leaf expansion could be controlled at the level of the leaf itself, and that it can be a driving force for cell proliferation in the leaf. There is a large debate on that subject in the literature and depending on the studies, cellular processes are reported or not as engines driving organ growth (Cookson et al. 2005; John and Qi 2008; Massonnet et al. 2011).
2.2. Impact of flowering transition on leaf area development and its cellular components
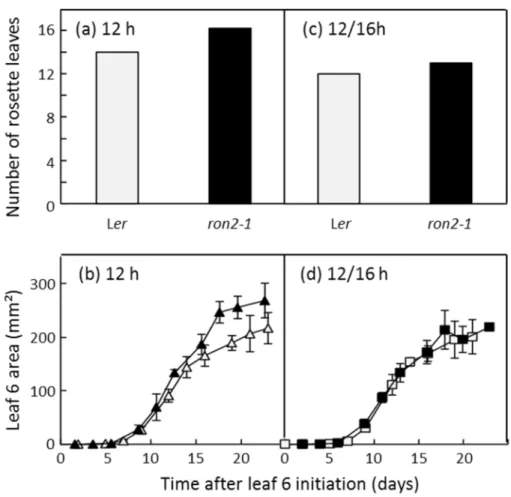
Factors controlling the timing of flowering transition can also affect vegetative development. Numerous studies have shown that nearly all of the conditions that affect the timing of floral transition also alter the total number of leaves (Koornneef et al. 1991; Cookson et al. 2007; Méndez-Vigo et al. 2010; Franks 2011; Itoh and Shimizu 2012). It was then suggested that the leaf growth phenotype observed in late flowering genotypes could be due, at least partly, to the delay in flowering time itself. Comparing the dynamics of leaf production and expansion in a few mutants in the Ler background, RONTUNDA2 mutant (ron2-1) was identified as the only one with an increased leaf size compared to its wild-type (Cnops et al. 2004; Cookson et al. 2005). The final size of the 6th leaf formed on the rosette was increased in ron2-1 (Figure I-2 (a)) as previously observed on the three first leaves (Cnops et al. 2004). Overall, rosette leaf number was significantly increased in ron2-1 in comparison with its wild-type (Figure I-2 (b)). Transferring plants to long day conditions during early development triggered a synchronization of flowering time in both genotypes and resulted in similar phenotypes in terms of leaf number and individual leaf areas (Figure I-2 (c) and (d)). Thus, even though there is no doubt that ron2-1 mutation did affect individual leaf growth, it seemed to be an indirect effect primarily due to an effect on leaf production and/or floral transition.
An elegant demonstration of some of these interactions has been made by Willmann and Poethig (2011) using genetics to specifically and directly alter flowering time. The authors used the polymorphism of FRIGIDA (FRI) and FLOWERING LOCUS C (FLC) genes to induce a delay in flowering time. FRI is a positive regulator of FLC, FLC being itself an inhibitor of the floral inductors FT and SOC1. Therefore, if a plant genome contains functional alleles for both of these genes (FRI;FLC), a strong repression is applied on FT and
SOC1 and floral transition will occurred later than if one of the genes FRI and FLC is present
as a non-functional allele (fri;FLC or FRI;flc). This study has highlighted that a delay in flowering time triggers an increase in epidermal cell area, in leaf size and in the final number
20
of rosette leaves. It has also shown that a delayed floral transition does not affect the onset of vegetative phase change but delays it. The duration of the adult vegetative phase was also extended. The same effects on the leaf area, duration of expansion and epidermal cell area in individual leaves have been shown when flowering time was delayed by a shortening of day-length (Cookson et al. 2007).
Figure I-2. Final number of rosette leaves of Ler (light grey) and ron2-1 (black) plants grown under a constant day length of 12h (a) or transferred from 12 to 16 h after 15 days following leaf initiation (c). Changes with time in leaf 6 area of Ler (light grey) and ron2-1 (black) grown under the photoperiods of 12h (b) or transferred from 12 to 16 h after 15 days following leaf initiation (d). Means with 95 % confidence intervals are shown (n = 5 plants per genotype and treatment). From Lièvre et al. 2013.
3.
PRACTICES AND PITFALLS IN LEAF GROWTH PHENOTYPING
Frameworks of analysis as well as protocols to assess plant development are shared in the plant science community (Boyes et al. 2001; Cookson et al. 2010; Rymen et al. 2010).
Identifying the genetic control of shoot growth and the developmental regulators involved requires a precise characterization of growth phenotypes using robust descriptors of shoot
21
organ size and overall geometry, production and growth rates. Because shoot development is the sum of discrete morphogenetic structures that appear at regularly spaced positions at the shoot apical meristem flanks over time, spatial and temporal descriptors are commonly used to measure shoot growth. In most studies, morphological traits are recorded in adult plants but in a few cases, these datasets are completed with temporal indicators, i.e., specific time-points at which visible events contributing to final shoot morphology take place.
3.1. Interest of phenotyping leaf growth over time
In large collections of natural variants or mutants, hundreds of genotypes have been classified according to leaf size, shape or number (Berná et al. 1999; Serrano-Cartagena et al. 1999; Juenger et al. 2005; Tisné et al. 2008; Massonnet et al. 2011; Pérez-Pérez et al. 2011). In some cases the authors drew conclusions on the genetic controls of ‘leaf growth’ or ‘leaf production’ from these datasets (Tisné et al. 2008; Ghandilyan et al. 2009). In these studies, leaf growth traits were measured at a given date after sowing or at a given developmental stage. However, several examples illustrate that a static ‘picture’ of a growth trait at a given date or stage does not necessarily reflect what will be the final value of this trait (Cockcroft et al. 2000). Genotypes with high initial relative leaf expansion rate have generally a shorter duration of leaf expansion (Cockcroft et al. 2000; Cookson et al. 2005). Conclusions drawn on traits measured at a given date cannot be generalized to the whole growing period and another analysis at another date or stage may lead to different conclusions, whatever the scale of growth analysis.
As illustrated in the section 1 of this chapter (Figure I-1 (a)), individual leaf expansion is a gradual but non-linear increase in area. Several examples highlighted that measuring final leaf area only can lead to the omission of underlying alterations in the dynamics of expansion. Indeed, alterations in final leaf area can be explained by changes in the duration of leaf expansion and/or the leaf expansion rate, and measuring these traits can give another dimension to phenotyping studies. It has been reported that environmental cues can affect individual leaf dynamics in several species. For instance, shading and reduced soil water content cause a decrease in the maximal leaf expansion rate whereas the duration of leaf expansion is either maintained or increased (Cookson et al. 2005; Pereyra-Irujo et al. 2008; Tisné et al. 2010). In a few examples, the increase in duration of leaf expansion compensates the decrease in maximal leaf expansion rate, in such a way that comparison of final leaf areas between the different environmental cues or genotypes does not show any alteration (Cookson
22
et al. 2006; Aguirrezabal et al. 2006). This is also illustrated in Figure I-1 (a), showing two genotypes (Ler and elo-1) reaching the same final leaf 6 area but with different dynamics of leaf expansion. In a similar way, tobacco (Nicotiana tabacum) plants overexpressing the D-type cyclin, CycD2, display no visible leaf phenotypic differences when observed after completion of vegetative growth, but only because they have higher rates and shorter durations of expansion (Cockcroft et al. 2000). In such cases, only the measurement of leaf area over time can highlight the incidence of the environmental change or of the mutation on leaf growth, hence their importance in order to collect information as complete as possible.
3.2. Phenotyping leaf growth over time: late differences can be due to early processes
One limit to the comparison of leaf growth curves is due to the difficulty of measuring early stages of leaf expansion. Precisely measuring the number of initiated leaves requires the careful dissection of the rosettes using a binocular or a microscope at high magnification, removal of the cotyledons and subsequent leaves one by one with a scalpel until all primordia are visible (Cookson et al. 2010). Measuring the leaf initiation rate or the plastochron – the time interval between the emergence of two successive leaves, i.e. the reciprocal of leaf initiation rate – requires sequential destructive measurements over time increasing the number of replicates to be grown together in a single experiment (Cookson et al. 2010). These tasks are even more tedious in A. thaliana than in other plants due to its small size and, as a consequence, quantitative datasets with phenotypic characterization of these variables are often restricted to a limited number of genotypes and/or environmental conditions (Cookson et al. 2005; Skirycz et al. 2010; Vanhaeren et al. 2010).
Even though recent advances in microscopy and image analysis now allow the assessment of early stages of leaf growth from leaf initiation on the meristem until emergence, the throughput of these early measurements is typically low because of the technical constraints associated with destructive measurements and the necessity to grow a high number of plants together for sufficient replicates at each sampling time point (Cookson et al. 2005; Wuyts et al. 2010; Vanhaeren et al. 2010). At the whole plant scale, these methods have shown that subtle differences in shoot apical meristem volumes contribute to subsequent differences in leaf emergence rate and rosette expansion rate (Clark et al. 1995; Vanhaeren et al. 2010). Similarly, at the individual leaf scale, early changes in leaf expansion rate or changes in the initial size of the primordium impact the growth dynamics later on and can alter final leaf size (Granier and Tardieu 2009). This is due to the exponential behaviour of early growth phase in
23
which absolute leaf expansion rate at a given time depends on the leaf area at that time. It is then easy to misinterpret growth curves, as early developmental variation can cause misleading differences in late expansion (Arvidsson et al. 2011; Zhang et al. 2012).
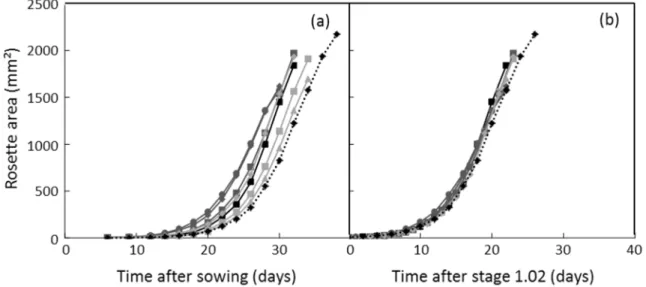
As an example, at the whole plant scale, differences in rosette area observed at a given date after sowing in a set of genotypes (Figure I-3 (a)) are no longer apparent when the x-scale is expressed in ‘days after leaf 2 emergence’ revealing here that differences in leaf area observed throughout the growing period were due to differences in germination rates and/or early development (Figure I-3 (b)). This illustrates that different conclusions can be drawn if the time scale is normalized by developmental stages (Arvidsson et al. 2011; Zhang et al. 2012).It is important to keep in mind that phenotypic differences reported at a given date after sowing can be due to differences in germination rate.
Figure I-3. Dynamics of whole rosette area over time expressed either as days after sowing (a) or days after stage 1.02 (b), i.e. when the second leaf emerged in the center of the rosette. Rosette area was determined on top view images automatically taken in the PHENOPSIS platform (see Figure II-1 (c)). Each point is the mean of 3 plants. From Lièvre et al. 2013.
3.3. Comparing growth of successive leaves along the shoot
In the majority of leaf growth phenotyping studies, conclusions on individual leaf growth are drawn from the comparisons of leaves of same rank, i.e. having the same position on the plant shoot (Figure II-1 (b)). However, as developed in this chapter, section 1, it is known that leaves initiated during different phases of the shoot development display different morphological characteristics, such as final leaf area, leaf blade length-to-width ratio, number and depth of serrations present on the leaf margin and pattern of trichomes covering. This phenomenon, called heteroblasty, is observed among the whole plant kingdom and can be
24
affected by genetics and/or environmental cues (Lawson and Poethig 1995; Kerstetter and Poethig 1998; Sylvester and Parker-Clark 2001; Poethig 2013; Matsoukas 2014). There are also examples showing that when dynamics of expansion are compared among successive leaves of a same plant, it appears that they grow at different rates and that the whole duration of their expansion may also differ (Dosio et al. 2003; Cookson et al. 2007). Those considerations question the relevance of comparing leaves of same rank between two plants that, because of environmental cues or genetic differences, display overall differences in their shoot development, such as in vegetative phase change and/or final number of rosette leaves.
Heteroblasty is often linked with the concept of juvenile and adult vegetative developmental phases in the plant. Although some of the morphological changes within A.
thaliana shoot seem to occur gradually making the distinction between the different phases
subtle, the formation of trichomes on the abaxial face of leaves has been identified as a relevant marker of the onset of the juvenile-to-adult phase transition (Chien and Sussex 1996; Telfer et al. 1997; Kerstetter and Poethig 1998). On A. thaliana leaves, trichomes are specialized cells that taking form of branched ‘hairs’. They are differentiated from a single epidermal cell. It is commonly admitted that the first rosette leaf having at least one trichome on its abaxial surface is the first one that was initiated after the onset of the vegetative phase change. Similarly, the first leaf whose abaxial face is fully and homogeneously covered with trichomes is considered as the first leaf initiated after the phase change was completed and the plant has entered the adult vegetative phase. By using this marker, the identity of each leaf of a rosette can easily be determined, that can give access to information concerning the different phases of a plant vegetative development (Figure I-4). These kinds of inputs are not commonly used in A. thaliana leaf growth phenotyping experiments, whereas it could be interesting to add this data, measured at the individual leaf scale but analyzed as a series along the shoot.
Figure I-4. Patterns of trichomes observed on the abaxial leaf surface of Col-0 plant. The identity of leaves is deduced from these observations. Grey: absence of abaxial trichomes. Black: presence of abaxial trichomes. Adapted from Hunter et al. 2003.
25
4.
AIM AND STRATEGY OF THE PHD
As shown in this chapter, analyzing the plant growth phenotype is complex due to the existence of interactions between processes occurring at different scales, and due to a variation along the shoot of growth traits measured on individual leaves, that is linked to the global phase changes occurring at the shoot level. In this context, the aim of my PhD was to propose and test methods for analyzing such a complexity, considering traits at three different scales of the shoot system: tissue (leaf epidermis), organ (leaf), and shoot (leaf series), as well as their relationship to phase changes in shoot ontogeny. This required development of appropriate statistical methods for integrating different types of data – tissular, morphological, dimensional and dynamics. From a practical point of view, the main challenge of my PhD was to elaborate a functional pipeline of analysis methods for phenotyping plant growth at these three scales, and to help taking into account the effect of leaf position within the shoot.
Our first concern was to acquire proper datasets that were necessary for these analyses: tissular data on successive leaves of a plant, dynamics of leaf expansion of successive leaves on a plant, and morphological and dimensional traits giving insights into the leaf status. Despite the availability of an automated phenotyping platform in the host laboratory and hundreds of genotypes already grown in this platform since 2002, such a dataset was not available at the onset of this work. Consequently, the first part of my work was to acquire datasets at each scale of analyses, with enough replicates for further robust statistical analyses.
To this end, two first experiments were performed on genotypes with contrasted shoot development. Genotypes were selected, on their leaf-growth phenotype contrasts – without any knowledge on the underlying genes controlling these leaf growth differences. We first present a detailed analysis of these genotypes, considering separately the different leaves and the growth variables at the different macroscopic scales, to highlight the contrasts of leaf developmental features(Chapter II).
Subsequently, we built integrated models that allowed a global detection of plant phase changes using all measurements made at different scales, leading to general considerations regarding this matter. Analyzing successions of developmental phases and changes of leaf growth traits within each of these phases allowed us to characterize the effect on shoot development of the selected genotypes mutations (Chapter III).
We then focused on the development of a new pipeline of analysis of tissular data that enables detecting populations of cells in the epidermis. This pipeline combined a
semi-26
automatic method for segmenting leaf epidermis imprints and gamma mixture model used to analyze the obtained cell area distributions (Chapter IV).
Finally, we used one genotype dataset to show how the tissular data that we obtained can be integrated to the multi-scale analysis method. It finalized the integration of the data from the cell to the shoot scale (Chapter V).
27
CHAPTER II. U
SE AND LIMITS OF EXISTING PIPELINE OF
ANALYSES FOR COMPARING LEAF GROWTH PHENOTYPES IN
A.
THALIANA
:
A TEST ON
90
T-DNA
INSERTION LINES
1.
INTRODUCTION
Arabidospsis thaliana (A. thaliana) offers important advantages for researches in genetics
and molecular biology by its relatively small genome size compared to crops (Meinke et al. 1998; AGI 2000). Maize, for example, has a genome of approximately 2,400 Megabase pairs (Mbp), i.e. around 19 times the size of the A. thaliana genome while the wheat genome is 16,000 Mbp, i.e. 128 times larger than the A. thaliana one. Since the completion of the A.
thaliana genome sequence, extensive genetic maps of all 5 chromosomes, together with
efficient methods for mutagenesis and plant transformation have delivered a large range of genetic and genomic resources to the plant biology research community (Alonso et al. 2003; O’Malley and Ecker 2010). Different sources of genetic diversity are exploited in A. thaliana to identify genes controlling many processes involved in plant growth and functioning (see following listing). In many examples, they have allowed to identify genes controlling the development of plant leaf area.
• Natural lines corresponding to different ecotypes with natural variation have been collected by many groups and have been used for Genome Wide Association Mapping (Atwell et al. 2010).
• Recombinant inbred or near isogenic populations have been created by crosses of different ecotypes to produce genetically structured populations that are intensively used to map quantitative trait loci and/or genes controlling shoot growth and developmental processes (Tisné et al. 2008; Méndez-Vigo et al. 2010).
• Mutated lines have been created from wild-type genetic backgrounds in which specific individual genes or small groups of ‘candidate’ genes supposed to be involved in processed associated to leaf growth control are altered via inactivation or over-expression (Cookson et al. 2005; Massonnet et al. 2011).
• Mutated lines have been created from a same reference genetic background in which genes or small groups of genes are altered randomly at random positions along the whole genome (Berna et al. 1999).
28
For our study, we took advantage of the recently distributed collection of T-DNA homozygous A. thaliana mutant lines, originating from the SALK institute. This collection was generated by the group of Prof. J.R. Ecker (Alonso et al. 2003). At the onset of our work, a preliminary high-throughput leaf growth screen was performed in Jose Luis Micol group in Alicante (Elche University). The objective was to systematically search for mutant leaf phenotypes in the whole collection by a simple screening, looking for easily identifiable leaf phenotypes. Over 14,000 lines representing 10,846 genes have been analyzed so far leading to the identification of 255 leaf mutants, including genotypes with altered leaf shape, leaf color and/or leaf area compared to the wild-type. Interestingly, only 15 % of the genes thus identified had been previously described in the literature. This genetic material represents a mine of new information concerning the genetic control of leaf growth. During this first screening, plants were grown in vitro. Leaf phenotype was scored 18 days after sowing (DAS). Qualitative criteria to identify lines with unambiguous different leaf phenotypes compared to the wild-type were: the size of the rosettes compared to the wild-type Columbia (Col-0) – i.e. bigger/smaller – and the visible differences in leaf color and/or shape (n = 30); see Wilson-Sánchez et al. 2014 and poster by Micol et al. (International Conference on Arabidopsis Research, ICAR 2012) in Appendix VIII.
Our first objective at the onset of this work was to select a few A. thaliana genotypes with contrasted leaf development from the experiment performed in Jose Luis Micol group to develop our pipeline of analyses. Two preliminary experiments (thereafter referred as Experiments 1 and 2) were performed using routine phenotyping methods developed in LEPSE (Cookson et al. 2010) on 90 SALK mutants (issued from the 255 leaf mutants identified by Jose Luis Micol group). Different leaf growth variables were measured 18 days after sowing (as done in Jose Luis Micol group experiment) and at flowering (as usually done in LEPSE experiments) to identify genotypes with contrasted leaf production and/or leaf expansion. The main results of these experiments were presented at the ICAR 2012 (see poster by Lièvre et al. in Appendix VII). Afterwards, a subset of 4 contrasted genotypes was selected from Experiments 1 and 2, for a more in depth study (Experiment 3) with more replicates per genotype. Additional leaf growth traits were measured during this experiment, in order to obtain a more complete overview of the plants shoot growth. As it has been reported in angiosperms, A. thaliana shoot development involves at least three distinct post-embryonic phases: a reproductively incompetent phase (i.e. juvenile vegetative phase), a reproductively competent (i.e. adult vegetative phase) and a reproductive phase (Poethig 2003). The juvenile-to-adult transition (vegetative phase change) involves changes in several
29
leaf traits such as patterns of abaxial trichomes production, number of serrations, length-to-width ratio of the leaf blade and size of the petiole and leaf blade (Röbbelen 1957; Telfer et al. 1997; Steynen et al. 2001; Méndez-Vigo et al. 2010). The presence of trichomes on the abaxial face of the leaf is the clearest marker of the onset of the vegetative phase change, so we added this trait to the growth measurements performed in Experiment 3. To complete the overview of A. thaliana shoot growth, individual leaf expansion curves were also measured.
This chapter presents the multi-scale phenotyping analyses performed on the 90 SALK T-DNA lines and their wild-type, the selection of 4 contrasted genotypes and the more detailed phenotypical analysis of these 4 genotypes which constitute the baseline dataset used in Chapter III for the development of our pipeline of analysis methods.
2.
MATERIAL AND METHODS
2.1. Biological material
The 90 T-DNA insertion lines used in the Experiments 1 and 2 are listed in Appendix I. Seeds used were kind gifts from José Luis Micol group. All of them are SALK mutants issued from the Columbia 0 (Col-0) genetic background. They are homozygous lines as checked by José Luis Micol group.
2.2. Growth conditions
The 3 experiments were performed in a growth chamber equipped with the PHENOPSIS automaton (Granier et al. 2006), under controlled air temperature, air humidity and incident light. For the 2 first experiments, 14 plants of each line (SALK lines and Col-0) were grown together. Experiment 3 was designed to build solid analysis models from the generated data. For this purpose, the number of replicates per genotype was increased up to 60 plants. Seeds were sown in pots filled with a mixture (1:1) of a loamy soil and organic compost. Micrometeorological conditions were kept constant during the whole duration of the experiments and homogeneous within the growth chamber (Granier et al. 2006). Light was on during 16 h per day and provided by a bank of cool-white fluorescent tubes and HQi lamps. It was measured at the plant level using a photosynthetic photon flux density (PPFD) sensor (LI-190SB, Li-Cor, Lincoln, NE, USA). Mean micro-meteorological conditions were constant over the whole duration of experiments and are indicated in Table II-1. Soil water content was determined before sowing to estimate the amount of dry soil in each pot. Subsequent changes
30
in pot weight were due to changes in soil water content (the plant weight was considered as negligible as it was never higher than 1 g). This allowed the computation and daily automatic adjustment of soil water content to 0.35 g water g-1 dry soil by the PHENOPSIS automaton (Granier et al. 2006) with a modified one-tenth-strength Hoagland solution (Hoagland and Arnon 1950), from sowing to the end of the experiments.
Experiment 1 Experiment 2 Experiment 3 Day length (h)
Incident PPFD (µmol photons m-2 s-1) Air temperature (°C)
Air humidity (%)
Soil water content (g H2O g -1 dry soil) 16 176 21.9 61.4 0.35 16 175 22.2 59.6 0.35 16 178 20.4 60.6 0.35
Table II-1. Meteorological conditions applied during the experiments.
2.3. Growth measurements
During the three experiments, daily zenithal pictures were taken by the PHENOPSIS automaton (Figure II-1 (b)) during rosette growth.
For the first two experiments, 7 plants of each genotype were harvested 18 days after sowing whereas the remaining 7 others were harvested at a common stage of plant development, stage 6.00, i.e. first flower open (as defined in Boyes et al. 2001). All leaves that formed the rosette had stopped their expansion at this stage.
At harvesting, rosette fresh weight (without root system or flowering axes) was measured (mg). Then, successive true leaves of the rosette (cotyledons were excluded) were excised without their petiole, stuck on a sheet of paper and scanned as shown in Figure II-1 (a). Individual leaf areas (mm²) were automatically measured with image analysis software ImageJ (Rasband , National Institutes of Health, USA). Final rosette area (mm²) was computed as the sum of individual leaf areas. The number of rosette leaves was estimated by counting the number of true leaves produced after the production of the cotyledons until the emergence of the primary flowering axis. In Experiments 1 and 2, duration of the vegetative phase was determined as the time elapsed between the sowing date and the emergence of the inflorescence, i.e. the bolting stage. This stage was determined by naked-eye on daily zenithal images taken by the PHENOPSIS automaton. In Experiment 3, in order to overcome possible differences in germination time, duration of the vegetative phase was determined as the time elapsed between the apparition of the first true pair of leaves and the apparition of the last
31
rosette leaf. Mean leaf apparition rate (leaf day-1) was computed as the final number of rosette leaves divided by the duration of vegetative phase.
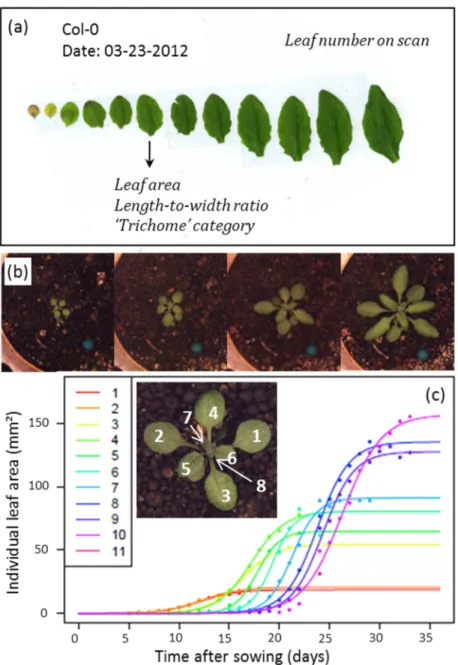
Figure II-1. Different types of images taken during the experiments are shown with associated leaf growth traits. (a) Scan of a dissected rosette after harvest, with different growth traits measured (destructive measurements). (b) Zenithal images taken by the PHENOPSIS automaton. (c) Changes in individual leaf areas can be measured on zenithal images (non-destructive measurements). When changes in individual leaf areas are plotted over time, sigmoids can be fitted on these data. Inset: close-up of a zenithal image of a rosette with respective leaf ranks (indicated per order of apparition).
32
Additional measurements were performed on the plants grown during Experiment 3. In addition to individual leaf area, maximal leaf blade length (mm) and width (mm) were automatically measured on the leaf scans using the image analysis software ImageJ 1.43C and blade length-to-width ratio was computed. In addition leaf abaxial surface was observed under a binocular (X10) for each successive leaves just before they were scanned to identify those with or without trichomes. Rosette leaves were divided into three categories depending on the level of covering of their abaxial surface by trichomes. Based on the literature (Telfer et al. 1997; Bollman et al. 2003), leaves without abaxial trichomes were classified as juvenile leaves, leaves with trichomes (at least one) that did not entirely span their abaxial surface as transition leaves (trichomes were not distributed homogeneously over the lamina but mainly present at the base of the leaf), and leaves with trichomes that span their entire abaxial surface (trichomes distributed homogeneously and at least one within 2 mm of the leaf margin of the distal tip) as adult leaves. To limit possible stochastic effects, the subsequent leaves on the shoot had to meet the same criterion or to correspond to the next leaf category.
Projected individual leaf areas were measured using image analysis software ImageJ on the daily zenithal pictures of the rosette taken by the PHENOPSIS automaton by drawing the visible part of leaf blade. Petioles were not included in the measurement. In case of overlap between leaves making a leaf contour too uncertain to be drawn, or when a leaf had revolute margins (phenomenon of leaf curling) at a point where about 50 % or more of the leaf area was hidden, the leaf was not measured. The measured areas were used to estimate individual leaf expansion curves. To do this estimation we chose a nonlinear logistic regression model as the curves seemed to have a sigmoidal shape with a certain symmetry at the inflection point (Torres and Frutos 1989). The parametric sigmoid function used was
} / ) ( { exp 1 t M B A Y − − + =
where A is the value of the sigmoid curve plateau – i.e. the estimated final value of the leaf area; B is a characteristic growth time parameter (inverse of growth rate); and M is the time corresponding to the inflection point of the sigmoid curve (time of maximum growth). Figure II-1 (c) shows a collection of estimated logistic functions for successive leaves from leaf areas measured during the plant growth. However, because of overlapping and leaf curling phenomena, the estimated final leaf area was frequently under-estimated in comparison to the measurement made when the plants were harvested and the leaves separated and stuck on a sheet of paper for scan measurements. This bias increased with leaf rank (because the last
33
leaves emerged were the most revolute) and with leaf expansion (increase of the overlap between leaves). To our knowledge, there is no model enabling to this bias. Our objective was not to study precisely leaf expansion kinetics but rather to compare expansion curves; we therefore identified a method to compute a corrected dynamical variable that would enable a relevant analysis of leaf expansion kinetics from a comparative point of view. We assumed that the biased estimation of the final leaf surface within the logistic growth model does not affect substantially the estimation of the characteristic growth duration or of the time of maximum growth. It allowed us to compute each leaf maximum absolute leaf expansion rate (LERmax, mm² day-1) using the characteristic growth duration parameter B estimated using leaf areas measured on zenithal rosette pictures and the corresponding final leaf area obtained by dissecting the rosette after harvest (unbiased final leaf area, LA):
LER LA 4"⁄
2.4. Statistical analyses
All statistical analyses were done using R software (R Core Team 2014). The normality of each variable distribution was evaluated for each genotype using Shapiro-Wilk test. Homogeneity of variances between genotypes was tested for each variable using Levene tests. Differences between Columbia 0 and mutant lines computed means were tested for each variable using Student t-tests. Linear regression between leaf growth variables were estimated on the whole data. Pearson correlation coefficients were computed and their significance was tested using the associated R function.
3.
RESULTS
3.1. Lines with contrasted leaf phenotypes could not be identified robustly when leaf growth variables were compared 18 days after sowing
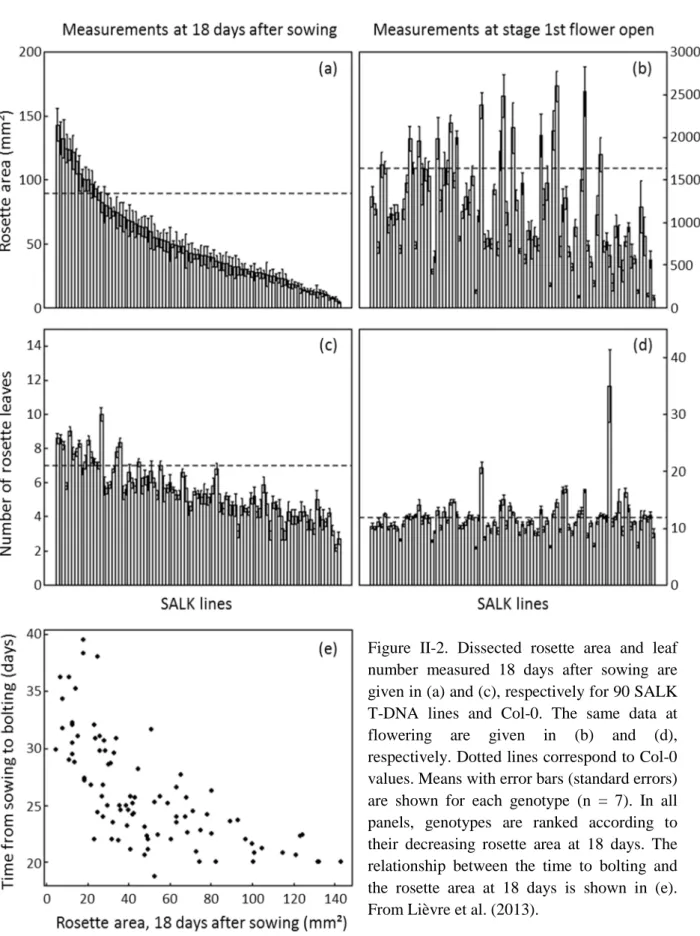
When the set of 91 genotypes grown together was classified according to total rosette area or number of leaves 18 days after sowing (Figure II-2 (a) and (b)), the ranking did not reflect what was observed at flowering when rosette development was completed (Figure II-2 (c) and (d)). Interestingly, in this dataset a negative non-linear correlation was found between rosette area measured 18 days after sowing and the duration of leaf production estimated as the number of days between the sowing date and bolting (Figure II-2 (e)). The latter stage is defined as the emergence of the inflorescence in the center of the rosette, just after the last rosette leaf has emerged (Boyes et al. 2001). This illustrates that rosettes expanding rapidly
34
early in development have a tendency to stop producing leaves and transit to the reproductive phase earlier than those that expand more slowly in the beginning of their development (Figure II-2 (e)). They therefore do not necessarily have a larger final leaf area (Figure II-2 (d)).
Figure II-2. Dissected rosette area and leaf number measured 18 days after sowing are given in (a) and (c), respectively for 90 SALK T-DNA lines and Col-0. The same data at flowering are given in (b) and (d), respectively. Dotted lines correspond to Col-0 values. Means with error bars (standard errors) are shown for each genotype (n = 7). In all panels, genotypes are ranked according to their decreasing rosette area at 18 days. The relationship between the time to bolting and the rosette area at 18 days is shown in (e). From Lièvre et al. (2013).
35
3.2. Many lines were affected on the different growth variables measured at the opening of the first flower when compared to the wild-type
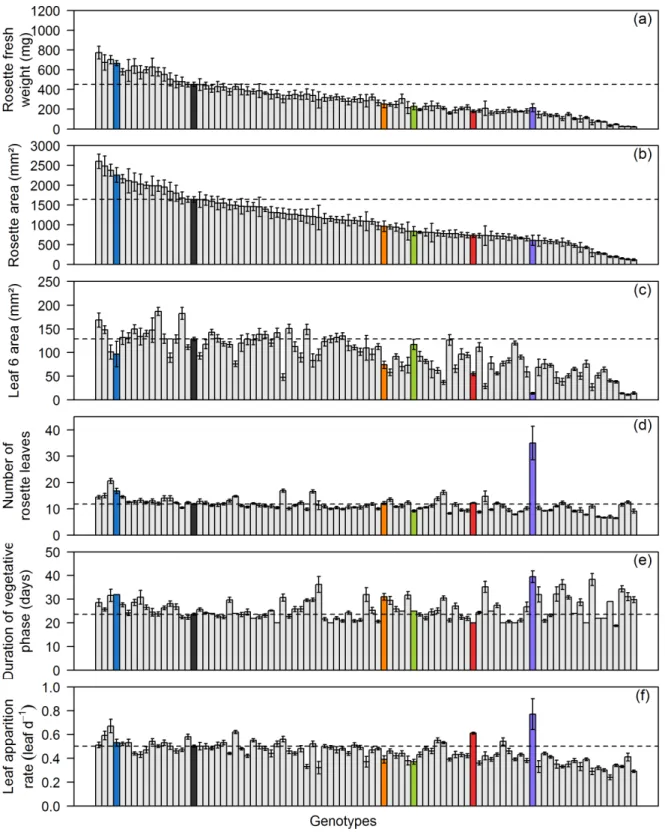
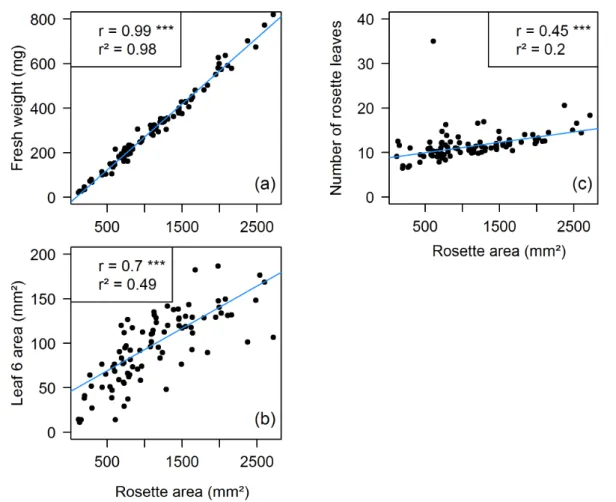
Fresh weight and rosette area were affected in the same way for the majority of the lines. Fresh weight of the rosette, measured at flowering, significantly differed from that of the wild-type (Col-0) in 66 lines. It was increased in only 7 of them and smaller in the remaining 59 (Figure II-3 (a)). The results obtained for final rosette area were almost the same: it was significantly larger in the same 7 genotypes and smaller in the remaining 58 lines for which significant differences from Col-0 rosette area was found (Figure II-3 (b)). Two T-DNA lines had significant differences in comparison to Col-0 fresh weight value but not in rosette area data (SALK_145203 and SALK_122867). On the contrary, only 1 line exhibited a significantly smaller rosette area without having a decrease in rosette fresh weight (SALK_024759). Figure II-4 (a) shows the strong correlation found between these two variables.
Final leaf 6 area was affected in a fewer lines than the above-described traits: 52 lines exhibited a significant difference in comparison with Col-0. Three genotypes displayed a larger leaf 6 area, whereas it was reduced for the other 49 (Figure II-3 (c)).
The final number of rosette leaves was the less affected among the analyzed traits. Significant differences with Col-0 mean number of rosette leaves (12) were found for only 44 T-DNA lines, 12 of which had an increased number of leaves. Among these 12 genotypes, 8 also exhibited larger rosette area, whereas 29 of the 32 lines with reduced number of leaves also had decreased final rosette area. It illustrates the positive correlation existing between these two traits (Figure II-4 (c) and (d)).
Three T-DNA lines presented a compensation phenomenon between significant alterations in their leaf 6 area and number of rosette leaves, leading to a final rosette area showing no significant difference compared to Col-0 one. Two of them (SALK_086630 and SALK_129352) displayed smaller leaf 6 area coupled with an increased number of rosette leaves, whereas the other one (SALK_018664) had on the contrary larger individual leaf area and a lower final number of leaves.
36
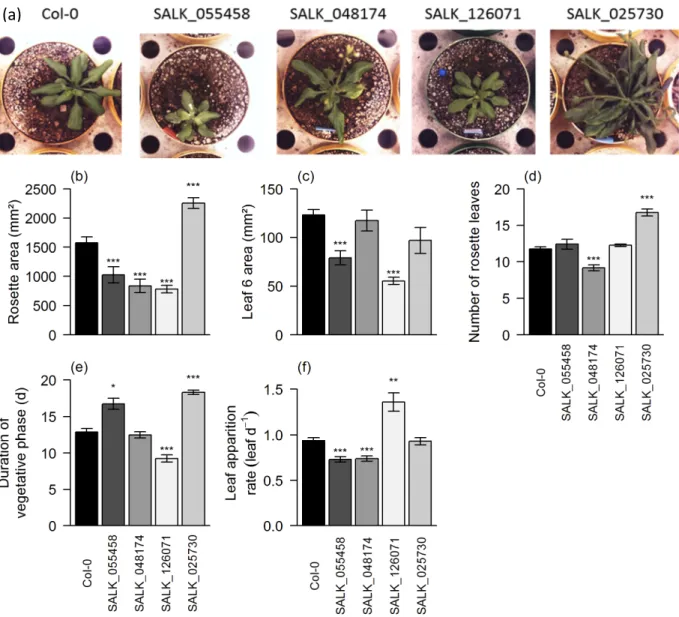
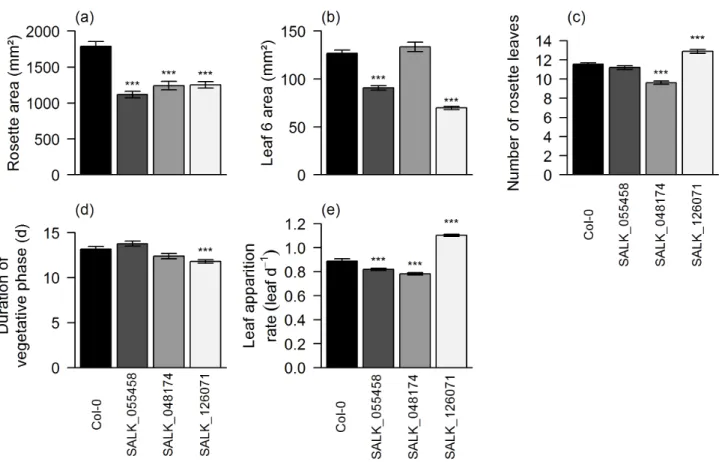
Figure II-3. Fresh weight of the rosette (mg; (a)), dissected rosette area (mm²; (b)), leaf 6 area (mm²; (c)), number of rosette leaves (d), duration of vegetative phase (days after sowing; (e)) and mean leaf apparition rate (leaf day-1; (f)) are given for 90 SALK T-DNA lines and Col-0 grown during Experiments 1 and 2. The first 4 traits were measured at flowering whereas the two others are the components of leaf apparition dynamics and were computed over time (see material and methods). Dotted lines and dark gray bars correspond to Col-0 values. Means with standard deviation are shown for each genotype (n = 7). In all panels, genotypes are ranked according to their decreasing rosette area at flowering. Five lines that have an interest for our in depth study are identified by colored bars: SALK_025730, blue; SALK_055458, orange; SALK_048174, green; SALK_126071, red; SALK_064915, purple.
37
Concerning the dynamics of leaf apparition, more lines were affected in duration of vegetative phase than in mean rate of leaf apparition (respectively 57 and 49 with significant differences in comparison to Col-0, Figure II-3 (e) and (f)). The duration of vegetative phase was mostly extended compared to Col-0 (38 lines) whereas mean leaf apparition rate was mainly reduced in altered T-DNA lines compared to Col-0 (42 lines).
Opposite alterations in leaf apparition dynamics led to a compensation phenomenon regarding the final number of rosette leaves, which was no significantly different compared to Col-0 for 18 lines that yet exhibited significant changes in their leaf apparition dynamics. For examples, see SALK_009798 or SALK_136507 for extended vegetative phase with lower leaf apparition rate. SALK_126071 and SALK_145203 are the only two lines showing the opposite type of compensation.
Figure II-4. Linear relationships between rosette area (mm²) and (a) fresh weight (mg) of the rosette; (b) leaf 6 area (mm²); (c) number of rosette leaves with all T-DNA lines. Correlations were estimated using the values measured at flowering on the plants grown during Experiments 1 and 2. For greater readability, on the graphs each point represents the mean data for a genotype (n = 7). The linear relationships estimated between the variables are represented by a blue line. r, Pearson correlation coefficient. r², coefficient of determination. ***, p-value < 0.001.