RESEARCH OUTPUTS / RÉSULTATS DE RECHERCHE
Author(s) - Auteur(s) :
Publication date - Date de publication :
Permanent link - Permalien :
Rights / License - Licence de droit d’auteur :
Bibliothèque Universitaire Moretus Plantin
Institutional Repository - Research Portal
Dépôt Institutionnel - Portail de la Recherche
researchportal.unamur.be
University of Namur
Multiscale mixing patterns in networks
Peel, Leto; Delvenne, Jean Charles; Lambiotte, Renaud
Published in:
Proceedings of the National Academy of Sciences of the United States of America
DOI:
10.1073/pnas.1713019115
Publication date:
2018
Document Version
Publisher's PDF, also known as Version of record
Link to publication
Citation for pulished version (HARVARD):
Peel, L, Delvenne, JC & Lambiotte, R 2018, 'Multiscale mixing patterns in networks', Proceedings of the National
Academy of Sciences of the United States of America, vol. 115, no. 16, pp. 4057-4062.
https://doi.org/10.1073/pnas.1713019115
General rights
Copyright and moral rights for the publications made accessible in the public portal are retained by the authors and/or other copyright owners and it is a condition of accessing publications that users recognise and abide by the legal requirements associated with these rights. • Users may download and print one copy of any publication from the public portal for the purpose of private study or research. • You may not further distribute the material or use it for any profit-making activity or commercial gain
• You may freely distribute the URL identifying the publication in the public portal ?
Take down policy
If you believe that this document breaches copyright please contact us providing details, and we will remove access to the work immediately and investigate your claim.
APPLIED
MATHEMATICS
Multiscale mixing patterns in networks
Leto Peela,b,1, Jean-Charles Delvennea,c,1, and Renaud Lambiotted,1
aInstitute of Information and Communication Technologies, Electronics and Applied Mathematics (ICTEAM), Universit ´e Catholique de Louvain,
Louvain-la-Neuve B-1348, Belgium;bNamur Institute for Complex Systems (naXys), Universit ´e de Namur, Namur B-5000, Belgium;cCenter for Operations
Research and Econometrics (CORE), Universit ´e Catholique de Louvain, Louvain-la-Neuve B-1348, Belgium; anddMathematical Institute, University of
Oxford, Oxford OX2 6GG, United Kingdom
Edited by Kenneth W. Wachter, University of California, Berkeley, CA, and approved March 1, 2018 (received for review July 21, 2017)
Assortative mixing in networks is the tendency for nodes with the same attributes, or metadata, to link to each other. It is a property often found in social networks, manifesting as a higher tendency of links occurring between people of the same age, race, or politi-cal belief. Quantifying the level of assortativity or disassortativity (the preference of linking to nodes with different attributes) can shed light on the organization of complex networks. It is com-mon practice to measure the level of assortativity according to the assortativity coefficient, or modularity in the case of categori-cal metadata. This global value is the average level of assortativity across the network and may not be a representative statistic when mixing patterns are heterogeneous. For example, a social network spanning the globe may exhibit local differences in mixing pat-terns as a consequence of differences in cultural norms. Here, we introduce an approach to localize this global measure so that we can describe the assortativity, across multiple scales, at the node level. Consequently, we are able to capture and qualitatively eval-uate the distribution of mixing patterns in the network. We find that, for many real-world networks, the distribution of assorta-tivity is skewed, overdispersed, and multimodal. Our method pro-vides a clearer lens through which we can more closely examine mixing patterns in networks.
complex networks | assortativity | multiscale | node metadata
N
etworks are used as a common representation for a wide variety of complex systems, spanning social (1–3), biological (4, 5), and technological (6, 7) domains. Nodes are used to rep-resent entities or components of the system, and links between them are used to indicate pairwise interactions. The link for-mation processes in these systems are still largely unknown, but the broad variety of observed structures suggests that they are diverse. One approach to characterize the network structure is based on the correlation, or assortative mixing, of node attributes (or “metadata”) across edges. This analysis allows us to make gen-eralizations about whether we are more likely to observe links between nodes with the same characteristics (assortativity) or between those with different ones (disassortativity). Social net-works frequently contain positive correlations of attribute val-ues across connections (8). These correlations occur as a result of the complementary processes of selection (or “homophily”) and influence (or “contagion”) (9). For example, assortativity has frequently been observed with respect to age, race, and social status (10), as well as behavioral patterns such as smoking and drinking habits (11, 12). Examples of disassortative networks include heterosexual dating networks (gender), ecological food webs (metabolic category), and technological and biological net-works (node degree) (13). It is important to note that, just as cor-relation does not imply causation, observations of assortativity are insufficient to imply a specific generative process for the network. The standard approach to quantifying the level of assortativ-ity in a network is by calculating the assortativassortativ-ity coefficient (13). Such a summary statistic is useful to capture the average mixing pattern across the whole network. However, such a generaliza-tion is only really meaningful if it is representative of the popu-lation of nodes in the network, i.e., if the assortativity of most individuals is concentrated around the mean. However, whennetworks are heterogeneous and contain diverse mixing patterns, a single global measure may not present an accurate descrip-tion. Furthermore, it does not provide a means for quantify-ing the diversity or identifyquantify-ing anomalous or outlier patterns of interaction.
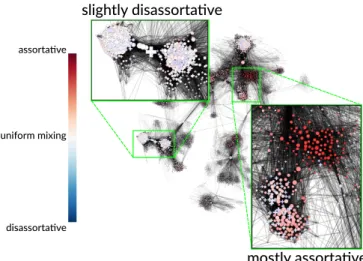
Quantifying diversity and measuring how mixing may vary across a network becomes a particularly pertinent issue with modern advances in technology that have enabled us to capture, store, and process massive-scale networks. Previously, social interaction data were collected via time-consuming manual pro-cesses of conducting surveys or observations. For practical rea-sons, these were often limited to a specific organization or group (1, 2, 15, 16). Summarizing the pattern of assortative mixing as a single value may be reasonable for these small-scale net-works that tend to focus on a single social dimension (e.g., a specific working environment or common interest). Now, tech-nology such as online social media platforms allow for the auto-matic collection of increasingly larger amounts of social interac-tion data. For instance, the largest connected component of the Facebook network was previously reported to account for ∼10% of the global population (17). These vast multidimensional social networks present more opportunities for heterogeneous mixing patterns, which could conceivably arise, for example, due to dif-ferences in demographic and cultural backgrounds. Fig. 1 shows, using the methods we will introduce, an example of this variation in mixing on a subset of nodes in the Facebook social network (14). A high variation in mixing patterns indicates that the global assortativity may be a poor representation of the entire popula-tion. To address this issue, we develop a node-centric measure of
Significance
A central theme of network science is the heterogeneity present in real-life systems, for instance through the absence of a characteristic degree for the nodes. Despite their small-worldness, networks may present other types of heteroge-neous patterns, with different parts of the network exhibit-ing different behaviors. Here we focus on assortativity, a net-work analogue of correlation used to describe how the pres-ence and abspres-ence of edges covaries with the properties of nodes. We design a method to characterize the heterogene-ity and local variations of assortativheterogene-ity within a network and exhibit, in a variety of empirical data, rich mixing patterns that would be obscured by summarizing assortativity with a single statistic.
Author contributions: L.P., J.-C.D., and R.L. designed research; L.P. analyzed data; and L.P., J.-C.D., and R.L. wrote the paper.
The authors declare no conflict of interest. This article is a PNAS Direct Submission.
This open access article is distributed under Creative Commons Attribution-NonCommercial-NoDerivatives License 4.0 (CC BY-NC-ND).
1To whom correspondence may be addressed: Email: [email protected],
[email protected], or [email protected].
This article contains supporting information online atwww.pnas.org/lookup/suppl/doi:10. 1073/pnas.1713019115/-/DCSupplemental.
Fig. 1. Local assortativity of gender in a sample of Facebook friendships (14). Different regions of the graph exhibit strikingly different patterns, sug-gesting that a single variable, e.g., global assortativity, would provide a poor description of the system.
the assortativity within a local neighborhood. Varying the size of the neighborhood allows us to interpolate from the mixing pat-tern between an individual node and its neighbors to the global assortativity coefficient. In a number of real-world networks, we find that the global assortativity is not representative of the col-lective patterns of mixing.
1. Mixing in Networks
Currently, the standard approach to measure the propensity of links to occur between similar nodes is to use the assortativity coefficient introduced by Newman (13). Here we will focus on undirected networks and categorical node attributes, but assor-tativity and the methods we propose naturally extend to directed networks and scalar attributes (Supporting Information).
The global assortativity coefficient rglobal for categorical
attri-butes compares the proportion of links connecting nodes with same attribute value, or type, relative to the proportion expected if the edges in the network were randomly rewired. The differ-ence between these proportions is commonly known as modu-larity Q, a measure frequently used in the task of community detection (18). The assortativity coefficient is normalized such that rglobal= 1if all edges only connect nodes of the same type
(i.e., maximum modularity Qmax) and rglobal= 0if the number of
edges is equal to the expected number for a randomly rewired network in which the total number of edges incident on each type of node is held constant. The global assortativity rglobal is given
by (13) rglobal= Q Qmax = P gegg− P ga 2 g 1 −P gag2 , [1]
in which egh is half the proportion of edges in the network that
connect nodes with type yi= gto nodes with type yj= h(or the
proportion of edges if g = h) and ag=Phegh=Pi∈gki/2m is
the sum of degrees (ki) of nodes with type g, normalized by twice
the number of edges, m. We calculate eghas
egh= 1 2m X i:yi=g X j :yj=h Aij, [2]
where Aijis an element of the adjacency matrix. The
normaliza-tion constant Qmax= 1 −Pga 2
gensures that the assortativity
coef-ficient lies in the range −1 ≤ r ≤ 1 (seeSupporting Information).
Local Patterns of Mixing.The summary statistic rglobal describes
the average mixing pattern over the whole network. However, as with all summary statistics, there may be cases where it pro-vides a poor representation of the network, e.g., if the network contains localized heterogeneous patterns. Fig. 2 illustrates an analogy to Anscombe’s quartet of bivariate datasets with iden-tical correlation coefficients (19). Each of the five networks in
A
B
C
D
E
Fig. 2. Five networks (Top) of n = 40 nodes and m = 160 edges with the same global assortativity rglobal=0, but with different local mixing patterns
generated by varying how edges are assigned across subgroups of node types (Middle). The different local mixing patterns can be seen by the distributions of rmulti(Bottom). In A, the mixing pattern is homogeneous across all nodes, and this is reflected in the distribution of rmultiby a unimodal distribution that
is peaked around 0. In B–E, there are different heterogeneous mixing patterns, with E being the most extreme case in which half the nodes are highly assortative and half the nodes are highly disassortative. These differences can be observed in the different distributions of rmulti.
APPLIED
MATHEMATICS
the top row have the same number of nodes (n = 40) and edges (m = 160) and have been constructed to have the same rglobal
with respect to a binary attribute, indicated by a cross (c) or a dia-mond (d ). All five networks have mcc+ mdd= 80edges between
nodes of the same type and mcd= 80edges between nodes of
different types, such that each has rglobal= 0. Local patterns of
mixing are formed by splitting each of the types {c, d } further into two equally sized subgroups {c1, c2, d1, d2}. The middle row
depicts the placement of edges within and between the four sub-groups. Distributing edges uniformly between subgroups creates a network with homogeneous mixing (Fig. 2A).
We propose a local measure of assortativity r (`) that captures the mixing pattern within the local neighborhood of a given node of interest `. Trivially, one could calculate the local assortativity by adjusting Eq. 1 to only consider the immediate neighbors of `. However, this approach can encounter problems. For nodes with low degree, we would be calculating assortativity based only on a small sample, providing a potentially poor estimate of the node’s mixing preference. Also, when all of `’s neighbors are of the same type, then we would assign r (`) = ∞ because 1 −P
ga 2 g= 0.
We face similar issues in time series analysis when we wish to interpret how a noisy signal varies over time. Direct analy-sis of the series may be more descriptive of the noise process than of the underlying signal we are interested in. Averaging over the whole series provides an accurate estimate of the mean, but treats all variation as noise and ignores any important trends. A common solution to this problem is to use a local filter such as the exponential weighted moving average, in which values far-ther in time from the point of interest are weighted less. We adopt a similar strategy in calculating the local assortativity. To make the connection with time series analysis concrete, we define a random time series where each value is the attribute yi of a
node i visited in a random walk on the graph. A simple ran-dom walker at node i jumps to node j by selecting an outgoing edge with equal probability, Aij/ki, and, in an undirected
net-work, the stationary probability πi= ki/2mof being at node i is
proportional to its degree. Then, every edge of the network is tra-versed in each direction with equal probability πiAij/ki= 1/2m.
In this context, a key observation is that we can equivalently rewrite Eq. 2 as egh= X i:yi=g X j :yj=h πi Aij ki , [3]
which is the total probability that a simple random walker will jump from a node with type g to one with type h. We can then
interpret the global assortativity of the network as the autocorre-lation (with time lag of 1) of this random time series (seeSI Text,
section Dfor details).
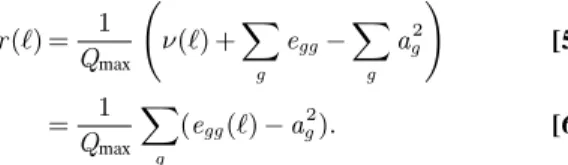
Global assortativity counts all edges in the network equally, just as the stationary random walker visits all edges with equal probability. To create our local measure of assortativity, we instead reweight the edges in the network based on how local they are to the node of interest, `. We do so by replacing the stationary distribution π in Eq. 3 with an alternative distribution over the nodes w (i ; `),
egh(`) = X i:yi=g X j :yj=h w (i ; `)Aij ki , [4]
and compare the proportion of links between nodes of the same type in the local neighborhood to the global value ν(`) = P
g(egg(`) − egg). Then we can calculate the local assortativity
as the deviation from the global assortativity, r (`) = 1 Qmax ν(`) +X g egg− X g ag2 ! [5] = 1 Qmax X g (egg(`) − ag2). [6]
All that remains is to define a distribution w (i ; `). We choose the well-known personalized PageRank vector, the stationary distri-bution wα(i ; `)of a simple random walk, modified so that, at
each time step, we return to the node of interest ` with probabil-ity (1 − α) (Fig. 3A). In the special case of a network consisting of nodes linked in a line, wα(i ; `)corresponds to an exponential
distribution (Fig. 3B) and is analogous to the previously men-tioned exponential filter commonly used in time series analysis. The personalized PageRank vector is an intuitive choice, given its role in local community detection (20) and connections to the stochastic block model (21). It is, however, not the only way to define a local neighborhood [e.g., a number of graph kernels may be suitable (22)].
We can now calculate a local assortativity rα(`)for each node
and use α to interpolate from the trivial local neighborhood assortativity (α = 0, the random walker never leaves the ini-tial node) to the global assortativity (α = 1, the random walker never restarts) r1(`) = rglobal (Fig. 3C). We can also view this
local assortativity as a (normalized) autocovariance of the ran-dom time series of node attributes, defined as before but now
A
B
C
Fig. 3. Example of the local assortativity measure for categorical attributes. (A) Assortativity is calculated (as in Eq. 1) according to the actual proportion of links in the network connecting nodes of the same type relative to the expected proportion of links between nodes of the same type. (B) The nodes in the network are weighted according to a random walk with restart probability of 1 − α. (C) An example of the local assortativity applied to a simple line network with two types of nodes: yellow or green. The blue bars show the stationary distribution (w(i; `)) of the random walk with restarts at ` for different values of α. Underneath each distribution, the nodes in the line network are colored according to their local assortativity value.
generated by a stationary random walker with restarts and only when traversing edges of the original network.
Choice of α. We can use α to interpolate from the global mea-sure at α = 1 to the local meamea-sure based only on the neighbors of ` when α = 0. As previously mentioned, either extreme can be problematic: r1is uniform across network, while r0may be based
on a small sample (particularly in the case of low degree nodes) and therefore subject to overfitting. Moreover, both extremes are blind to the possible existence of coherent regions of assortativity inside the network, as r1considers the network as a whole, while
r0considers the local assortativities of the nodes as independent
entities.
To circumvent these issues, we consider calculating the assor-tativity across multiple scales by calculating a “multiscale” distribution wmulti by integrating over all possible values of
α(23),
wmulti(i ; `) =
Z 1
0
wα(i ; `)dα, [7]
which is effectively the same as treating α as an unknown with a uniform prior distribution (see Supporting Information for details). Using this distribution, we can calculate a multiscale measure rmulti that captures the assortativity of a given node
across all scales.
As a simple demonstration, we return to Fig. 2 in which the distribution of rmultifor each synthetic network is shown in the
bottom row. We see, under homogeneous mixing (Fig. 2A), a uni-modal distribution peaked around 0, confirming that the global measure rglobalis representative of the mixing patterns in the
net-work. However, when mixing is heterogeneous (Fig. 2 B–E), we observe multimodal distributions of rmultithat allow us to
disam-biguate between different local mixing patterns. 2. Real Networks
Next we use rmulti to evaluate the mixing patterns in some real
networks: an ecological network and set of online social net-works. In both cases, nodes have multiple attributes assigned to them, providing different dimensions of analysis.
Weddell Sea Food Web. We first examine a network of ecologi-cal consumer interactions between species dwelling in the Wed-dell Sea (4). Fig. 4 shows the distributions (green) of local assortativity for five different categorical node attributes. For comparison, we present a null distribution (black) obtained by randomly rewiring the edges such that the attribute values, degree sequence, and global assortativity are all preserved (see
Supporting Information). In each case, we observe skewed and/or
multimodal distributions. The empirical distributions appear overdispersed compared with the null distributions.
It may be surprising to see that, for some attributes, the null distribution appears to be multimodal. Closer inspection reveals that the different modes are correlated with the attribute values and that multimodality arises from the unbalanced distribution
of nodes and incident edges across different node types. This effect is particularly pronounced for the attribute “Metabolic Category,” for which we observe two distinct peaks in the dis-tribution. The larger peak that occurs around rmulti≈ 0
repre-sents all species that belong to the metabolic category “plant” and accounts for the majority (348/492) of the species in the net-work, upon which approximately two-thirds of the edges are inci-dent. This bias in the distribution of edges across the different node types means that randomly assigned edges are more likely to connect two nodes of the majority class than any other pair of nodes. In fact, it is impossible to assign edges such that nodes in each Metabolic Category exhibit (approximately) the same assor-tativity as the global value. Specifically, to achieve rglobal= −0.13,
it is necessary that more than half of the edges connect species from different metabolic categories. However, this is impossible for the plant category without changing the distribution of edges over categories.
Facebook 100. We next consider a set of online social networks collected from the Facebook social media platform at a time when it was only open to 100 US universities (3). The process of incrementally providing these universities access to the plat-form meant that, at this point in time, very few links existed between each of the universities’ networks, which provides the opportunities to study each of these social systems in a rel-atively independent manner. One of the original studies on this dataset examined the assortativity of each demographic attribute in each of the networks (3). This study found some common patterns that occurred in many of the networks, such as a tendency to be assortative by matriculation year and dor-mitory of residence, with some variation around the magnitude of assortativity for each of the attributes across the different universities.
In this case, it makes sense to analyze the universities sepa-rately, since it is reasonable to assume that university member-ship played an important and restricting role in the organization of the network. However, a modern version of this dataset might contain a higher density of interuniversity links, making it less reasonable to treat them independently; in general, partitioning networks based on attributes without careful considerations can be problematic (24).
Fig. 5 depicts the distributions of rmulti for each of the 100
networks according to dormitory. For many of the networks, we observe a positively skewed distribution. The surrounding sub-plots show details for four universities with approximately the same global assortativity rglobal≈ 0.13, but with qualitatively
dif-ferent distributions of rmulti. Common across these distributions
is that all of the empirical distributions exhibit a positive skew beyond that of the null distribution. Closer inspection reveals that, in all four networks, the nodes associated with a higher local assortativity belong to a community of nodes more loosely con-nected to the rest of the network. These nodes also correspond to first-year students, which suggests that residence is more relevant to friendship among new students than it is for the rest of the stu-dent body. We see this pattern in many of the other schools too:
Fig. 4. Multiscale assortativity for different attributes in the Weddell Sea Food Web. The observed distribution is depicted by the solid green bars. The black outline shows the null distribution.
APPLIED
MATHEMATICS
A
C
D
B
Fig. 5. Distributions of the local assortativity by residence (dorm) for each of the schools in the Facebook 100 dataset (3). Dotted black lines indicate the 10th and 90th percentiles, while the solid black lines show the interquartile range. The global assortativity is indicated by the blue square markers. (A–D) The distributions for four schools (Dartmouth, Wellesley, Haverford, and Wesleyan) are shown in detail. Each of them has approximately the same global assortativity (rglobal≈0.13), but the distributions indicate different levels of heterogeneity in the pattern of mixing by residence. While the distributions are
different, there exists a common trend that the first-year students tend to be more loosely connected to the rest of the network and exhibit higher values of assortativity (nodes to the right of the dashed cyan line).
First-year students are more assortative by year (for all schools except one) and by residence (more than 75% of schools); see
Supporting Informationfor details.
We can also use local assortativity to compare how the mix-ing of multiple attributes covaries across a network. This may be of interest, as a positive correlation could suggest a relation-ship between attributes, while a negative correlation indicates that assortativity of one attribute may replace the assortativ-ity of another. Note that differences in normalization between attributes mean that the actual values may not be directly com-parable, which is why we focus on correlation. Fig. 6 compares rmultifor year of study and place of residence. The central
scat-ter plot shows, for each university, the correlation between local
assortativities of the two attributes (x axis) against the differ-ence in the two global assortativities for each network (y axis), which was previously the only way to compare assortativities (3). The four surrounding subplots show the joint distribution of year and dorm local assortativity for specific universities. The yellow points indicate students in their first year. In most universities, we observed that first-year students were the most assortative by either year, residence, or both. In both Auburn and Pepperdine, there is a negative correlation between year and dorm assorta-tivity, suggesting that many friendships are associated with either being in the same year or sharing a dorm.
For Simmons and Rice, we observe a positive correlation between dorm and year local assortativity. However, in Simmons,
Fig. 6. A scatter plot, in which each school is a point, indicating the correlation of local assortativities by dorm and matriculation year (x axis) and proportion of nodes which are more assortative by dorm than by year (y axis). For reference, the blue vertical line indicates zero assortativity (random mixing), and the red horizontal line indicates zero difference in rglobal. Joint distributions of the dorm and year assortativities for four of the schools are shown in the
we see that the first-year students form a separate cluster, while, in Rice, they are much more interspersed. This difference may relate to how students are placed in university dorms. At Simmons, all first-year students live on campus (www.simmons.edu/ student-life/life-at-simmons/housing/residence-halls) and form the majority residents in the few dorms they occupy. Rice houses their new intakes according to a different strategy, by placing them evenly spread across all of the available dorms. The fact that students are mixed across years and that the vast major-ity [almost 78% (campushousing.rice.edu/)] of students reside in university accommodation offers a possible explanation for why we observe a smooth variation in values of assortativity without a distinction between new students and the rest of the population.
3. Discussion
Characterizing the level of assortativity plays an important role in understanding the organization of complex systems. However, the global assortativity may not be representative, given the vari-ation present in the network. We have shown that the distribu-tion of mixing in real networks can be skewed, overdispersed, and possibly multimodal. In fact, for certain network configura-tions, we have seen that a unimodal distribution may not even be possible.
As network data grow bigger, there is a greater possibility for heterogeneous subgroups to coexist within the overall popula-tion. The presence of these subpopulations adds further to the ongoing discussions of the interplay between node metadata and network structure (24) and suggests that, while we may observe
a relationship between particular node properties and existence of links in part of a network, it does not imply that this rela-tionship exists across the network as a whole. This heterogene-ity has implications for how we make generalizations in net-work data, as what we observe in a subgraph might not nec-essarily apply to the rest of the network. However, it may also present new opportunities too. Recent results show that, with an appropriately constructed learning algorithm, it is still possible to make accurate predictions about node attributes in networks with heterogeneous mixing patterns (25) and, in some cases, even utilize the heterogeneity to further improve performance (26). Quantifying local assortativity offers a new dimension to study this predictive performance. Heterogeneous mixing also offers a potential new perspective for the community detection prob-lem (27), i.e., to identify sets of nodes with similar assortativity, which may be useful in the study of “echo chambers” in social networks (28).
Our approach to quantifying local mixing could easily be applied to any global network measure, such as clustering coef-ficient or mean degree. It may also be used to capture the local correlation between node attributes and their degree, a relationship that plays a definitive role in network phenomena such as the majority illusion (29) and the generalized friendship paradox (30).
ACKNOWLEDGMENTS. This work was supported by Concerted Research
Action (ARC) supported by the Federation Wallonia-Brussels Contract ARC 14/19-060 (to L.P., J.-C.D., and R.L.); Fonds de la Recherche Scientifique-Fonds National de le Recherche Scientifique (L.P.); and Flagship European Research Area Network (FLAG-ERA) Joint Transnational Call “FuturICT 2.0” (J.-C.D. and R.L.).
1. Krackhardt D (1999) The ties that torture: Simmelian tie analysis in organizations. Res Sociol Organ 16:183–210.
2. Lazega E (2001) The Collegial Phenomenon: The Social Mechanisms of Cooper-ation Among Peers in a Corporate Law Partnership (Oxford Univ Press, Oxford, UK).
3. Traud AL, Mucha PJ, Porter MA (2012) Social structure of Facebook networks. Phys A 391:4165–4180.
4. Brose U, et al. (2005) Body sizes of consumers and their resources. Ecology 86: 2545.
5. Jeong H, Tombor B, Albert R, Oltvai ZN, Barabasi AL (2000) The large-scale organiza-tion of metabolic networks. Nature 407:651–654.
6. Albert R, Jeong H, Barab ´asi A-L (1999) Internet: Diameter of the worldwide web. Nature 401:130–131.
7. Watts DJ, Strogatz SH (1998) Collective dynamics of ‘small-world’ networks. Nature 393:440–442.
8. McPherson M, Smith-Lovin L, Cook JM (2001) Birds of a feather: Homophily in social networks. Annu Rev Sociol 27:415–444.
9. Aral S, Muchnik L, Sundararajan A (2009) Distinguishing influence-based conta-gion from homophily-driven diffusion in dynamic networks. Proc Natl Acad Sci USA 106:21544–21549.
10. Moody J (2001) Race, school integration, and friendship segregation in America. Am J Sociol 107:679–716.
11. Cohen JM (1977) Sources of peer group homogeneity. Sociol Educ 50:227–241. 12. Kandel DB (1978) Homophily, selection, and socialization in adolescent friendships.
Am J Sociol 84:427–436.
13. Newman MEJ (2003) Mixing patterns in networks. Phys Rev E 67:026126.
14. McAuley JJ, Leskovec J (2012) Learning to discover social circles in ego networks. Adv Neur 25:539–547.
15. Sampson SF (1968) A novitiate in a period of change: An experimental and case study of social relationships. PhD thesis (Cornell Univ, Ithaca, NY).
16. Zachary WW (1977) An information flow model for conflict and fission in small groups. J Anthropol Res 33 452–473.
17. Ugander J, Karrer B, Backstrom L, Marlow C (2011) The anatomy of the facebook social graph. arXiv:1111.4503.
18. Newman MEJ, Girvan M (2004) Finding and evaluating community structure in net-works. Phys Rev E 69:026113.
19. Anscombe FJ (1973) Graphs in statistical analysis. Am Stat 27:17–21.
20. Andersen R, Chung F, Lang K (2006) Local graph partitioning using PageRank vectors. Foundations of Computer Science (FOCS’06) (Inst Electr Electron Eng, New York), pp 475–486.
21. Kloumann IM, Ugander J, Kleinberg J (2016) Block models and personalized PageRank. Proc Natl Acad Sci USA 114:33–38.
22. Fouss F, Saerens M, Shimbo M (2016) Algorithms and Models for Network Data and Link Analysis (Cambridge Univ Press, Cambridge, UK).
23. Boldi P (2005) Totalrank: Ranking without damping. Special Interest Tracks and Posters of the 14th International Conference on World Wide Web (WWW) (Assoc Comput Machinery, New York), pp 898–899.
24. Peel L, Larremore DB, Clauset A (2017) The ground truth about metadata and com-munity detection in networks. Sci Adv 3:e1602548.
25. Peel L (2017) Graph-based semi-supervised learning for relational networks. SIAM International Conference on Data Mining (Soc Industrial Appl Math, Philadelphia), pp 435–443.
26. Altenburger KM, Ugander J (2017) Bias and variance in the social structure of gender. arXiv:1705.04774.
27. Schaub MT, Delvenne J-C, Rosvall M, Lambiotte R (2017) The many facets of commu-nity detection in complex networks. Appl Netw Sci 2:4.
28. Colleoni E, Rozza A, Arvidsson A (2014) Echo chamber or public sphere? predicting political orientation and measuring political homophily in twitter using big data. J Commun 64:317–332.
29. Lerman K, Yan X, Wu X-Z (2016) The “majority illusion” in social networks. PLoS One 11:e0147617.
30. Eom Y-H, Jo H-H (2014) Generalized friendship paradox in complex networks: The case of scientific collaboration. Sci Rep 4:4603.
31. Yule GU (1912) On the methods of measuring association between two attributes. J R Stat Soc 75:579–652.
32. Ferguson GA (1941) The factorial interpretation of test difficulty. Psychometrika 6:323–329.
33. Guilford JP (1950) Fundamental Statistics in Psychology and Education (McGraw-Hill, New York).
34. Davenport EC, Jr, El-Sanhurry NA (1991) Phi/Phimax: Review and synthesis. Educ Psy-chol Meas 51:821–828.
35. Cureton EE (1959) Note on ϕ/ϕ max. Psychometrika 24:89–91.
36. Cohen J (1960) A coefficient of agreement for nominal scales. Educ Psychol Meas 20:37–46.
37. Boldi P, Santini M, Vigna S (2007) A deeper investigation of PageRank as a function of the damping factor. Web Information Retrieval and Linear Algebra Algorithms (Inter-nationales Begegnungs- und Forschungszentrum f ¨ur Informatik, Dagstuhl, Germany), 07071.
38. Fosdick BK, Larremore DB, Nishimura J, Ugander J (2016) Configuring random graph models with fixed degree sequences. arXiv:1608.00607.