HAL Id: tel-02414400
https://tel.archives-ouvertes.fr/tel-02414400
Submitted on 16 Dec 2019HAL is a multi-disciplinary open access archive for the deposit and dissemination of sci-entific research documents, whether they are pub-lished or not. The documents may come from teaching and research institutions in France or abroad, or from public or private research centers.
L’archive ouverte pluridisciplinaire HAL, est destinée au dépôt et à la diffusion de documents scientifiques de niveau recherche, publiés ou non, émanant des établissements d’enseignement et de recherche français ou étrangers, des laboratoires publics ou privés.
for rural communities – a technical, economic and social
approach
Simon Meunier
To cite this version:
Simon Meunier. Optimal design of photovoltaic water pumping systems for rural communities – a technical, economic and social approach. Electric power. Université Paris Saclay (COmUE), 2019. English. �NNT : 2019SACLS440�. �tel-02414400�
Optimal design of photovoltaic
water pumping systems for rural
communities – a technical,
economic and social approach
Thèse de doctorat de l'Université Paris-Saclaypréparée à l’Université Paris-Sud
Ecole doctorale n°575 Electrical, optical, bio-physics and engineering, EOBE Spécialité de doctorat: Génie Electrique
Thèse présentée et soutenue à Gif-sur-Yvette, le 06/12/2019, par
Simon Meunier
Composition du Jury : Anne Migan-Dubois
Professeur, Université Paris-Sud (GeePs) Présidente du jury
Mohamed Machmoum
Professeur, Université de Nantes (IREENA) Rapporteur
Stéphane Brisset
Professeur, École Centrale de Lille (L2EP) Rapporteur
Frédéric Wurtz
Directeur de recherche, CNRS (G2ELAB) Examinateur
Philippe Malbranche
Directeur de l’INES (Institut National de l'Énergie Solaire) Examinateur
Judith Cherni
Research Fellow and Lecturer, Imperial College London (CEP) Examinatrice (Co-encadrante)
Claude Marchand
Professeur, Université Paris-Sud (GeePs) Directeur de thèse
Loïc Quéval
Enseignant-chercheur, CentraleSupélec (GeePs) Invité (Co-encadrant)
Encadrement : Philippe Dessante
Professeur, CentraleSupélec (GeePs) Co-encadrant
Lionel Vido
Maître de conférences, Université de Cergy-Pontoise (SATIE) Co-encadrant
NNT : 20 1 9S A C LS 44 0
Acknowledgements
I would like to thank Mohamed Machmoum and Stéphane Brisset for carefully reviewing this work and for their very interesting feedbacks. I also thank Anne Migan-Dubois, Frédéric Wurtz, Philippe Malbranche and Judith Cherni for examining this work and for their very valuable remarks.
I wish to express my sincere gratitude to my five PhD advisors. I thank Loïc Quéval for his commitment, his daily availability, his constructive suggestions and his professionalism. He pushed me to do my best during these last three years. I thank my PhD director Claude Marchand who was present and active throughout the thesis. His commitment and support allowed me to carry out my work in the best conditions. I also would like to thank Judith Cherni for her continuous support and her guidance on socio-economic aspects. I thank Philippe Dessante for his very constructive feedbacks and guidance throughout the whole PhD thesis. I thank Lionel Vido for his never-ending enthusiasm and knowledge filled inputs.
I am extremely grateful to Bernard Multon, Arouna Darga, Peter Kitanidis and Dale Manning for their selfless help and their extremely valuable inputs on systemic approaches, industrial aspects, hydrology and econometrics. They helped me to grow as a person and as a researcher. I thank Cedric Koeniguer and Bruno Darracq for their precious guidance on teaching and pedagogical aspects.
I would like to thank Matthias Heinrich, Thomas Vezin and Severin Darga for their great help on data collection, original scientific contributions as well as for all the exciting and fascinating discussions that we had. I thank all the students that I had the opportunity to advise during this PhD work for their cheerfulness and high quality contributions. Special mention to Vitali Caplain, Elvire de la Fresnaye and Vincent Roy for their exceptional investment. I thank all the 280 crowdfunders of the Turning Sun Into Water project, the NGO Respublica and the company DargaTech for making the installation of the photovoltaic water pump in Gogma possible. I thank the inhabitants of Gogma and Basile Darga for their warm welcome and a life-changing experience.
I thank all the teachers and researchers of the laboratory GeePs and of the energy department for their welcome and for all the technical and friendly discussions. I do not forget the technical and administrative team, especially Damien Huchet and Richard Beljio and Sophie Goncalvez, for their daily help.
It is now time to thank all my doctoral friends. We had a lot of fun and I know it is only the beginning of our friendship. A special mention to my “co-bureau” Mokrane Bala with whom we shared amazing moments and listened to great Algerian songs. I also thank my great friends from the Tennis Club CentraleSupelec, with whom we visited the whole Essonne. Special mention to Jose de Freitas for his unconditional support. My thoughts are also with my friends in France. I thank them for their support and encouragement during this adventure. I am really glad to have them in my life.
I thank my family and my parents. I am truly grateful for their trust and support during all these years. Finally, I thank my girlfriend Marine for all the special moments that we spent together and the unconditional support during difficult times.
Table of contents
List of figures ... 7 List of tables ... 9 Abbreviations ... 10 Nomenclature ... 11 Conversion rate ... 13 Introduction ... 15Chapter I Literature review ... 17
I.1 The water-energy nexus in rural areas of sub-Saharan Africa ... 18
I.1.1 Domestic water access ... 18
I.1.2 Electricity access ... 19
I.2 Electrified water pumping technologies for off-grid areas ... 20
I.3 Conventional PVWPS design ... 22
I.3.1 Architecture ... 22
I.3.2 Position ... 22
I.3.3 Sizing ... 24
I.4 Literature gaps and research objectives ... 25
Chapter II Experimental setup ... 28
II.1 Case study village and PVWPS ... 29
II.1.1 The village of Gogma, Burkina Faso ... 29
II.1.2 PVWPS ... 31
II.2 Data collection ... 37
II.2.1 On-field observations ... 39
II.2.2 GIS mapping ... 39
II.2.3 Geophysical measures ... 40
II.2.4 Account books of water sources ... 41
II.2.5 Household surveys ... 41
II.2.6 Pumping test ... 43
II.2.7 Water quality data ... 44
II.2.8 Monitoring of the PVWPS of Gogma ... 45
II.3 Partial conclusion ... 49
III.1 Overview ... 52
III.2 Demand model ... 54
III.2.1 Determination of the water sources where the households wish to go after installation of the PVWPS ………...54
III.2.2 Determination of the water demand profile at the PVWPS ... 60
III.3 Technical model ... 63
III.3.1 Energy conversion model – presentation and application to the current PVWPS of Gogma ………...64
III.3.2 Energy conversion model – generalization ... 72
III.3.3 Beneficiaries identification model ... 76
III.4 Impact model ... 78
III.4.1 Indicators identification and ranking ... 78
III.4.2 Quantification of the indicators for each household ... 81
III.4.3 Socio-economic impact at the scale of the village... 82
III.5 Economic model ... 84
III.5.1 Model ... 84
III.5.2 Results ... 87
III.6 Partial conclusion ... 89
Chapter IV Optimal design... 91
IV.1 Optimisation problem ... 92
IV.2 Analysis of a reference result ... 92
IV.2.1 Mono-objective optimisations results ... 93
IV.2.2 Bi-objective optimisation results ... 96
IV.3 Influence of the error in the demand model output ... 104
IV.4 Influence of the expression of the socio-economic impact function ... 106
IV.5 Influence of the groundwater parameters ... 108
IV.6 Proposition of an improved procedure for the design and installation of PVWPS ... 111
IV.6.1 Procedure ... 111
IV.6.2 Case study ... 113
IV.7 Partial conclusion ... 116
Conclusion ... 118
List of Publications ... 122
Appendix ... 125
Appendix B. Motor-pump model polynomial coefficients – case of the SQFlex 5A-7 ... 133
Appendix C. Satellite climatic data ... 134
Appendix D. Economic survey for local companies ... 135
Appendix E. Range of variation of groundwater parameters ... 139
Extended summary in French ... 141
Chapitre I : Revue de littérature ... 141
Chapitre II : Dispositif expérimental ... 142
Chapitre III : Modèle interdisciplinaire ... 146
Chapitre IV : Conception optimale ... 148
List of figures
Figure I-1 – Share of rural population with access to improved water sources, 2015. ... 18
Figure I-2 – Share of rural population with access to electricity, 2015 ... 19
Figure I-3 – Schematic layout of PVWPS with battery storage (left) and water tank storage (right) ... 22
Figure II-1 – Location of Burkina Faso. ... 29
Figure II-2 – Centre-East region in Burkina Faso. ... 29
Figure II-3 – Household gatherings. ... 30
Figure II-4 – Open well. ... 30
Figure II-5 – Hand pump. ... 30
Figure II-6 – Conventional procedure for the design and installation of a PVWPS. ... 33
Figure II-7 – Architecture of the PVWPS. ... 35
Figure II-8 – Picture of the PVWPS of Gogma. ... 35
Figure II-9 – Overview of the PVWPS. ... 35
Figure II-10 – GIS mapping of Gogma. ... 40
Figure II-11 – Water level in the borehole measured during the step pumping tests. ... 44
Figure II-12 – Water level in the borehole measured during the long pumping test ... 44
Figure II-13 – Data logger developed for monitoring the PVWPS of Gogma. ... 46
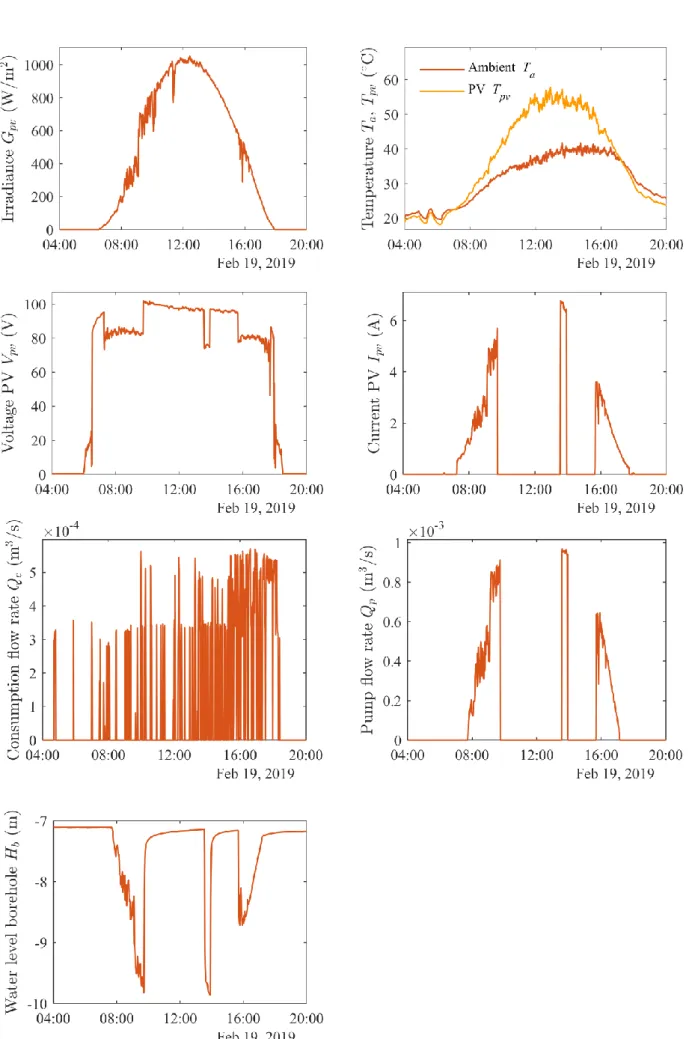
Figure II-14 – Example of data collected by the data logger. ... 48
Figure III-1 – Block diagram of the interdisciplinary model. ... 52
Figure III-2 – Block diagram of the demand model. ... 54
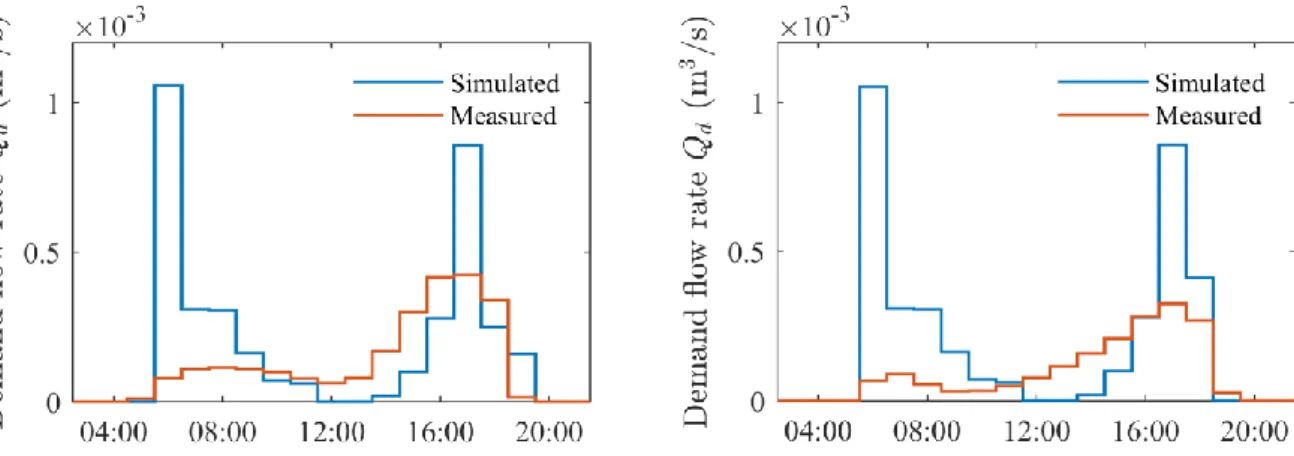
Figure III-3 – Demand flow rate profile simulated by the demand model and measured by the data logger (i.e. flow meter data) – dry season. ... 61
Figure III-4 – Demand flow rate profile simulated by the demand model and measured by the data logger (i.e. flow meter data) – wet season. ... 61
Figure III-5 – Block diagram of the technical model. ... 63
Figure III-6 – Block diagram of the energy conversion model. ... 64
Figure III-7– Definition of the heights. ... 65
Figure III-8 – Controller model. ... 67
Figure III-9 – Model of the motor-pump SQFlex 5A-7. ... 68
Figure III-10 – Drawdown measured during the pumping tests and simulated by the model. ... 69
Figure III-11 – Measured model inputs ... 71
Figure III-12 – Water level in the tank measured and simulated (model output). ... 72
Figure III-13 – Base radius 𝑅𝑡 and height 𝐻𝑡, 𝑡 chosen for different tank volumes 𝑉𝑡. ... 73
Figure III-15 – Ambient temperature from satellite data. ... 75
Figure III-16 – Simulated water demand for the position of the current PVWPS... 75
Figure III-17 – Block diagram of the beneficiaries identification model. ... 76
Figure III-18 – Oversized PVWPS. ... 76
Figure III-19 – Undersized PVWPS. ... 76
Figure III-20 – Block diagram of the impact model. ... 78
Figure III-21 – Theory of change – effect of going to a water source. ... 79
Figure III-22 – Block diagram of the economic model. ... 84
Figure III-23 – Capital cost of the PV modules as a function of the PV modules peak power. ... 86
Figure III-24 – Capital cost of the tank as a function of the tank volume. ... 86
Figure IV-1 – Optimal positions of the PVWPS. ... 94
Figure IV-2 – Points of the Pareto front for each of the motor-pump references and deduced final Pareto front. ... 97
Figure IV-3 – Pareto front. ... 98
Figure IV-4 – Variation of 𝑃𝑝𝑣, 𝑝 and 𝑉𝑡 as a function of the 𝑆𝐸𝐼. ... 98
Figure IV-5 – Variation of 𝑀𝑃 as a function of the 𝑆𝐸𝐼. ... 98
Figure IV-6 – Variation of 𝐿𝑎𝑡 and 𝐿𝑜𝑛 as a function the 𝑆𝐸𝐼. ... 99
Figure IV-7 – Values of the direct indicators variation along the Pareto front. ... 100
Figure IV-8 – Number of PVWPS consumers along the Pareto front and sources where these consumers used to go before the installation of the PVWPS. ... 101
Figure IV-9 – Capital and operational costs along the Pareto front. ... 102
Figure IV-10 – Vertical break at a 𝑆𝐸𝐼 of ~0.08. ... 102
Figure IV-11 – Block diagram considered for investigating the influence of the error in the demand model output. ... 104
Figure IV-12 – Influence of the error in the demand model output on the Pareto front. ... 105
Figure IV-13 – Pareto fronts obtained from the different expressions of the 𝑆𝐸𝐼 function. ... 106
Figure IV-14 – Pareto fronts obtained for different values of the static water level 𝐻𝑏, 𝑠. ... 108
Figure IV-15 – Pareto fronts obtained for different values of the aquifer losses coefficient 𝜅0. ... 109
Figure IV-16– Pareto fronts obtained for different values of the borehole losses coefficient 𝜇0. ... 109
Figure IV-17 – Procedure of application of the developed optimisation methodology. ... 112
Figure IV-18 – Pareto fronts obtained through the proposed procedure of design and installation of PVWPS. ... 114
List of tables
Table I-1 – Comparison between diesel and photovoltaic energy for water extraction. ... 20
Table I-2 – GHG emissions from PVWPS and their GHG emissions mitigation potential. ... 20
Table I-3 – PVWPS optimal sizing in the literature. ... 24
Table II-1 – Features of the current PVWPS of Gogma. ... 36
Table II-2 – Summary of collected data. ... 38
Table II-3 – Water sources costs. ... 41
Table II-4 – Themes covered by the household survey. ... 42
Table II-5 – Results of bacteriological tests performed by Laboratoire Aina ... 44
Table II-6 – Data monitored by the data logger. ... 46
Table III-1 – Quantification of predictors in the case of Gogma. ... 55
Table III-2 – Multicollinearity matrix for Gogma. ... 57
Table III-3 – Values of the regression coefficients and of the prediction rate before installation of the PVWPS – case of Gogma. ... 58
Table III-4 – Four possibilities for the prediction result at the current PVWPS of Gogma. ... 59
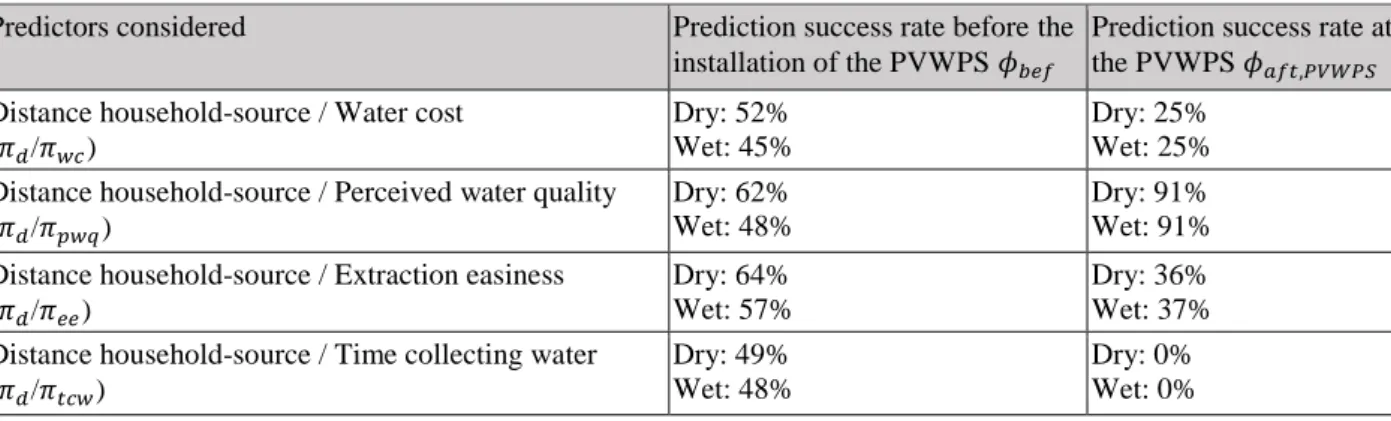
Table III-5 – Prediction success rates for several combinations of predictors. ... 59
Table III-6 – Daily integrals of the simulated and measured demand profiles for both seasons. ... 61
Table III-7 – Parameters of the energy conversion model and value for the current PVWPS of Gogma. .. 70
Table III-8 – Causal links between indicators of the theory of change. ... 80
Table III-9 – Direct indicators. ... 81
Table III-10 – Lifetime of the PVWPS and of its components. ... 85
Table III-11 – Fixed capital cost breakdown. ... 86
Table III-12 – Capital, operational and life-cycle costs - current PVWPS of Gogma. ... 88
Table IV-1 – Boundary of the optimisation variables – Case of Gogma. ... 93
Table IV-2 – Results of the mono-objective optimisation which aims at maximising the 𝑆𝐸𝐼. ... 94
Table IV-3 – Demanders and consumers of the PVWPS and impact indicators. ... 95
Table IV-4 – Results of the mono-objective optimisation which aims at minimising the 𝐿𝐶𝐶, with the constraint 𝑆𝐸𝐼 > 0. ... 96
Table IV-5 – Considered expressions of the 𝑆𝐸𝐼 function. ... 106
Table IV-6 – Value of the groundwater parameters for the sensitivity analysis – case of Gogma. ... 108
Table IV-7 – Range of variation of the optimal position of the PVWPS for different values of the groundwater parameters. ... 110
Abbreviations
ISAG Institut Superieur d’Application des Géosciences GIS Geographic information system
GHG Greenhouse gases PA Pipe assembly PV Photovoltaic
PVWPS Photovoltaic water pumping system STC Standard test conditions
std Standard deviation
Nomenclature
𝐴𝑂𝐼(𝑡) Angle of incidence between the sun’s rays and the PV array (rad) 𝑏(𝑡) Triggering signal from the controller
𝐶𝐴𝑃𝐸𝑋 Capital cost ($) 𝑑𝑟 Discount rate (%)
𝐺𝑑ℎ(𝑡) Diffuse horizontal irradiance (W/m2)
𝐺𝑑𝑛(𝑡) Direct normal irradiance (W/m2)
𝐺𝑔ℎ(𝑡) Global horizontal irradiance (W/m2)
𝐺𝑝𝑣(𝑡) Irradiance on the plane of the PV array (W/m2)
𝐻𝑏(𝑡) Height between the ground level and the water level in the borehole (m)
𝐻𝑏,𝑠 Height between the ground level and the static water level in the borehole (m)
𝐻𝑏,𝑑(𝑡) Height between the static water level and the water level when there is pumping (drawdown) (m)
𝐻𝑡,𝑏 Height between the ground level and the bottom of the tank (m)
𝐻𝑡,𝑖 Height between the bottom of the tank and the level at which water enters the tank (m)
𝐻𝑡,𝑟 Height between the bottom of the tank and the restart level (m)
𝐻𝑡,𝑠 Height between the bottom of the tank and the stop level (m)
𝐻𝑡,𝑡 Height between the bottom of the tank and the top of the tank (m)
𝐻𝑝𝑎1(𝑡) Additional head due to pressure losses in pipe assembly (PA) 1 (m)
𝐻𝑡(𝑡) Height between the bottom of the tank and the water level in the tank (water level in the tank) (m)
ℎ Household
𝒉 All the households of the village 𝒉𝒔𝒖𝒓 Households surveyed
𝒉𝒔𝒃𝒆𝒇 Water sources where the households go before installation of the PVWPS
𝒉𝒔𝒂𝒇𝒕∗ Water sources where the households wish to go after installation of the PVWPS
𝒉𝒔𝒂𝒇𝒕 Water sources where the households effectively go after installation of the PVWPS
𝐼𝑝𝑣 (𝑡) Current from the PV array (A)
𝑘𝑚,𝑛 Coefficients for the fitting of the motor-pump characteristic
𝐿𝑎𝑡 Latitude 𝐿𝑜𝑛 Longitude 𝐿𝐶𝐶 Life-cycle cost 𝑀𝑃 Motor-pump reference
𝑁𝑂𝐶𝑇 Nominal operating cell temperature (°C) 𝑛𝑣 Number of households in the village
𝑛𝑑 Number of households that wish to go to the PVWPS (number of demanders of the PVWPS)
𝑛𝑐 Number of households that consume water at the PVWPS (number of consumers of the PVWPS)
𝑛𝑐,ℎ𝑝 Number of households that consume water at the PVWPS and used to consume water at a hand pump
before installation of the PVWPS
𝑛𝑐,𝑜𝑤 Number of households that consume water at the PVWPS and used to consume water at an open well
before installation of the PVWPS 𝑂𝑃𝐸𝑋 Operational cost ($)
𝑃𝑝𝑣,𝑝 PV array peak power (Wp)
𝑃𝑚𝑎𝑥(𝑀𝑃) Maximum power input to the motor-pump reference 𝑀𝑃
𝑄𝑑(𝑡) Water demand flow rate (m3/s)
𝑄𝑐(𝑡) Water consumption flow rate (m3/s)
𝑄𝑝(𝑡) Pump flow rate (m3/s)
𝑄𝑝,𝑚𝑎𝑥 Maximum flow rate that can be pumped from a borehole (m3/s)
𝑟 Rate of satisfaction of the water demand 𝑠 Water source
𝑆𝑡 Area of the base of the tank (m2)
𝑆𝐸𝐼 Socio-economic impact
𝑡 Time
𝑇𝑎(𝑡) Ambient temperature (°C)
𝑇𝑝𝑣(𝑡) PV modules temperature (°C)
𝑇𝐷𝐻(𝑡) Total dynamic head (m) 𝑉𝑝𝑣 (𝑡) Voltage of the PV array (V)
𝑉𝑡 Tank volume (m3)
𝑉𝑐 Volume consumed at the PVWPS (m3)
𝑉𝑑 Volume demanded at the PVWPS (m3)
𝑤𝑖 Weighting coefficient of the socio-economic impact function
𝑦𝑂𝑃𝐸𝑋 Yearly operational cost ($)
𝛼 Coefficient relating two impact indicators 𝛽𝑖 Regression coefficient of the demand model
𝑠𝑡𝑐 Efficiency of the PV modules in standard test conditions (STC) (%) 𝜙𝑏𝑒𝑓 Prediction rate before installation of the PVWPS
𝜙𝑎𝑓𝑡,𝑃𝑉𝑊𝑃𝑆 Prediction rate at the PVWPS
𝛾 Coefficient of loss on the maximum power related to PV modules temperature (°C-1) ℐ Impact indicator
ℐ𝑑 Distance impact indicator ℐ𝑑𝑖𝑎 Diarrhea impact indicator
ℐ𝑒𝑒 Extraction easiness impact indicator
ℐ𝑤𝑐 Water cost impact indicator
ℐ𝑤𝑞 Water quality impact indicator
𝑛 Aquifer losses coefficients (s/m2)
𝜆 Azimuth of the PV array (rad) µ𝑛 Borehole losses coefficients (s2/m5) Pipe pressure losses coefficient (s2/m5) 𝜃 Tilt of the PV array (rad)
𝜋𝑖 Predictor of the water demand
𝜋𝑑 Distance predictor
𝜋𝑒𝑒 Extraction easiness predictor
𝜋𝑝𝑤𝑞 Perceived water quality predictor
𝜋𝑡𝑐𝑤 Time collecting water predictor
Π Number of predictors of the water demand
𝜌 Probability that a given household attends a given water source 𝜎 Season (dry or wet)
𝜁 Albedo of the surrounding environment
Conversion rate
All the prices are expressed in US dollars ($) and the rates retained are the ones on the 23/08/2018: 1 XOF (currency in Burkina Faso) = $0.00177
Introduction
In sub-Saharan Africa, more than 300 million people do not have access to potable water sources and most of them live in rural areas. Photovoltaic water pumping systems (PVWPS) can improve access to potable water, especially in rural villages that are not connected to the electricity grid.
The objective of this PhD thesis is to propose a new methodology for the optimal design of PVWPS for domestic water access in rural villages. The proposed methodology aims at determining the sizings of the PVWPS and its positions in the village that maximize the positive impact of the system on socio-economic development (e.g. use of water of better quality, decrease in the distance to collect water) and minimize its life-cycle cost. The first main originality is the introduction of the position of the PVWPS in the village as an optimisation variable. This is particularly relevant given that many rural villages in sub-Saharan Africa are extended and that households of the same village often have an uneven access to potable water sources. Therefore there may be positions of the PVWPS that are more favourable for the village as a whole. The second main originality is the inclusion of the socio-economic impact as an objective function of the optimisation. Indeed, institutions that finance these systems aim at maximising their positive socio-economic impact.
This methodology was developed in collaboration with researchers from various disciplines, i.e., electrical engineering (GeePs and SATIE laboratories), environmental policy (Imperial College London), econometrics (Colorado State University) and hydrology (Stanford University), and in association with the company DargaTech based in Burkina Faso. Besides, this methodology is applied to a rural village in Burkina Faso, where technical and socio-economic data have been collected since September 2017. Chapter I presents the literature review. Chapter II describes the case study village and the experimental data collected. Chapter III presents the interdisciplinary model. Chapter IV presents the formulation of the optimisation problem and the results and proposes an improved procedure for the design and installation of PVWPS.
Chapter I Literature review
In the first section of this chapter, we discuss the low access to improved domestic water sources and the low grid coverage in sub-Saharan Africa. In the second section, we compare the main energy sources for pumping domestic water in off-grid areas. In the third section, we present the conventional way to design PVWPS. In the fourth section, we detail the main gaps that had been identified in the literature reviewed in the previous sections and relate those to the objectives of this PhD thesis.
I.1 The water-energy nexus in rural areas of sub-Saharan Africa
I.1.1 Domestic water access
The most common alternatives for water extraction in poor rural areas of developing countries are gathering water from an open well with a bucket and a rope, and hand pumps [1]. An open well is a hole sunk by hand in the ground, about 5-10 meters deep, used to collect water by throwing a bucket into it [1]. A hand pump is set on a drilled deep borehole and therefore allows to extract groundwater [1].
The water that is extracted from open wells with a bucket and a rope is not potable notably because it is exposed to contamination through mud [2]. This is the main reason why these sources are categorized as “unimproved”. Figure I-1 shows that these unimproved sources are nevertheless the only ones available to a large share of the population in sub-Saharan Africa. Drinking water from unimproved water sources is responsible for diseases such as diarrhea and trachoma [3, 4]. For instance, according to [4], in Cameroon children living in a household with no access to potable water are 1.3 times more likely to get diarrheal diseases than those living in households with an easy access to potable water.
Figure I-1 – Share of rural population with access to improved water sources, 2015 [5].
Contrarily to open wells, hand pumps provide potable water as they extract water from aquifers and they are sealed to prevent contamination [2]. However, like for open wells, the pumped flow rate of hand pumps is limited by human strength, water extraction is hard and time consuming, which is responsible for significant queuing times [6, 7, 8]. Finally, hand pumps do not allow to reach deep aquifers (typically groundwater levels deeper than 50 m [9]) and require regular maintenance due to moving parts [2]. In comparison to the alternatives described above, electrified water pumping systems appear as more promising for providing water for domestic use, i.e., drinking, cooking, personal hygiene and laundry.
Indeed, despite their higher initial cost [1], they allow to reach deeper aquifers and they provide higher flow rates. Consequently the queuing time at the system is reduced, which allows to free time so to enable people to undertake other activities [10, 11]. In addition, electrified water pumping systems allow to lower the physical hardness of water collection [10, 11]. Finally, they can be a stepping stone toward the installation of piping systems that deliver water to households individually [12, 13]. Nevertheless, as electrified pumping systems provide the opportunity to extract larger volumes of water than hand pumps, increased attention has to be paid to the effect of pumping on groundwater resources in order to preserve their sustainability [9].
I.1.2 Electricity access
Figure I-2 presents the share of the population of each country with access to electricity in 2015. A close observation to Figure I-1 and Figure I-2 points out that, in general, countries where access to improved water sources is the lowest are also the ones where the electricity access is deficient. In addition, national grid extension in the affected countries has proved to be too slow to reach remote rural areas in the near future [14, 15]. Other energy sources, such as off-grid solar energy systems, are a viable alternative to provide energy services in rural areas [16], and in particular electrified water pumping.
Figure I-2 – Share of rural population with access to electricity, 2015 [17].
0 – 43 % 43 – 91 % 91 – 100 %
I.2 Electrified water pumping technologies for off-grid areas
The most often used energy sources for providing electrified water pumping in off-grid areas are photovoltaic energy and diesel [18]. Table I-1 compares photovoltaic water pumping systems (PVWPS) to diesel water pumping systems.
Table I-1 – Comparison between diesel and photovoltaic energy for water extraction.
Diesel pumping system PVWPS
Storage Not required Electrical or water storage required
Capital cost Low [1, 19] High [1, 11, 19]
Operation cost High [19] Low [20, 21]
Lifetime Short [19] Long (typically 20 years) [19, 22, 23]
Greenhouse gases emissions
High [24, 25] Low [24, 25]
Maintenance Frequent maintenance required [1, 19] Reduced maintenance needs [19, 26, 27] Local impact Noise, toxic fumes [28, 29]
Reliability of supply
Intermittent supply in fuels in many regions [19]
Variability of solar resource [30]
Despite their higher capital cost [1, 11, 19], PVWPS have become competitive in comparison to diesel pumps in off-grid rural areas in terms of life cycle cost [31, 32]. In several cases, they are even more economically viable [19, 33]. However, the high capital cost still represents a challenge for financing PVWPS [1, 11, 19].
Regarding greenhouse gases (GHG) emissions, life cycle analyses were carried out to evaluate the GHG emissions from PVWPS and the reduction in GHG emissions achieved when replacing diesel pumps by PVWPS. Some studies consider only CO2 and other studies also take into account the other greenhouse
gases (e.g. CH4). In the latter case, results are given in kg of CO2 equivalent (CO2eq). In Table I-2, we
present the results of these studies in terms of emissions per kW, as 1 kW is a typical size for a PVWPS for domestic water access [34, 35].
Table I-2 – GHG emissions from PVWPS and their GHG emissions mitigation potential.
Reference Location Size of the system considered (kW)
PVWPS emissions Emissions reduction for the replacement of a diesel pump by a PVWPS
[25] China 3.4 294 kgCO2/kW/year NC
[24] Algeria 1 NC 4 kgCO2/kW/year
[36] India 1.8 NC 1160 kgCO2/kW/year
[37] Bangladesh 2 NC 500 kgCO2eq/kW/year
[38] Saudi Arabia 20 NC 1200 kgCO2eq/kW/year
NC: not considered.
The figures in Table I-2 can be compared to other figures of merit such as the average yearly GHG emissions per capita in the OECD countries: 11700 kgCO2eq/capita/year [39]. We observe that, for domestic water access, the impact of the implementation of new PVWPS and of the replacement of diesel pumps by PVWPS in terms of GHG emissions is restricted. This is mainly due to the fact that a low power PVWPS (typically 1 kW) can allow to deliver a very high value energy service, i.e. water provision for dozen of households [34]. We will therefore not consider GHG emissions from PVWPS in this PhD thesis.
Another key advantage of PVWPS in comparison to diesel pumps is their long lifetime [19, 22, 23] and their reduced maintenance needs [19, 26, 27], which is particularly important in rural areas [40]. Moreover,
PVWPS do not emit toxic fumes [29] and are less noisy [28], reducing their effect on the local operator. PVWPS are therefore a good candidate for development projects, as considered in this thesis. Nonetheless, thanks to their quicker installation [19], diesel pumps may be a more suitable for emergency and temporary projects, following earthquakes for instance.
I.3 Conventional PVWPS design
We define the design of a PVWPS for domestic water access in a rural village as the determination of its: Architecture, i.e., the choice and the disposition of the components.
Position, i.e., the geographical location in the village. Sizing, i.e., the size of the components.
I.3.1 Architecture
In order to be able to fulfil the water needs and to deal with the variability of the climatic conditions, a storage component is always required in PVWPS. The two mains possibilities for providing storage are: storing electrical energy produced by the PV array in batteries, or storing pumped water in a tank [31] (see Figure I-3). However, batteries wear out quickly in the harsh conditions considered (dust, temperature) and therefore have to be replaced frequently [41]. When batteries are effectively replaced, this increases the operation cost [42]. In addition and more importantly, batteries are not always replaced in these isolated areas, which jeopardizes the sustainability of the whole PVWPS [41]. As the architecture with water tank is more reliable than the one with battery, it is the most commonly used for providing domestic water in isolated areas [31, 41]. In this thesis, the architecture with water tank will thus be considered.
Figure I-3 – Schematic layout of PVWPS with battery storage (left) and water tank storage (right) – adapted from [31, 43, 44], MPPT: maximum power point tracker.
I.3.2 Position
Setting the position of a PVWPS, and of a water source in general, can be separated into two main phases [45]:
The proposition of a position by decision makers. This is referred to as ‘positioning’ in this thesis. The validation or invalidation of the proposed position through geophysical, hydrological and water quality analyses. This is referred to as ‘position validation’. If the position proposed initially is invalidated, the decision maker suggests another position (i.e. back to the positioning phase).
Positioning
The positioning of PVWPS and of water sources in general is a relatively undocumented topic and no scientific article on the subject was encountered. The few documents of the grey literature on this topic mention that the position may be proposed by the financing institution and/or village authorities [46, 47] and that the following elements should be considered when proposing a position:
1. The position should be away from potential contaminations sites (e.g. latrines, burial sites, municipal garbage dump) [46].
2. The position should be safe [46].
3. Reports on local geophysical studies and on the characteristics of existing wells of the village should be examined, if there are any [45].
4. The position should be accessible by the households [46].
Regarding element 3, it is difficult to implement in isolated areas of developing countries due to the scarcity of geophysical and hydrology data [46, 48]. In addition, an element that is not mentioned is that the new water point should be installed in the vicinity of households which have the worst access to water (e.g. households that only have access to open wells).
Finally, we observe that, no support tool is provided for the application of the mentioned elements and therefore for the positioning of the water source. As a consequence, the decision maker may decide on a position that is not the most favourable for the village as a whole. This non-optimal choice may be due to the inability of the decision maker to grasp the whole situation of the village or may be done on purpose by the decision maker, who may not be acting in the interest of the whole village. A support tool may help the decision maker to decide on the optimal position for the PVWPS. It may also allow a separate institution to verify that the position proposed by the decision maker is the most favourable for the whole village. Position validation
Firstly, geophysical studies are performed to detect the presence of water around the proposed position, noted (𝐿𝑎𝑡1, 𝐿𝑜𝑛1) [45]. If geophysical studies suggest the presence of water at a position (𝐿𝑎𝑡𝑆, 𝐿𝑜𝑛𝑆), next to (𝐿𝑎𝑡1, 𝐿𝑜𝑛1), a borehole is drilled at the position (𝐿𝑎𝑡𝑆, 𝐿𝑜𝑛𝑆). If water is indeed encountered at (𝐿𝑎𝑡𝑆, 𝐿𝑜𝑛𝑆) while drilling, three tests are then performed [45, 49]:
pumping tests which consist in pumping water at different flow rates while monitoring the water level in the borehole. The purpose of these tests is to determine the maximum flow rate that can be extracted from the borehole.
physico-chemical tests which consist in measuring the physico-chemical parameters of the water, such as pH, temperature, alkalinity, electrical conductivity, arsenic concentration.
bacteriological tests which consist in measuring the bacteriological parameters of the water such as the concentration of thermotolerant coliform and of faecal streptococci.
If the decision maker considers that the maximum pumped flow rate, determined from the pumping tests, is sufficient to meet the needs of the inhabitants and that the water quality is satisfying, the position is validated and the PVWPS is installed at (𝐿𝑎𝑡𝑆, 𝐿𝑜𝑛𝑆).
I.3.3 Sizing
Several studies have been performed to determine the optimal sizing of PVWPS for domestic water access. We have summarized the objective function(s), variables and constraint(s) considered in these optimisations in Table I-3.
Table I-3 – PVWPS optimal sizing in the literature.
Reference Objective function(s) Variables Constraint(s)
[50] Life-cycle cost,
probability of not fulfilling the water consumption
PV array peak power, tank volume
None [51] Life-cycle cost,
probability of not fulfilling the water consumption, excess in pumped water in comparison to the consumption
PV array peak power, tank volume
None
[52] Life-cycle cost,
probability of not fulfilling the water consumption
PV array peak power, tank volume
None [53] Probability of not fulfilling the water consumption PV array peak power,
tank volume
None
We observe that previous studies have mostly aimed at minimising the life-cycle cost of the PVWPS [50, 51, 52] and at minimising the probability of not fulfilling the water consumption of the inhabitants [50, 51, 52, 53]. The variables considered are the peak power of the PV array and the volume of the water tank [50, 51, 52, 53]. To our best knowledge, no study considers the motor-pump reference as an optimisation variable. It may be interesting to do so as the motor-pump is at the centre of the energy conversion chain (see Figure I-3). Therefore, from now on, we define “sizing” a PVWPS as determining the peak power of the PV array, the motor-pump reference and the tank volume.
In addition, it is noticeable that the position of the PVWPS in the village is not taken into account in the above studies on sizing [50, 51, 52, 53]. It is considered that the PVWPS should meet the water consumption of the whole village, no matter what is its position. This approach may be valid for small villages where all the inhabitants go to only one water source. However, a large share of sub-Saharan Africa rural villages are extended (area of several km2) and the inhabitants of the same village go to different water sources [54, 55].
For these villages, it is rational thus to assume that the water demand, i.e. the load curve, to the newly installed PVWPS depends on its position in the village. This should be reflected in the sizing, which varies with the load curve at the PVWPS, and should therefore depend on the position of the PVWPS in the village.
I.4 Literature gaps and research objectives
We see in section I.3.3 that the positioning and the sizing of the PVWPS should be coupled. This means that the water demand, i.e. the load curve, at a new PVWPS should be predicted, for any position in the village, and this predicted water demand should be used for sizing the PVWPS. Some econometrics models have investigated the water demand in rural villages and the first idea could be to use the output of these models as an input for sizing the PVWPS. For instance, [56] studied the determinants of the demand for different water sources (e.g. public sources, private wells) in Sri Lanka and similar studies were performed in Kenya [55], Honduras [57] and Philippines [58]. However, to our knowledge, current studies do not go as far as predicting the load curve at water sources. In addition, they focus on existing sources and they do not look at adding a new source, that may in addition be of a different type (e.g. adding a PVWPS in a village where there are only open wells). These elements highlight that considering the position of the PVWPS in the village also requires to adapt existing water demand models.
We also observe that none of the studies on the optimal design of PVWPS seek to maximize the positive impact on socio-economic development (e.g. use of water of higher quality, decrease in distance to collect water), while it is the main objective of the institutions that finance these systems [59, 60]. Some studies have been working on the evaluation of the socio-economic impact of energy systems. For instance, [61] developed an approach and model which compares several energy technologies for rural electrification over a wide range of criteria and forecasts social, human, financial and environmental impacts of energy supply on the population. In addition, [62] proposed a model to evaluate energy planning options (e.g. combined heat and power plants, energy saving) over technical, economic and social criteria (e.g. consistence of installation and maintenance requirements with local technical know-how, cost of primary energy saved). However, we did not find a similar methodology for investigating the socio-economic impact of electrified water pumping systems, like PVWPS. In addition and more importantly, the above articles on energy systems do not relate the design variables of the system (e.g. position, size of each component) to the values of the considered criteria. This prevents to find the optimal design, i.e. the optimal value of the design variables, vis-à-vis the socio-economic criteria. This also highlights the need to develop models that relate design variables to the socio-economic impact of the system.
The aim of this PhD thesis is to develop a methodology to determine the PVWPS sizings and positions in a village that both maximize the positive impact on socio-economic development and minimize the lifecycle cost of the PVWPS. This is fulfilled in three main steps:
Chapter II. A PVWPS is designed and installed in the conventional way in a rural village of sub-Saharan Africa. On the one hand, this allows to understand in detail the current situation regarding PVWPS and to design a methodology that builds on this current situation. On the other hand, this allows to collect data to apply the developed methodology and to validate the proposed models. Chapter III. We build an interdisciplinary model that links the sizing and position of the PVWPS
to its socio-economic impact and its life-cycle cost. The interdisciplinary model is composed of 4 sub-models: demand, technical, impact and economic.
Chapter IV. We define an optimisation problem to determine the PVWPS sizings and positions that maximize the positive impact on socio-economic development and minimize the life-cycle cost of the PVWPS, and then we present the results.
To summarize, in Chapter II, we learn from the design and installation of a PVWPS in the conventional way. Then, in Chapter III and Chapter IV, we use the knowledge acquired to propose an improved design and installation methodology (i.e. present how we could have designed and installed the conventionally set PVWPS more optimally).
Chapter II Experimental setup
In the frame of this PhD thesis, we raised funds and organized the installation of a PVWPS in the rural village of Gogma in Burkina Faso. The PVWPS was designed and installed in 2017, following the conventional way described in section I.3. The first reason for installing this PVWPS was to improve our understanding of the current situation regarding PVWPS and to propose a methodology for the optimal design of PVWPS (see Chapter III and Chapter IV) that builds on this current situation. Other reasons were to gather data for applying the proposed methodology and to be able to compare model results to experimental measurements.
In section II.1, we present the characteristics of the village of Gogma and the PVWPS installed and in section II.2 we describe the data collected.
II.1 Case study village and PVWPS
II.1.1 The village of Gogma, Burkina Faso
Burkina Faso is a Sub-Saharan country of West Africa (Figure II-1) with a population of 19 million and a Human Development Index of 0.42, the 7th lowest in the world in 2017 [63]. The rural village of Gogma
(GPS coordinates: 𝐿𝑎𝑡: 11.73°; 𝐿𝑜𝑛: - 0.58°) is a village of ~2 km×2 km located in the “Centre-East” region of Burkina Faso (see Figure II-2). The closest town to Gogma is the town of Garango which is 15 km away.
Figure II-1 – Location of Burkina Faso. Source: Wikipedia.
Figure II-2 – Centre-East region in Burkina Faso. Source: Wikipedia.
The village counts with 1100 inhabitants who live in 125 households. The 125 households are themselves grouped into 41 “household gatherings” such that shown in Figure II-3. The vast majority of people in Gogma work in agriculture and live on less than $1/capita/day. Households do not have access to electricity. We have identified 4 types of domestic water uses: drinking, cooking, personal hygiene and laundry. Water for these uses is collected from 22 sources divided into 3 categories: 16 open wells from which water is extracted with a bucket and a rope (see Figure II-4), 5 hand pumps (see Figure II-5) and 1 PVWPS (Figure II-8 and Figure II-9).
Figure II-3 – Household gatherings.
II.1.2 PVWPS
II.1.2.1 Design and installation
The installation of the PVWPS in Gogma followed up on the demand from the local authorities of Gogma to the NGO Respublica [64]. The local authorities asked for the installation of an improved water source in an area of Gogma where only open wells were available. Funding for the PVWPS was provided through a donation from Respublica and a crowdfunding organized by the association Eau Fil du Soleil [65]. Eau Fil du Soleil was created by several members of our research group in 2017 and aims at promoting science initiatives in relation to PVWPS in developing regions [66]. The design and installation of the PVWPS was coordinated by the company DargaTech [67], based in Ouagadougou and specialised in photovoltaic systems. The data that were collected during the design and the installation of the PVWPS are presented in section II.2.
The design and installation of the PVWPS were performed according to the following steps:
Step 1, beginning of September 2017: the local authorities looked for potential areas to avoid (e.g. burial sites and unsafe areas, see section I.3.2), i.e. areas where the PVWPS should not be installed. No particular area to avoid was encountered.
Step 2, beginning of September 2017: the local authorities of Gogma highlighted the position where they would like the PVWPS to be installed.
Step 3, 18 September 2017: geophysical measurements, performed by the company Institut Superieur d’Application des Géosciences (ISAG), highlighted a suitable position to drill (𝐿𝑜𝑛 = -0.5722° and 𝐿𝑎𝑡 = 11.7244°) next to the position proposed by the local authorities.
Step 4, 3 November 2017: a borehole was drilled by the company Sogedaf. The drilling machine was rent to SAIRA international. Water was found at -14 m (water strike level). Then, due to the pressure of the ground over the aquifer, the water level in the borehole went up to -6 m (static water level). The good execution of the drilling was controlled by a third party called a “drilling controller”.
Step 5, 5 – 8 November 2017: 4 step pumping tests and 1 long pumping test were performed by Sogedaf. Sogedaf highlighted that the maximum flow rate that can be withdrawn from the borehole 𝑄𝑝,𝑚𝑎𝑥 is equal
to 1.8 10-3 m3/s. The pumping tests were also controlled by the “drilling controller”. Physico-chemical tests
were performed by the laboratory Aina. They showed that the water is suitable for drinking in terms of physico-chemical quality.
Step 6, November 2017: the PVWPS was sized by the company DargaTech. The peak power of the PV array and the tank volume were determined through analytical calculations. The motor-pump was selected from the Grundfos catalogue [68], notably because of the high quality of Grundfos motor-pumps. The PV modules and the tank were bought in Ouagadougou and the motor-pump was imported from France. Step 7, December 2017 – January 2018: the PVWPS was installed by DargaTech in three phases:
(a) 2 - 8 December 2017: civil engineering was performed to lay the foundations of the water tank,
build the borehole head and the fountain. 4 employees from DargaTech and 2 inhabitants of the village participated in this civil engineering work.
(b) 8 January 2018: the water tank was installed by 5 employees from DargaTech.
(c) 14 January 2018: the PV array and the motor-pump were installed by 4 employees of
DargaTech and the welder from Garango. A signpost was also put in place next to the fountain with the rules of use of the PVWPS (e.g. do not do laundry next to the fountain, do not wash motor bikes next to the fountain)
Step 8, 14 January 2018: the PVWPS was opened for consumption to the inhabitants.
Step 9, 27 February 2018: bacteriological tests were performed by the laboratory Aina at the PVWPS. They showed that the water is suitable for drinking in terms of bacteriological quality. Based on physico-chemical (step 5) and bacteriological tests results, the water at the PVWPS is therefore potable.
Step 10, 27 February 2018: following the bacteriological tests results, the PVWPS was kept open for consumption by local authorities of Gogma.
The analysis of the different steps and a semi-structured interview with Arouna Darga, the CEO of DargaTech, allowed to determine the procedure for the design and installation of PVWPS which is presented in Figure II-6. According to this interview, this procedure is standard in Burkina Faso.
It is interesting to observe that the bacteriological test is not performed at step 5, at the same time as physico-chemical tests, but after the installation of the PVWPS. Indeed, Arouna Darga explained that the components of the PVWPS (e.g. pipes, tank, fountain) may also be source of bacteriological contamination which explains why the bacteriological test is performed after the installation of the PVWPS. In addition, Arouna Darga specified that these bacteriological tests are not always performed or that they may be performed a few months after the opening of the PVWPS (as in the case of the PVWPS of Gogma). Besides, according to Arouna Darga, negative bacteriological water quality tests (i.e. non potable water) are extremely rare for sealed boreholes in rural areas. He also added that, if the bacteriological tests were to be negative, the opening of the PVWPS to consumption would depend on the situation in the village. For instance, if there are only non-potable sources (e.g. open wells) in the village, the PVWPS may still be opened.
Figure II-6 – Conventional procedure for the design and installation of a PVWPS.
II.1.2.2 Technical description
The architecture of the PVWPS is presented in Figure II-7. The components that are encompassed in this architecture are:
Size the PVWPS: determine the PV array peak power, the suitable motor-pump and the tank volume.
Perform geophysical measures along several profiles in a square of ~350 350 m around
( ).
Drill a borehole at ( ).
Perform pumping tests.
Determine the maximum flow rate that can be pumped thanks to the pumping tests. Perform physico-chemical tests on the water flowing out of the borehole.
Do geophysical measures indicate a suitable position ( to drill within the square?
Is there water flowing out of the borehole?
Does the decision maker consider that it is worth installing a PVWPS at the position ( ) ?
Does the physico-chemical water quality meet the regulation for domestic consumption?
The decision maker proposes a position ( ), outside the areas to avoid, around which to start looking for water.
Install the PV array, motor-pump, tank and fountain.
Open the PVWPS for consumption to the inhabitants.
Does the decision maker consider that the bacteriological water quality is satisfying?
The PVWPS is kept open 3 4 5 7 6 Positioning step Sizing step 8
Perform bacteriological tests on the water flowing out of the fountain
10 Yes Yes Yes Yes Yes No No No No No 2 9
Identify areas to avoid (e.g. burial sites, unsafe areas). 1
The decision maker proposes another position ( , ),
which is outside the ~350 350 m square around ( ) and the areas to
avoid. 2b
A PV array.
A motor-pump with a maximum power point tracking (MPPT) controlled converter, which tracks the best operating point of the PV array. This whole set is immersed in the borehole and is called “motor-pump” in the rest of the manuscript.
A controller which starts and stops the motor-pump according to two set points of the water level in the tank, which is obtained by a float switch.
A water tank.
A pipe assembly PA1 which links the motor-pump to the tank. A fountain at which inhabitants collect water by using 3 taps. A pipe assembly PA2 which links the tank to the fountain.
The water collected at the fountain is used for 4 types of domestic uses: drinking, cooking, personal hygiene and laundry. Most of the users take water back home for drinking, cooking and personal hygiene and do the laundry next to the fountain.
Figure II-8 and Figure II-9 show pictures of this PVWPS. A video of the village and of the PVWPS is also available at the following link: https://youtu.be/VrjM0edKVsI. Table II-1 summarizes the features of the PVWPS. In the rest of the thesis, we refer to the PVWPS that was installed as the “current PVWPS of Gogma”.
Figure II-7 – Architecture of the PVWPS. Figure II-8 – Picture of the PVWPS of Gogma.
Figure II-9 – Overview of the PVWPS.
On the left: the fountain where the inhabitants collect water.
Table II-1 – Features of the current PVWPS of Gogma. PV array: 3 multicrystalline silicon modules in series
Surface of the PV array 3.9 m2
Tilt 𝛩 0.19 rad (11°)
Azimuth λ π rad (180°)
Borehole
Distance from the ground level to the bottom of the borehole 56 m
Interior diameter of the borehole 0.11 m
Motor-pump: Grundfos SQFlex 5A-7 [69]
Distance from the ground level to the motor-pump 30 m
Maximum power input 𝑃𝑚𝑎𝑥(𝑀𝑃) 1400 W
Maximum pumping height 50 m
Maximum pump flow rate 2.5 10-3 m3/s
Tank: cylindrical made of steel
Height between the ground level and the bottom of the tank 𝐻𝑡,𝑏 4.2 m
Volume of the cylinder 𝑉𝑡 11.4 m3
Base surface of the cylinder 𝑆𝑡 3.3 m2
Height of the cylinder 𝐻𝑡,𝑡 3.5 m
Controller: Grundfos CU 200 [70]
Pipe assembly PA1: 4 pipes of different diameters and materials
Total length 47 m
Fountain
Number of taps 3
Pipe assembly PA2: 1 pipe
II.2 Data collection
In Gogma, since September 2017, we have been collecting data from the following disciplines: energy systems, social sciences, geography, hydrology and geophysics. The collected data are summarized in Table II-2 and further detailed in the following sections. In Table II-2, we also specify:
The data that have been collected during the procedure of design an installation of the PVWPS (labelled as ‘Conventional procedure’) and the ones that have been collected in addition, specifically for research purposes (labelled as ‘Research’).
If data were collected by our research group or through specialized companies based in Burkina Faso.
The collection period, i.e. the total period over which data have been collected (note that the data are not necessarily collected full-time during the collection period).
The collection time, i.e. the time required to collect the data in number of work days of one data collector (we consider that the collector works 8 hours per day).
The collection cost. When the data collection was performed by a company, we use the bill from the company. When then data collection was performed by our research group, we estimate data collection cost by multiplying the collection time by the daily cost of a data collector, estimated to $160/day.
The sub-model(s) where data is (are) used. Indeed, the interdisciplinary model presented in Chapter III, is composed of 4 sub-models (demand, technical, impact and economic) and the collected data may be used in one or several of these sub-models as input and/or for experimental validation. The considerations on the collection period, time and cost allow to quantify the investment in time and money required to collect each type of data.
Table II-2 – Summary of collected data.
Type Description Collected by Collection period (Collection time for 1 data collector)
Data collection cost Sub-model where data is used (see Chapter III) On-field observations Observations on living conditions and water access. Research Research group 18 Sept 2017 – Present (10 days) $1600 Demand, Impact GIS (geographic information system) mapping GPS positions of the households, water sources, important points of the village (shops, mosques, church, …). Research Research group 18 Sept 2017 – 10 Nov 2017 (3 days) $480 Demand, Impact Geophysical measures
Detection of the presence of water along 4 profiles of 150 m long by using electromagnetic methods. Conventional procedure Institut Superieur d’Application des Géosciences (ISAG) [71] 18 Sept 2017 (1 day) $386 Account books of water sources
The account book of a source specifies the households that attend this source and the cost for collecting water at the source. Research Research group 03 Oct 2017 – 20 June 2018 (1 day) $160 Demand, Impact Household surveys
Survey on the living conditions and water access. Two surveys are performed: one before the installation of the PVWPS and one after. Research Survey before installation: Research group Survey after installation: company Best Sigma Survey before installation: 03 Oct 2017 – 21 Oct 2017 (10 days) Survey after installation: 27 Oct 2018 to 6 Nov 2018 (10 days) $3200 Demand, Impact Pumping tests
4 step pumping tests, of 2 hours each, at 4 different pump flow rates. 1 long pumping test of 47 hours at a given flow rate.
Conventional procedure
Sogedaf 05 Nov 2017 – 09 Nov 2017 (3 days)
4 step pumping tests: $511
Long pumping test: $2050
Technical
Water quality tests
1 physico-chemical test at the PVWPS.
1 bacteriological test at the PVWPS.
Conventional procedure 21 bacteriological tests for the other 21 water sources for domestic water in Gogma. Research Laboratoire Aina [72] 7 Nov 2017 – 27 Feb 2018 (2 days) 1 physico-chemical test at the PVWPS = $141 1 bacteriological test at the PVWPS = $21 21 bacteriological tests for the other sources = $441
Impact
PVWPS monitoring
Continuous technical data collection on the operation of the PVWPS. Research Research group 14 Jan 2018 – Present (10 days2) Hardware and installation1 = $2000 Data collection and processing = $1000
Demand, Technical
1 The development time and cost of the data logger is not included. The development time is estimated to 3 months and the development cost to $50000.
II.2.1 On-field observations
In total 8 months were spent in Gogma by members of our research group, split at different moments during the last 3 years. This allowed us to perform 250 on-field observations. For each observation, the following elements were specified:
Content.
Is it something that was observed with the eyes or is it something that was said by someone. For the latter case, the name of the person was written down.
Location.
Day and time of the day.
The following key information were gathered through on-field observations: Households do not need to pay to collect water at open wells.
Most of the inhabitants perceive the water at sealed boreholes (hand pumps and PVWPS) as potable and perceive the water at open wells as non-potable.
Inhabitants perceive water extraction at PVWPS as easy.
Most of the households collect water in the morning and in the evening but it seems that they collect more water in the evening than in the morning.
Inhabitants sometimes use their bike to carry water.
In the household surveys, inhabitants reported to use ~20 L/capita/day for personal hygiene. According to our on-field observations, we think that it is overestimated.
Inhabitants sometimes make several return journeys to collect water.
II.2.2 GIS mapping
The GPS coordinates of the households, water sources and important locations in the village have been collected. We went to each location and used the mobile application “GPS Satellite” [73]. The coordinates obtained are represented on the satellite picture in Figure II-10.
Figure II-10 – GIS mapping of Gogma.
Data collected between the 18 September 2017 and the 10 November 2017.
II.2.3 Geophysical measures
The geophysical study was realized by the Institut Superieur d’Application des Géosciences (ISAG) by using the very low-frequency electromagnetic method [74]. Geophysical measurements were performed along 4 profiles of 150 m each, which corresponds to scanning a square of ~350×350 m. These profiles are represented in Figure II-10. Measurements along profiles 1, 2 and 4 did not suggest the presences of water along those profiles. On profile 3, there is a specific position that suggested the presence of water. It is at this position that the borehole for the current PVWPS was drilled.
Typically, performing measurements in a square of 350×350 m (i.e. 0.12 km2) takes half a day and costs
~$500. It would therefore be very costly and time consuming to perform geophysical measurements over an entire village of several square kilometres (e.g. Gogma has an area of 4 km2). In addition, it is important to
have in mind that these geophysical measurements only provide information about the level of the top of the aquifer, which is not equal to the static water level in the borehole that will be drilled in the case of a confined aquifer [49]. Besides, geophysical measurements do not provide information about the response of the water level in the borehole to water pumping nor about the water quality [49]. This explains why geophysical measurements and groundwater exploration are performed only after the positioning of the PVWPS, i.e. after a position is proposed by the decision maker (see Figure II-6).
II.2.4 Account books of water sources
Account books of the 5 hand pumps and of the PVWPS were accessed by our research group. There is one account book for each hand pump and one account book for the PVWPS. The account book specifies which households go to this source and the cost to collect water at this source. We also remind that we determined that open wells are free of charge through on-field observations (section II.2.1). The cost for each source is given in Table II-3. The hand pumps numbers correspond to the ones presented in Figure II-10.
It is interesting to note that households have to pay annually for hand pumps and monthly for the PVWPS. In addition, we observe that the yearly amount paid for water at hand pumps and at the PVWPS does not depend on the quantity of water consumed.
Table II-3 – Water sources costs.
Source type/number Price
Open wells $0/year
Hand pump 1 $2.1/year
Hand pump 2 $1.3/year
Hand pump 3 $0.9/year
Hand pump 4 $0.9/year
Hand pump 5 $0.9/year
PVWPS $0.9/month i.e. $10.8/year
Data collected between 3 October 2017 and 20 June 2018.
II.2.5 Household surveys
II.2.5.1 Description
Two rounds of household structured surveys were performed. The first round took place in October 2017, before the installation of the PVWPS. The second round took place in October/November 2018, after the installation of the PVWPS. The households surveyed were the same for both survey rounds. 88 households were selected randomly to be surveyed from the 125 households in Gogma2. The main points covered by
the survey are presented in Table II-4 and all the questions of the survey are available in Appendix A. The survey duration was about 45 minutes. The survey was designed drawing on existing surveys on water and
2 90 households were in fact surveyed but 2 are not considered because survey answers for these households are not complete, notably regarding their choice of water source.
electricity access in developing countries (e.g. survey of the SURE-DSS tool [61]). Surveying a large share of the households in Gogma (~70%) and selecting these households randomly allowed us to survey both households that started going to the PVWPS after its installation, and others that did not. Answers to the second round of surveys showed that 22 of the 88 surveyed households go to the PVWPS both during the dry and the wet season.
In this PhD thesis, we use answers to the first survey round as inputs for the demand and impact models (see sections III.2 and III.4) and answers to the second survey round to compare the results of the demand model to experimental measurements (see sections III.2). In the future, comparing the results of the first and second survey rounds may allow us to quantify some local impacts of the installation of the PVWPS of Gogma. This is notably with this in mind that we performed both survey rounds at the same moment of the year (October/November).
Table II-4 – Themes covered by the household survey.
Theme Description Survey section
(see Appendix A) Time and position Time of survey and GPS position of the surveyed household. a
Household
demographic situation
Age, gender, level of education and economic activity of all household members.
a Economic assets - Number of houses owned and materials of the floor, walls and roof of
each house. - Number of phones.
- Number of motor bikes and bicycles.
a
Access to services Access to internet, electricity, gas cooking. a Agricultural activities Number of fields, quantities of the different crops grown, use of crops
grown (self-consumption or selling in the market).
b
Livestock Number and type of the animals owned. b
Health List of diseases and symptoms contracted by each member of the household in the last month, and associated medical expenses.
c Women’s schedule Time allocated for their different activities of the day. d Safety Perception of the safety in the village (robbers, snakes …) e Water use For the dry season and the wet season:
- source where water is collected.
- daily quantity of water collected for each water use. - time at which water is collected.
f
Water sources For each water source used by the household:
- availability of water at the source during the dry season and the wet season.
- perception about the water quality at the source
- perception about the difficulty to extract water at the source . - cost of using the source.
- time spent queuing and extracting water.
f
Income and sparings Income from different sources of revenues (crop and animal sales, sales at shop, wages earned, money received from government, money received from family), and amount of money spared.
g
First survey round (before installation of the PVWPS): 3 October 2017 to 21 October 2017, second survey round (after the installation of the PVWPS): 27 October 2018 to 6 November 2018.
II.2.5.2 Data cleaning
The answers to questions on ‘water use’ and ‘water sources’ (section F of the survey) will be the most used in this thesis. We observe that ~30% of the households go to different sources between the dry season and the wet season. This is mostly due to the fact that some open wells are not available during the dry season because they are dry. Therefore, some households go to an open well during the wet season but have to go
![Figure I-1 – Share of rural population with access to improved water sources, 2015 [5]](https://thumb-eu.123doks.com/thumbv2/123doknet/14699923.746812/19.892.97.797.494.905/figure-share-rural-population-access-improved-water-sources.webp)


![Table II-5 – Results of bacteriological tests performed by Laboratoire Aina [72].](https://thumb-eu.123doks.com/thumbv2/123doknet/14699923.746812/45.892.93.797.850.992/table-ii-results-bacteriological-tests-performed-laboratoire-aina.webp)