Aware Surfaces: Large-Scale, Surface-Based Sensing for New Modes of Data Collection, Analysis, and Human Interaction
by
Daniel Hayim Goodman
Bachelor of Science in Mechanical Engineering, 2013 Massachusetts Institute of Technology
Submitted to the Program in Media Arts and Sciences, School of Architecture and Planning,
in partial fulfillment of the requirements for the degree of Master of Science in Media Arts and Sciences
at the
MASSACHUSETTS INSTITUTE OF TECHNOLOGY
June 2015
C Massachusetts Institute of Technology 2015. All rights reserved
Ag
Signature redacted
ARCHIVES
MASSACHUSETTS INSTITUTE OF TECHNOLOLGYJUN 12 2015
LIBRARIES
Daniel Goodman Program in Media Arts and Sciences May 18, 2015Certified by
Signature redacted
Kent Larson Principal Research Scientist Changing Places Group Thesis Advisor
Accepted
by
Signature redacted
V
Pattie Maes Academic Head Program in Media Arts and Sciences Author
Aware Surfaces: Large-Scale, Surface-Based Sensing for New Modes of Data Collection, Analysis, and Human Interaction
by
Daniel Hayim Goodman
Submitted to the Program in Media Arts and Sciences, School of Architecture and Planning,
on May 18, 2015, in partial fulfillment of the requirements of the degree of
Master of Science in Media Arts and Sciences
Abstract:
This thesis describes the design and construction of pressure sensing matrices for capturing human location and activity data from large surfaces in a space such as the floors, walls, tabletops, countertops, and furniture. With the ability to operate either alone or connected to others in an assembly, each sensor module is 0.3m x 2m, contains
512 force sensitive resistors, and has a refresh rate of about 8Hz. Each module was made
with conductive inkjet printing and PCB fabrication, creating a low-profile sensing surface with robust signal-collecting circuitry. Several experiments were conducted on an assemblage of three modules to assess parameters such as response time, sensitivity, measurement repeatability, spatial and pressure resolution, and accuracy in analyzing walking data as compared to a camera. Applications that could employ such a system are explored and two visualizations were prototyped that could ambiently provide data and trends to a user.
Thesis Supervisor: Kent Larson
Title: Principal Research Scientist, Changing Places Group, MIT Media Lab
Aware Surfaces: Large-Scale, Surface-Based Sensing for New Modes of Data Collection, Analysis, and Human Interaction
by
Daniel Hayim Goodman
The following individuals served as readers for this thesis:
1
/j
Signature redacted
Advisor V
Kent Larson Principal Research Scientist Changing Places Group
Reader
Signature redacted
Chris Schmandt Principal Research Scientist Living Mobile Group
Reader
Signature redacted
Joseph Paradiso Associate Professor of Media Arts and Sciences Responsive Environments Group
Acknowledgments:
To my advisor, Kent Larson. Thank you for your mentorship, input, and advice over the last
two years. I feel that my time in the Changing Places Group has allowed me to grow as both a designer and engineer.
To my readers, Chris Schmandt and Joe Paradiso. Thank you for your time and suggestions
during my project design and thesis writing process.
To my UROPs, Maria Fabre, Sasha Levy, Shruthi Narayanan, and Izzy Gomez. Thank you for
all your hard work this semester. I'm extremely happy with the final outcome of the project and
I have all of you to thank for making it happen.
To my parents, Marilyn and David Goodman. Thank you for everything. I love you both very
much and I am grateful for the guidance, support and occasional kick in the ass you have given and continue to give me.
To my brothers, Aaron and Jonah. I am proud of both of you and look forward to seeing all the
interesting things you will do in the coming years. I love you guys.
To my colleagues, professors, and friends at the Media Lab. Thank you for helping me along
the way. Thank you for the impromptu design help, enjoyable and thought provoking conversations, and inspiring projects.
Table of Contents:
0. Overview 21
1. Introduction and Context 23
2. Connected Devices 25
2.1 Intro and Overview 25
2.2 CityHome 25
2.2.1 Transformation 2.2.2 Smart Elements
2.2.3 UI/UX
2.2.4 App Ecosystem and Store
2.3 CityFarm 32 2.3.1 Aeroponics 2.3.2 Hydroponics 2.3.3 Sensing Modules 2.3.4 Data Recipes 2.3.5 Potential
2.4 Athena Breast Pump 36
2.4.1 Prototype System
2.4.2 Hardware and Sensing
2.4.3 Affordances of a Human-Centered Pump Interface
3. Research Motivations 39
3.1 Overview 39
3.2 Aging In Place 39
3.3 Cognitive Decline 41
3.3.1 Activities of Daily Living 3.3.2 Reporting ADLs
3.3.3 Using Surface-Based Sensing to Monitor ADLs
3.4 Fall Detection 42
3.4.1 Using Surface-Based Sensing to Monitor Fall Likelihood
3.5 A Solution Involves Multiple Devices Working Together 43
3.6 Use of Cameras For Geriatric Monitoring 44
3.6.1 Monitoring of Individuals With Dementia 3.6.2 Identify Abuse or Neglect
3.6.3 Use of Surface-Based Sensing in lieu of Cameras
3.7 Closing Remarks on Aging in Place and Age-Related Diseases 46
3.8 The Quantified Environment -Not "Wearables" but "Liveables" 47
3.9 Data-Driven Transformation of Space 48
3.10 Person-to-Person Communication and Connection 48
3.11 Games, Exercise, Education and Other Applications 49
4. Previous Work on Surface-Based Sensing 50
4.1 Overview 50
4.2 Physical Surface-Based Sensing in Academia 50
4.2.1 Magic Carpet
4.2.2 Z-Tiles
4.2.3 Conductive Inkjet Sensors
4.3 Physical Surface-Based Sensing in Industry 55
4.3.1 Tekscan
4.3.2 Elsi Technologies
4.3.3 Tactonic
4.4 Hobbyist Physical Surface-Based Sensing 58
4.5 Digital Surface-Based Sensing in Academia 60
4.5.1 IR Multitouch Table 4.5.2 GravitySpace
4.5.3 LuminAR
5. Development of Pressure Sensor Matrices 63
5.1 Overview 63
5.2 The Force Sensitive Resistor (FSR) 63
5.2.1 Calibration of FSRs 5.2.2 Circuitry to Drive FSRs
5.3 Final Project for Human 2.0 (Human Augmentation) Course 65
5.4 Designs Leading to The Member's Week 2014 Prototype 67
5.4.1 Overview
5.4.2 First Modular Design 5.4.3 Single Sided Sensor Matrix 5.4.4 Eliminating Ghosting
5.4.5 Single Sided Prototype With Diodes
5.4.6 Larger Sensors and Different Fabrication Processes 5.4.7 Spray Painting Sensors
5.5 Member's Week 2014 Prototype (MW2014) 71 5.5.1 Overview
5.5.2 Circuitry of MW2014
5.5.3 Hardware - Sensor Sheets
5.5.4 FSR Construction
5.5.5 Reading the Sensor Values 5.5.6 Visualizations
5.6 Member's Week 2014 Demo 78
5.6.1 Modes
6. Thesis Prototype 84
6.1 Overview 84
6.2 Technical Overview of the Conductive Inkjet Printing Process 84
6.3 Conductive Inkjet Printing Experiments 85
6.3.1 First Set of Inkjet Prints 6.3.2 Characterizing the Resistance
6.3.3 Assembling the Square Grid Sensor 6.3.4 Assembling the Rectangular Grid Sensor
6.4 Final Prototype Hardware and Software 92
6.4.1 Triangular Inkjet Printed Sensors
6.4.2 Slave Module PCB
6.4.3 Arduino-to-Arduino Communication With 2C
6.4.4 Communication with an Assembly of Slave Modules
6.4.5 Sensor Sheet Assembly
6.4.6 Masking Experiments
7. Visualizations of Sensor Data 101
7.1 Overview 101
7.2 Previous Work 101
7.2.1 Ambient Orb
7.2.2 Digital Family Portraits
7.3 "Digital" Clock 103
7.3.1 Family Clock Interface 7.3.2 Personal Clock Interface
7.4 Potted Plant 106
8. Experiments and Verification 108
8.1 Overview 108
8.2 Sensor Characterization 108
8.2.1 Single Sensor
8.2.2 One Cell of Two Sensors
8.2.3 Two Cells Containing Four Sensors
8.2.4 Discussion 8.3 Shape Characterization 116 8.3.1 Shapes 8.3.2 Force Distribution 8.3.3 Experimental Setup 8.3.4 Experimental Procedure
8.3.5 Triangular and Square Pixel Output Visualizations 8.3.6 Miscellaneous Activities
8.3.7 Results and Analysis
8.4 Walking Tests 124
8.4.1 Gait
8.4.2 Experimental Preparation and Setup
8.4.3 Experimental Procedure for General Walking Tests
8.4.4 Experimental Procedure for Gait Abnormality Tests
8.4.5 Analysis and Discussion of General Walking Tests
8.4.6 Analysis and Discussion of Gait Abnormality Tests 8.4.7 Closing Remarks
9. Future Work 144
9.1 Wireless Connectivity 144
9.1.1 XBee 9.1.2 ZigBee
9.1.3 Using XBee With the Thesis Prototype
9.2 Alternative Sensor Configurations 146
9.2.1 Different Sensor Densities in the Same Assembly
9.3 User Testing with Multiple Surfaces 148
9.4 Everything Else 148
10. Conclusion 150
References 152
Appendix A: Arduino Code 159
Appendix B: Processing Code 165
Appendix C: MATLAB Code 172
Appendix D: Lawton Instrumental Activities of Daily Living Scale 181
Appendix E: Tekscan Walkway Gait Analysis System 183
Appendix F: Masking Tests 185
Appendix G: Shape Characterization Test Images 187
Appendix H: Slave PCB Bill of Materials 193
List of Figures:
1. Introduction and Context 23
Figure 1 a: FitBit Surge fitness watch Figure Ib: Nest learning thermostat
2. Connected Devices 25
Figure 2: CityHome prototype Figure 3a: Sleep mode
Figure 3b: Work mode Figure 3c: Dining mode Figure 3d: Lounging mode
Figure 3e: Bathroom mode Figure 3f: Kitchen mode
Figure 4: FSR pad to actuate the CityHome wall module Figure 5a: Using voice control to trigger party mode Figure 5b: Party mode
Figure 6a: Pointing to engage the lights Figure 6b: Commanding the desk to move Figure 6c: Adjusting the hue of the lights Figure 6d: Deploying the bed
Figure 6e: Adjusting the hue of the lights Figure 6f: Locking in a specific light color Figure 6g: Newspaper projected onto the desk Figure 6h: Media remote projected on the wall Figure 7: Sample downloadable app
Figure 8: CityFarm hydroponic/aeroponic research lab Figure 9: Air sensing modules
Figure 10: Water sensing module
Figure 11: Athena Breast Pump prototype Figure 12: Athena Breast Pump electronics
Figure 13: Personalized pumping interface for a tablet
4. Previous Work on Surface-Based Sensing 50
Figure 14a: Magic Carpet set up in the Media Lab
Figure 14b: Schematic drawing of the Magic Carpet system Figure 15a: Assemblage of Z-Tiles
Figure 15b: Individual Z-Tile
Figure 16: Z-Tile data transfer schematic
Figure 17: Bounding areas of high pressure with ellipses Figure 18a: Surface composed of multiple tiles
Figure 18b: Close up of PCB used to read the tiles Figure 18c: Different components of a single tile
Figure 19: Sheet folded to accommodate different surface geometries
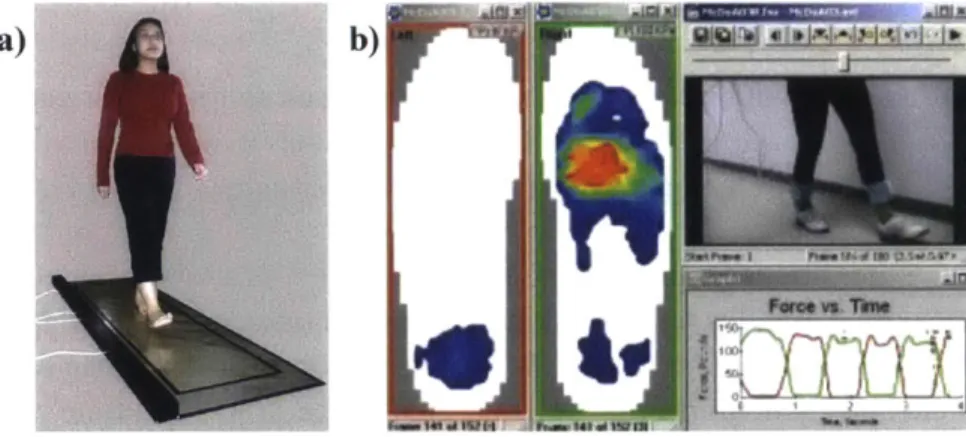
Figure 20: User with a shoe tag stepping on the surface Figure 21 a: Tekscan Walkway system in use
Figure 21 b: Output from Walkway system sensor readings Figure 22a: Elsi system installed under laminate flooring
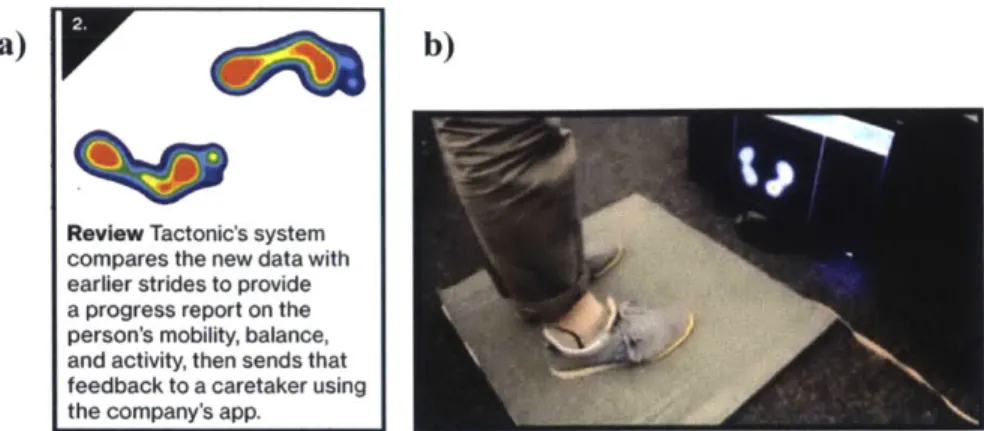
Figure 22b: System sensing an elderly individual walking on the floor Figure 23a: Output from Tactonic floor tiles
Figure 23b: Capturing a user's foot pressure profile
Figure 24: Pressure sensing pads underneath the exhibit flooring Figure 25: PCBs for the pressure sensors
Figure 26: IR multitouch surface
Figure 27: Sample outputs from different IR table configurations Figure 28: GravitySpace prototype
Figure 29a: Schematic of GravitySpace Figure 29b: GravitySpace output image Figure 30a: LuminAR
Figure 30b: LuminAR internal view Figure 31: Sample LuminAR interfaces
Figure 32: Shunt mode and through mode FSR configurations
5. Development of Pressure Sensor Matrices 63
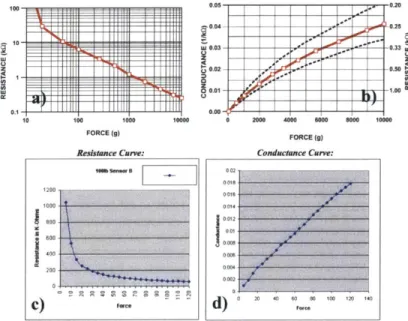
Figure 33: Force/Resistance and Force/Capacitance curves Figure 34: Voltage divider circuit for a single FSR
Figure 35: Row and column configuration of the pressure mat Figure 36: Tekscan pressure sensing matrix schematic
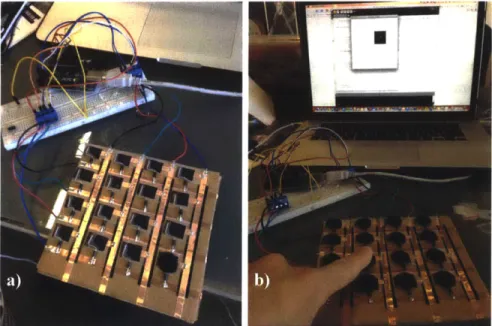
Figure 37: Smaller pressure mat prototype Figure 38a: Larger pressure mat prototype
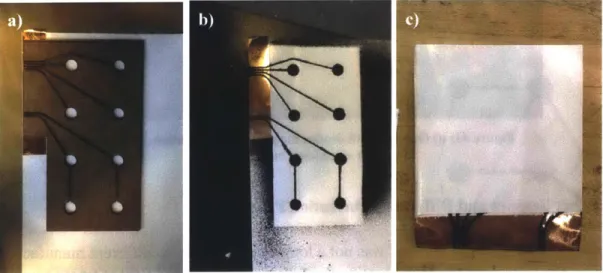
Figure 38b: Control circuitry for larger pressure mat prototype Figure 39a: Bottom surface of a 3 x 3 pressure matrix
Figure 39b: Traces masked with electrical tape Figure 39c: Upper and lower surface unfolded Figure 40a: Shunt mode FSR traces
Figure 40b: Squares of Velostat placed over the sensor pads Figure 41 a: One tile with diodes for ghosting mitigation Figure 41b: Sensor output visualized in Processing Figure 42a: Vinyl-cut traces
Figure 42b: Diodes connected to every sensor trace Figure 43a: Laser cut masking pattern
Figure 43b: Spray painted sensor traces
Figure 43c: Folded sheet to create rows and columns Figure 44: MW 2014 deployed in the CityHome
Figure 45a: Completed connector board with SR and MUX breakout boards Figure 45b: MUX, connector board, and SR
Figure 45c: Front side of connector board
Figure 46a: Close up of the circuit connection adaptor and sheet traces Figure 46b: View of one sensing strip
Figure 47: One sensing strip with pads at each FSR location Figure 48a: View of the six-strip prototype assembly
Figure 48b: View of the electronics connected to the strips
Figure 49: View of the carpeted prototype in the CityHome living room Figure 50: Raw data and threshold visualization
Figure 51: Path plot visualization Figure 52: Heat map visualization
Figure 53: Projector overlay on the carpeted prototype Figure 54: Member's Week 2014 demo space
Figure 55: Icons representing each mode the system could run Figure 56: Raw data mode
Figure 57: Light mode Figure 58: Music mode Figure 59: Heat map mode Figure 60: Orbit mode Figure 61: Path plot mode
6. Thesis Prototype 84
Figure 62: Conductive inkjet printed circuitry Figure 63a: Different print patterns and settings
Figure 63b: Close up of printed pattern with interlocking fingers Figure 63c: JST FFC connector with 0.1" pitch pins
Figure 63d: Off-the-shelf Interlink square FSR
Figure 64: Close up of the traces and sensor pads for the first prototype Figure 65a: Entire inkjet printed sheet with Square and Rectangular Grid Figure 65b: Close up of the Square and Rectangular Grid patterns
Figure 65c: Square Grid Figure 65d: Rectangular Grid
Figure 66a: Square and Rectangular Grid sheets cut from the main sheet Figure 66b: Tabs cut in Square Grid sheet and FFC connectors placed Figure 66c: Tabs cut in Rectangular Grid sheet and FFC connectors placed Figure 67: Square Grid sheet plugged into MW2014 electronics
Figure 68: Square Grid sheet with paper masking
Figure 69a: Square grid sensor connected to the computer
Figure 69b: Sensor activated and the output visualized on the computer Figure 69c: Testing two hands on the sensor
Figure 70a: Rectangular Grid sheet Figure 70b: Large Velostat sheet
Figure 70c: Half of the mask applied to the sheet Figure 70d: Complete mask applied
Figure 70e: Velostat attached along the edge of the sheet Figure 71: Laminated inkjet printed sensor and Velostat
Figure 72: One cell of two triangular sensors
Figure 73: Sample section of triangular sensors being activated by a foot Figure 74a: Close up of triangular sensor configuration
Figure 74b: Alternate view of the inkjet printed triangular sensors Figure 75: Overlapping sensor sheets
Figure 76: Long and short ribbon cable section of the printed sensor traces Figure 77: Schematic for a single slave module PCB
Figure 78a: A rendering of the final three-layer board Figure 78b: Fabricated and assembled board
Figure 79: Arduino ISP board
Figure 80a: View of inkjet printed sheet upon arrival
Figure 80b: Close up of guide border ribbon for the cable section
Figure 81: Cut and flipped ribbon cable section for the lower sensing sheet Figure 82a: Bottom inkjet sheet plugged into the PCB
Figure 82b: Top and bottom inkjet sheets plugged into the PCB Figure 82c: Masking layer applied to the top and bottom inkjet sheets Figure 82d: Assembled sensor sheet architecture
Figure 83a: View of three slave module assemblies connected together Figure 83b: View of PCBs and master Arduino
Figure 83c: Additional view of the PCB/sensor sheet interface Figure 84a: Primed and spray painted sensor sheet
Figure 84b: Sensor sheet run through an office inkjet printer
7. Visualizations of Sensor Data 101
Figure 85a: Ambient orb
Figure 85b: Orb changing color in response to price of electricity Figure 86a: Digital family portrait of a Grandmother
Figure 86b: Digital family portrait of a Granddaughter Figure 87a: Physical clock display
Figure 87b: Side view of clock Figure 88a: Default clock face
Figure 88b: Default clock face on the physical display Figure 88c: Inspiration for the default clock face design Figure 89a: Data visualization showing one active room
Figure 89b: Visualization of the active room and previously active rooms Figure 89c: Data visualization on the physical display
Figure 90a: Data visualization for the individual
Figure 90b: Personal visualization on the physical display Figure 91 a: Grass short indicating low activity
Figure 91b: Grass tall indicating high activity
Figure 91c: Random colors to demonstrate highlighting the grass with color Figure 92: Seven planter boxes representing the seven days of the week Figure 93a: Exploded view of the Potted Plant system
Figure 93c: Top view of the internals of the system
8. Experiments and Verification 108
Figure 94: Diagram of two cells of sensors Figure 95a: Location of force application Figure 95b: LEGO* force applicator
Figure 95c: Water container and applicator loading a single sensor Figure 96: Static loading tests for a single sensor 250g
Figure 97: Applied loading tests for a single sensor 250g Figure 98: Unloading tests for a single sensor 250g Figure 99a: LEGO* force applicator for one cell Figure 99b: 7.47kg block of steel
Figure 100: Static loading tests for a single cell with 7.47kg Figure 101: Unloading tests for a single cell with 7.47kg Figure 102a: LEGO* force applicator for two cells Figure 102b: Steel block applying weight to the cells Figure 102c: Other angle of the steel block applying weight Figure 103: Static loading tests for two cells with 7.47kg Figure 104: Force/Resistance and Force/Capacitance curves Figure 105: Sensor actuated by a weight
Figure 106: Shapes used in the characterization experiments Figure 107a: Arched foot profile
Figure 107b: Flat foot profile Figure 107c: Circle profile Figure 107d: Triangle profile Figure 107e: Square profile
Figure 108a: Sensor mat system placed on the table Figure 108b: Foam sheet covering the system Figure 109a: One water jug weighing about 421bs Figure 109b: Two water jugs weighing about 841bs Figure 11 Oa: Toe out or "duck-footed" orientation Figure 1 Ob: Toe-in or "pidgeon-toed" orientation Figure 11 Oc: Parallel feet orientation
Figure 111: Square orientation for 0' and 45'
Figure 112: Triangle orientations for 0', 45', and 900
Figure 113a: Circle object with triangular pixel visualization Figure 113b: Same object with the square pixel visualization Figure 114a: Person lying down
Figure 1 14b: Person sitting upright on their hands Figure 114c: Person sitting crosslegged
Figure 1 14d: Person performing a push up Figure 114e: Office chair
Figure 114f: Person sitting in office chair Figure 115: Outputs of different shape tests
Figure 116: Man and woman standing side by side Figure 117: Two representations of the human gait cycle
Figure 118: Pressure output and gait cycle analysis by Tekscan Walkway Figure 11 9a: Slave modules taped in place with wood plank protecting PCB Figure 119b: Close up of the tape
Figure 1 19c: Close up of the gaffer's tape/foam layer Figure 11 9d: View of the walking setup
Figure 120a: Walking experiment setup
Figure 120b: The two camera angles that are recorded
Figure 121: Reference directions and dimensions for the camera experiment Figure 122: Diagram of clustering scheme
Figure 123: Calculating theta from the new centroid and bounding box Figure 124: MATLAB output showing location of each footstep
Figure 125a: Subject wearing a constrained knee brace Figure 125b: Weight taped to the subject's right foot Figure 125c: Subject carrying a five-gallon water jug Figure 126: Finding the time of each step
Figure 127: Different step conditions encountered in the video analysis Figure 128: Diagram of a set of sensors on the system
Figure 129: Location of the centroid of a right triangle
Figure 130: Centroid approximation for each cell of two sensors Figure 131: Gap between slave modules in the mat assembly
Figure 132: Histograms for the distance and time differences for each step Figure 133: Three separate walking trials for the same person
Figure 134: Diagram indicating how step width, length and time is calculated
9. Future Work 144
Figure 135: XBee module with wire antenna
Figure 136a: XBee connected to the master Arduino Figure 136b: XBee connected to the computer via USB
Figure 137a: Row and column configuration for reading nine sensors Figure 137b: One-sensor-per-pin configuration
Figure 138a: Floor plan of an apartment using multiple sensor assemblies Figure 138b: Sparse sensor module with large sensors
Figure 138c: Dense sensor module with small sensors
Figure 138d: Example of multiple sensor sizes on a single sensor module Figure 139: Lawton Instrumental Activities of Daily Living scale
Figure 140: Tekscan Walkway gait analysis system
List of Tables:
Table 1: Resistance vs. Length For 1mm Traces 87
Table 2: Resistance vs. Length For 0.5mm Traces 87
Table 3: Static loading values (1-254): One sensor with 250g, one + two cells with 7.47 kg__ 14 Table 4: Dimensions for each of the shapes used in the characterization experiments 116
Table 5: Format of MATLAB and Video data outputs 135
Table 6: Mean and standard deviation for the distance and time differences for each step 138
Table 7: Mean and Stdev of step length/width for the normal and abnormal gait tests 141 Table 8: Mean and Stdev of step times for the normal and knee walking tests 141 Table 9: Mean and Stdev of step times for the ankle and weight carrying tests 142 Table 10: Average number of steps for the normal and abnormal gait tests 142 Table 11: Results of resistance, slide, crinkle, rub, and scratch tests 186
Table 12: Bill of Materials for Slave PCB 193
0. Overview:
The Internet of Things is a powerful paradigm in current technology for its ability to connect a multitude of distinct devices and provide high-volume collection of data for optimization, quantification, and enhancement. Single devices and appliances have already found a
comfortable place within this construct but the scope of "things" can be expanded even further. In particular, the largest surfaces in any given space such as the floors, walls, tabletops,
countertops, and furniture have the least amount of sensing associated with them. These vast surfaces are significant capture areas that are underutilized as a location of data collection. This work investigates the use of coordinate pressure sensing to passively capture human location and activity data from these surfaces. Through several prototype iterations, a modular system of
sensing "sheets" was developed to provide sensing capability to these locations. The theory behind pressure sensing as well as the design and fabrication process for each sensor prototype is provided.
In addition to the design and construction of the sensor sheets, several applications of the technology are explored to demonstrate the potential power of the system as both a standalone device and when paired with other sensing and smart devices in a connected environment. The primary application of focus is aging in place. The use of such sensors to provide valuable
information about walking, cognitive status, and activity level of an elderly user is explored. Algorithms written for the sensor can capture footsteps and calculate parameters of an
individual's gait such as step width, height, walking rate, and number of steps taken. In theory, this information can be used to diagnose onset of mobility disorders, anticipate likelihood of
falling, and on a macro scale understand the patterns of activities of daily living and how they vary on a daily, weekly, or monthly basis. Additional features investigated are the use of the
system as an input device for different applications and as a controller for different objects around a home.
Several experiments were conducted on the system to assess both its spatial and pressure resolution as well as understand the accuracy of collecting walking data as compared to a
camera:
The first experiment tested the response time, sensitivity, and repeatability of individual and small groups of sensors to known loading conditions. Single sensors or groups of sensors were both statically and dynamically loaded and unloaded with known weights and the resultant
outputs were plotted.
The second experiment involved placing differently shaped objects on the system to assess shape sensitivity. Each object was loaded with either forty or eighty pounds of weight to understand how the recorded output changed. The sensor data was visualized to more easily identify how differing pressures affected the recorded data.
For the final experiment, an assemblage of three sheet modules was set up in The Changing Places Group space and walking tests were then conducted on the system. Visual markers on the floor paired with webcam video recording allowed one to identify walking parameters by using frames of the video and the visual markers. In parallel, sensor data was also captured and algorithms generated foot positioning and time information. The algorithmically generated values were compared to the camera values to evaluate their agreement.
Anticipating a time when long-term, complex sensor data will need to be conveyed in a detailed, yet easy to understand way, two physical visualizations were created to ambiently provide data and trends to the user as well as their family or care providers (for the case of aging in place). The first visualization takes the form of a potted plant with actuated grass and LED lighting that can be used to give daily indications of activity level and variation from the norm for specific physiological variables. The second visualization takes the form of a digital clock, which normally shows the time, but when viewed up close, the display switches to a real-time visualization of location and activity level for the individual being monitored. Both devices require little mental computation to understand the outputs, and both are meant to fit easily into
any living or working environments. Secondary applications and corresponding visualizations discussed but not developed are the use of these sensors to control elements of a connected environment, including entertainment and educational systems, as well as robotic furniture and connected appliances.
1. Introduction and Context:
Humanity is currently experiencing a period of unprecedented connectivity. With the advent of the Internet, people all around the world had the ability to communicate, interact, and work with each other almost instantaneously. Now there is a new paradigm in connectivity and it belongs to physical devices; The Internet of Things or the "concept of a world full of connected devices controlled through a consumer-friendly hub" [38]. With inexpensive manufacturing and a myriad of intelligent chips and components, it is easier than ever to connect a device to the Internet or any number of mobile phones, tablets, or computers and control it remotely. Objects ranging from lights to thermostats to gardens are becoming sensing and feedback enabled, allowing previously unavailable control over their function and use.
Having been present at the 2015 Consumer Electronics Show, the comment by the New York Times that CES was "energized by a wave of new exhibitors chasing a top trend in consumer electronics: the Internet of Things" [38] was certainly true. Most people are probably more familiar with devices such as the Nest Learning Thermostat and the Phillips Hue Light bulb for revolutionizing two very old and virtually unchanged staples of the home. But at CES, devices ranging from pet trackers, automated door locks, smart clothing, and Wi-Fi connected ceiling fans were just some of the new products that were featured. The current trend is to provide wireless connectivity to everything. Startups are not the only groups innovating in the space; large companies such as Apple and Samsung are also betting on a future filled with connected devices.
a) b)
Figure 1: a) FitBit Surge fitness watch. b) Nest Learning Thermostat.
Image Sources: a) FitBit, b) Nest
Another class of pervasive devices was also featured prominently at CES; wearables and activity trackers. Spawning from the quantified self-movement, wireless heart rate monitors, breathing monitors, sleep monitors, and step counters have provided tech savvy individuals with a means to collect and visualize their personal data [39]. Companies like FitBit and Jawbone have designed elegant fitness trackers that capture multiple points of
sensing from activity, to heart rate, to step count. This data is sent to an app and beautifully visualized for the user.
Based on personal research as well as research of the Changing Places Group, it can be seen that the eventual culmination of Internet of Things and wearables will be seamlessly blending into the environment. Devices that quantify will no longer be tethered to the
individual but rather embedded in the environments the individual interacts with the most; from the home to the workplace, to even the city itself.
Healthcare and diagnosis of disease will benefit from this future because every person will have a rich set of behavioral and physiological data associated with them. Those with chronic diseases that require vigilant monitoring, elderly individuals who want to live longer in their homes unassisted, people with disabilities who need new ways of controlling devices and interacting with their home will all stand to benefit from pervasive sensing and control.
For this thesis, a system was developed that could provide coordinate and pressure awareness to many of the commonly used surfaces within a home and be able to adapt to the different conditions of the space and requirements of the user. This hardware
platform could not only serve the healthcare sector but any other industry who's goal is to understand and capitalize on human behavior and data. From entertainment to security to fitness, different developers could use the same hardware to create different interactions and applications for a connected environment. Several years from now, environments will be app-based. Devices in a space will communicate with each other like components in a computer. All the sensors, screens, and peripherals will operate under the same communications umbrella. It is at this point that developers can take all of the smart objects in a space and put them to work. Make them work together to create new and meaningful applications that are more personal and more specifically cater to the
individual because they are informed by the very data of that individual. As argued in this thesis, sensing capabilities on the largest surfaces in any given space, such as the
floors, walls, tabletops, can be used to passively capture human location and activity data as well as actively control elements within a connected environment. For this paper, a focus is given to surfaces and surface-based sensing, but the expectation is that such a system will be just one of the many components of the future connected home or environment.
2. Connected Devices:
2.1 Intro and Overview:When sensing and networking capabilities are given to historically unconnected devices or products, an entire world of new possibilities is opened. Optimization, feedback and control become standard features, and with those abilities, the ways users operate or interact with these devices can be enhanced. Three projects developed in the Media Lab that demonstrate the power of giving intelligence to historically unintelligent objects are the CityHome, CityFarm, and Athena Breast Pump. For each project the existing mode was redesigned and prototyped to incorporate sensing, feedback, and interactive
capabilities. The CityHome was a prototype of a small-scale intelligent home. The CityFarm is a sensing and connected hydroponic and aeroponic farming laboratory. And the Athena Breast Pump was a software-defined breast pump with a digital interface and data feedback capabilities.
2.2 CityHome:
Figure 2: CityHome prototype.
The CityHome project was a prototype solution to the problem of high cost of living in the major metropolitan centers of the world such as San Francisco, Tokyo or New York. As more people move into these cities, the limited real estate available becomes
prohibitively expensive and forces many to relocate. Because only certain demographics are able to afford the high prices, gentrification begins to occur and much of the original cultural diversity of that area disappears. Our group's hypothesis is that innovation flourishes if more people are able to live and work in the city centers rather than commuting to work and leaving at the end of the day.
New real estate development is an obvious solution to the space issue, but it is certainly not a cost effective and sustainable approach. Enough space to accommodate the living requirements is already there; it just isn't being utilized efficiently. One popular approach is the "micro apartment" where small, few hundred square foot apartments are being offered in lieu of the larger more costly flats. While more space efficient, tenants are now faced with the problem of trying to fit a normal-sized apartment's worth of furniture and furnishings into a space a third or quarter of the size. Multi-use or "transformable" furniture pieces such as the Murphy bed are one way to optimize space usage in a micro-apartment but almost all are purely mechanical and require manual operation to move between modes.
The CityHome project began with a single question "how can you live on a 200 ft2
footprint?" The solution has two parts, robotic transformation and digital interaction. Rather than having mechanical furniture pieces that must be manually actuated, what happens when those same pieces become robotic and able to move themselves? For the
CityHome project, we designed a single wall module, which contained powered furniture including a bed and a desk that could deploy or collapse on demand. The wall itself was also able to roll across the space. Robotic furniture meant that the space was able to reconfigure itself without any human intervention (though that option was still designed into the system). Using the same floor area, one could summon a living room, office, bedroom, dining room, or bathroom. Rather than having a room for each, the available area in the apartment becomes multimodal. On top of the robotic transformation, a suite of satellite embedded devices was incorporated including lights, a projector, and blinds, which were addressable with voice or gesture commands. A Kinect sensor running off of a central Windows PC received the voice and gesture commands. These sensors and commands anticipated the likely future of the "app based home" where features and functionality can be downloaded into your home like apps on a cell phone.
2.2.1 Transformation:
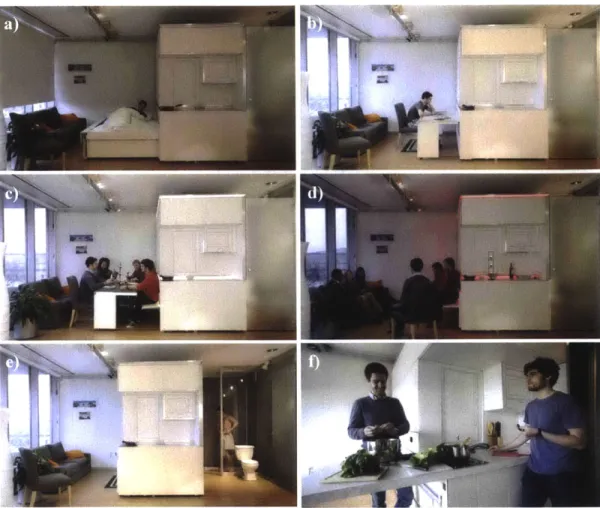
The lower portion of the wall module contains the bed and a desk as well as the robotic systems needed to deploy and collapse them. The upper portion of the wall contains modular shelving which allows customization of the design to fit different apartment spaces. The home is able to transform into six primary modes. Sleeping, working, dining, lounging, bathroom, and kitchen.
Figure 3: a) Sleep mode. b) Work mode. c) Dining mode. d) Lounging mode. e) Bathroom mode. f) Kitchen mode.
2.2.2 Smart Elements:
The intelligent elements of the CityHome, representing possible Internet connected devices were all powered by Arduino microcontrollers [61]. From controlling motors, to positioning servos, to switching LEDs the Arduino microcontroller provided an easy-to-use yet powerful tool for connecting these disparate devices under a single operational protocol. To further unite the devices, all were connected to a single PC running
Windows 7. This PC served as the brain of the CityHome and anticipated a future where homes are equipped with their own computation. Having a Windows PC enabled the easy use of a Kinect sensor to handle gesture and voice commands. A C# script combining Kinect functions and calls to the Arduino allowed the team to program
features and modes incorporating multiple devices.
2.2.3 UI/UX:
Touch:
The CityHome provides three modes of interaction and control of the system, touch, voice and gesture. Force sensitive resistors embedded into the wall, desk and bed enabled touch. This allowed a user to manually "move" the system. Motors provided drive force commensurate with the force of the push. Forcefully pushing the wall or pulling out the bed made the action occur faster, while a delicate push or pull made the system slowly deploy.
Figure 4: FSR pad to actuate the CityHome wall module.
Voice:
Voice commands were enabled by the Kinect's built in speech interpreting library. Though we had to create a dictionary of predetermined phrases, we were able to
demonstrate a breadth of possible commands incorporating different aspects of life. To prevent the system from listening to every conversation and accidentally moving elements, an inclusion of "CityHome" at the beginning of the command ensures the system pays attention. Saying "CityHome, sleep mode" caused the blinds to come down, the lights to dim, and the bed to deploy from the wall. Likewise, saying "CityHome, wake up" after getting out of bed caused the blinds to rise, the lights to turn on, and the bed to collapse back into the wall, freeing the space in the living room. Many other modes were programmed into the system including ones that displayed the weather on the wall, projected a newspaper onto the desk, and even a party mode, which flashed the lights and played a party soundtrack using the Spotify API.
Gesture:
Like voice, the gesture commands were enabled by the Kinect's built-in skeleton tracking capabilities. To enter gesture mode, a user had to stand in the living room facing the wall and raise his/her right hand and hold it in place. This was done to ensure gestures would not be interpreted from general activity within the space. Once the hand is raised for two seconds, the built in wall lights turn red and flash twice to indicate that gesture mode has been entered. The lights then switch to white and pulse from dim to bright continuously to indicate that the system is waiting for a command. If the user points at a controllable element, it then begins to respond to the gesture commands given.
Figure 6: a) Pointing to engage the lights. b) Commanding the desk to move. c) Adjusting the hue of the lights. d) Deploying the bed. e) Adjusting hue of the lights. f) Locking in a specific light color. g) Newspaper projected onto the desk.
Pointing at either the bed or table and then holding their hand either close or away from their chest will allow a user to deploy or collapse one of the furniture elements from the wall. Pointing at the lights and moving their hand side to side or up and down will allow the user to scroll through different colors and brightness levels respectively. Pointing at the blinds and either raising or lowering their extended arm allows the user to raise or lower the height of the blinds. Finally, pointing at the pico-projector and then pointing at the desired surface (apartment wall, wall module, desk, or near the couch) will cause the projector to orient itself at the surface and project a custom screen on the area. Near the couch, it is a TV remote. On the apartment wall, the weather is displayed. On the desk, the system scrolls through a New York Times article, and on the main wall module, the
App Store is displayed.
2.2.4 App Ecosystem and Store:
From descriptions of the various CityHome features, one can begin to see the potential for meaningful and useful applications that can be downloaded directly into the home and make use of the various smart elements incorporated into the architecture. Currently there are many Internet connected devices each operating alone and communicating over different protocols. Each device probably has its own iPhone or Android app, which allows a user to control that device specifically. In designing and building the CityHome we wanted to understand what the interactions may be like if all devices were
communicating with each other and all run under the same operational umbrella. In doing so, the devices are no longer standalone, but rather pieces of the greater connected ecosystem.
~ Utilizing light fixtures adopted with powerful LE s. Spectrum by ChyHome allows residents to change home ghting
through gesture control. Choose an 4.8 iniviidual can or multiple to adjust the
mood of your room and change a setting
from ordinary to extraordsnary s Read 35 reviews
Spectrum
Figure 7: Sample downloadable app that uses the existing hardware of the home.
A developer can then use one or many of these devices to design new and meaningful
applications that can be downloaded directly into the system. For example, rather than buying an alarm clock, a developer can design an alarm clock app, which incorporates the robotic bed, lights, and music built into the CityHome. When the user needs to wake up, the bed gently shakes back and forth, the lights gradually get brighter, and a selected song begins playing and gradually gets louder.
As more devices are added to the system, the opportunity for new applications is
expanded. Companies can focus on designing devices and apps rather than designing an ecosystem to accompany the former. That is the power of the single protocol device ecosystem.
This aspect of the CityHome inspired the bulk of the investigation described in this thesis. Of particular interest was understanding what the possibilities were if one were able to use the connected devices of the home as the basis for applications. How can data collected about the user, from their decisions, patterns of activity, and preferences be then fed back into the system for meaningful and interesting applications?
If all the devices and sensors are working together, sensor fusion can be used to paint a
more complete picture of the space. Different sensors monitoring different aspects of the environment i.e. thermostat monitoring temperature, smoke detectors monitoring gasses, and automatic lighting monitoring ambient light levels can all contribute data to give a comprehensive environmental snapshot. Multiple sensors working together can also provide missing or complimentary information to inform a system decision as well as corroborate observations and conclusions drawn by the system.
2.3 CityFarm:
The CityFarm is a set of projects which aim to address the problem of sustainable food production and food security. The current system of food production and food distribution is not a long term solution; vast areas of land are devoted to growing single types of crops, and forests are cut down to make more room to grow. Water, pesticides, and fertilizer are used in large quantities and are often oversupplied to the plants to account for losses into the soil. Once the food is grown it needs to be picked, packaged, and shipped by land air and sea to their final destination, often outside the country of their origin. Fuel is used for transportation and refrigeration and still crops are lost in transit. As more people move into the cities and the population increases in general, this method of growing will no longer be able to provide the food necessary. Even now, many of the crops lack nutritional value and clearing more land for more farming wont solve the problem of providing nutritious food to a large population, all while conserving vital resources such as fuel and water. The CityFarm group believes that the future of growing is not in the soil but rather soilless, with aeroponic and hydroponic agricultural methods. These techniques use significantly less resources, create faster grow cycles, and generate plants with better flavor and higher nutritional content. These farming
technologies can then be deployed right in the urban centers to provide food, jobs, and education for the people of those communities.
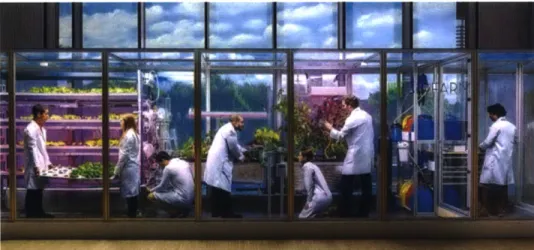
Figure 8: CityFarm hydroponic/aeroponic research lab. Image Source: Wired UK
Even though these technologies are able to provide a sustainable alternative to
conventional agriculture, we feel that the US is not quite ready to accept it. Most people associate these growing techniques with the production of Marijuana, which itself is a water-hungry plant. Countries like the Netherlands and Japan already use these
techniques for food and crop production and as a culture they understand the benefit of using these techniques. To encourage more acceptance we aim to develop open source growing, control, and containment technologies for the personal level, research
laboratory level, and industrial production level. Designing standard kits of parts,
sensing systems, and control software will enable more people to build their own systems and make improvements, upgrades or changes. This information can then be shared as hardware components or software updates.
2.3.1 Aeroponics:
Originally developed for use in space, aeroponic growing involves spraying a fine mist of water mixed with fertilizer at the roots of growing plants. These types of growing
systems can reduce water usage by 98%, fertilizer usage by 60%, and pesticide usage by
100% [37]. Crops grown this way (as verified in our own experiments) grow faster, taste
better, and have a higher nutritional content.
2.3.2 Hydroponics:
Like aeroponic growing methods, hydroponic growing removes the need for soil and instead submerges the roots of the plants in a water and fertilizer mixture. Faster plant growth is associated with this method as well as reduced water and fertilizer consumption
[37].
If fluorescent or LED lighting provides the light source, these types of growing systems
can be placed anywhere there is room. There is no need for sun visibility. The only requirements then become access to water, electricity, fertilizer, and HVAC.
The only final factor to consider is the environment around the growing plants. If the air and water qualities of the grow environment can also be controlled, plants can be grown anywhere around the world, regardless of local environmental conditions. We have designed sensor modules and containment environments that isolate the growing plants to ensure that everything about their growth is controlled. The sensors provide nearly constant readings of the local and global air and water parameters and the data can be accessed via a web interface. With this connectivity, any variation in the data will trigger an alert so that the user could then manually fix the problem or have the system self-correct.
2.3.3 Sensing Modules:
Rather than having sensors monitor the general grow environment, we wanted to create modules that provide sensing on a plant scale. If a set of plants is grown in a certain container, that container should have its own air and water sensing, so that the current health and status of every plant can be monitored and controlled. To achieve this goal, two modules of sensing were created, air and water. The air sensor modules sat amongst the plants on top of the growing container and the water sensors were placed in
waterproof boxes with probes sitting inside the container's reservoir.
Air Sensors:
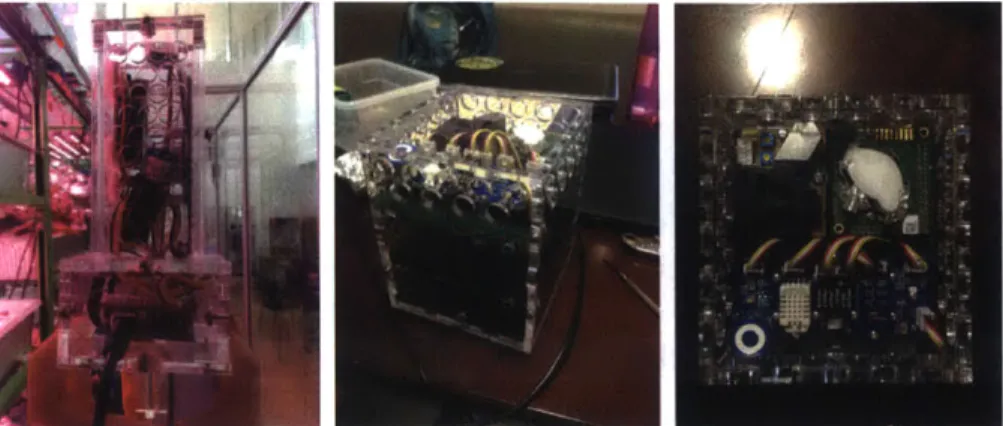
Figure 9: Air sensing modules. Same sensors but different form factor.
Using mainly Seeed Studio sensors, Grove connectors and a Grove Arduino shield, we monitor temperature, humidity, light intensity, carbon dioxide, oxygen, nitrous oxide, carbon monoxide, and dust [77]. The data is passed from the Arduino to a Raspberry Pi via USB serial and then to the server via Ethernet for visualization on the website. The enclosure was designed to be low profile and to allow air circulation while deterring possible splashing or moisture contact with the sensors. The design was laser cut and held together with nuts and bolts rather than adhesive in case repairs, sensor swapping or additions or other modifications were needed.
Water Sensors:
Figure 10: Water sensing module. The sensors are lit up and the Raspberry Pi receiving the data is to the right.
The water sensing was done with Atlas Scientific's water sensing boards and probes [82]. We measure pH, Oxidation Reduction Potential (ORP), Electrical Conductivity (EC), and Dissolved Oxygen (DO). These sensors report to either an Arduino or Raspberry Pi and then get visualized on a web interface.
2.3.4 Data Recipes:
Using a combination of sensing and environmental control such as heating and air venting, one is able to set specific values and let the system adjust itself to those levels.
Currently this feedback control only works with air temperature, but we soon hope to have humidity, and fertilizer levels controllable as well. With this control, one person is
able to mimic the growing conditions of another. For example, a user has figured out how to grow a specific, exotic plant. They have set the temperatures, light levels and schedule, fertilizer amounts etc. and it has yielded a successful plant. The system can store all of those settings and generate a "data recipe" that someone else with a growing system can then take and download. Their machine then sets the environmental and water parameters to those specified in the recipe. Then with only seeds to begin, the other user can replicate the first user's success at growing that crop without having to go through all the trouble of finding out what works.
2.3.5 Potential:
Using sensing, feedback, and an easy to understand and access UI, we hope non-farmers are able to take these technologies and be able to grow crops at a personal as well as large scale level. The data collected from each grow cycle can inform future growth and get contributed to a centralized repository which will determine the best parameters for each crop people try to grow. Recipe sharing is possible because of the ability to control the grow environment. Suddenly an entire group of people who had no knowledge of farming techniques or agriculture can grow their own food, just through data sharing and sensing.
2.4 Athena Breast Pump:
The Athena Breast Pump is a software driven, responsive breast pump, which can intelligently modify pumping patterns and is able to both optimize lactation as well as reduce user stress via a novel interface to pumping.
Figure 11: Completed breast pump showing the white cylindrical enclosure and collection flange and bottle from an off-the-shelf pump.
The current gold-standard breast pumps virtually all use a process-centric interface, which, through knobs or buttons, allows the user to control the pumping strength and frequency. Most nursing mothers we have talked to dislike the interface and often have to fidget with the settings until something suitable is reached. The stress of discovering these settings, on top of the stress associated with pumping in general creates a negative experience. We explored possible mitigation of these issues by developing a novel pump software-control mechanism that enables the use of a complimentary user-centered
(rather than process-centered) interface.
2.4.1 Prototype System:
Figure 12: Electronics of the pump prototype including an Arduino Nano, bluetooth module, and other circuitry to drive the motors and collect sensor data.
The goal of the current prototype is a proof of concept for three principles. The first is to create a pump that can drive a variety of collection mechanisms (from different
companies) through flexible software control. The second is to create a responsive platform that enables the use of a user centered interface design. The third is to create a platform that lowers the barrier for further research and enables big data collection of pumping parameters and experience, which in turn allows for optimization and
improvement in the field.
2.4.2 Hardware and Sensing:
Most existing breast pumps are hardware-defined, with their pumping mechanism
hardcoded on to the electronics of the device, and without driving these mechanisms with sensor data, these pumps are unaware and therefore unresponsive to changing pump or user states. By being software-driven and sensor-equipped, our pump prototype can drive a variety of mechanisms such as pumping cycles based on user and pump data:
Sensing at the pump: Using a pressure sensor at the internal pump, we are able to
monitor generated vacuum. This in turn provides feedback information on the frequency and amplitude of the pumping generated by a given actuation pattern of the pump.
Sensing at the breast: A pressure sensor incorporated at the flange (between the last
vacuum separation membrane, if any, and the breast) provides information about the actual pressure profile being generated at the breast.
Pump-as-platform: This is a data-driven pump + API. What this also allows is further research to be conducted and collected more quickly and more easily than is done today.
2.4.3 Affordances of a Human-Centered Pump Interface:
A software-driven, sensor-equipped pump affords a highly responsive and
human-centered user interface. Our pumps API allow this interface to be instantiated on a mobile device, computer, or cListom hardware.
Personalized Pumping: We demonstrate a person-centered interface for adjusting
pumping speed and pressure. Rather than expose controls for increasing and decreasing these settings, like the mechanism-centric interfaces of existing pumps, we frame the adjustments in humanistic terms: comfort, discomfort, and time constraints.
Timely, Data-driven Insights: Sensor data from the pump can be used to queue a
collection of meaningful insights integrated onto the pumping platform. These insights can also take the form of data-driven support and encouragement, interventions and device warnings, celebration or success, or learning.
Accessible, connected support and learning resources: Pumping data and learning/
help resources can be tightly coupled. Users can quickly access advice that addresses pumping challenges, and these topics can be organized based on user and pump data.
Implicitly social support: Pumping can be an isolating experience, in part because social
attitudes toward pumping and breastfeeding mean many women must pump in private. A software-defined pump is uniquely capable of integrating web-enabled social technology into the pumping interface.
Figure 13: Personalized and more informative pumping interface running on a tablet. Options are provided for assistance, information and comfort.
We demonstrated through our prototype that small improvements to a historically unintelligent device not only has the potential to improve the experience for those using the device, but it can also provide informed guidance and information for the user and others who are facing similar issues. Sensing on the pump paired with an intelligent controller can fine tune the settings and remove that burden from the user. Data collected can inform the user and medical professionals where problems may be occurring so that help is more direct and faster. Finally by designing a novel UI built around the
experience rather than the action, we aimed to lower the stress of pumping and provide personalized, and informed encouragement and assistance to those who need it.
3. Research Motivations:
3.1 Overview:Pervasive, surface-based sensing could have a variety of meaningful applications across multiple areas from architecture to healthcare. Discussed below are the motivations for researching and developing this type of sensing. The primary area of focus is aging in
place, and using surface-based sensing to assist the elderly population by monitoring for
mobility and cognitive decline as well as unexpected events such as falls or other medical emergencies. Secondary areas of focus are new interactions enabled through pervasive
sensing. How could such a system be used to enhance the way somebody interacts with their home or living/working environment?
3.2 Aging In Place:
Compared to only 100 years ago, human life expectancy has increased by almost 30 years and by 2030, the number of Americans age 65 and older will be about 71 million [6]. Today, because people are living longer, there are two generations that make up the aging population with the fastest growing segment consisting of individuals 85 years and older.
80% of seniors have one chronic disease, with half of that same group suffering from two
chronic conditions. Even among US adults, 45% have at least one chronic condition and
by the time seniors reach 85, some may have three or four chronic conditions [7]. These
chronic ailments, the cost of which is about $2 trillion yearly, range from diabetes, to visual or mobility impairments, to more serious conditions such as Alzheimer's or
dementia.
As the population ages, the number of caregivers is expected to decline while the wait times for nursing homes has been increasing yearly. For example, in Ontario, since 2005 the wait times for nursing homes have tripled [5]. The lack access to long-term care paired with healthcare cost cuts has shifted responsibility from hospital/long-term care to the home. Now it is more common for care to "be delivered by family members" [5, 6].
Many aging or senior individuals do not want to go to homes and more would rather stay independent and live in their homes, i.e. age in place. Thus the CDC defines aging in place as "The ability to live in one's own home and community safely, independently, and comfortably, regardless of age, income, or ability level" [14].
With many families living far apart, monitoring and sensing technologies are being explored as a powerful solution to address some of the problems associated with aging in
place. Because of the promise of extended autonomy and peace of mind, more seniors
are agreeing to being tracked by their caregivers. The use of wearable and internet connected devices will soon know "all of your vital signs, know your nutritional habits, know exactly where you are and how you are moving, note your weight, blood sugar, etc.
and deliver them to caretakers" [4]. The movement towards platforms such as Apple HealthKit and Samsung Healthcare promise even more opportunities for diagnosis and monitoring when data from different devices can be exchanged and combined.
With the current quantified self-movement, wearables are tracking anything and
everything, but Wired argues that what's missing is "common sense or ambition" in the data [7]. Fitness trackers provide superficial information for tech-savvy millennials who probably don't benefit as much from this constant monitoring. More than half of the US
consumers who have owned an activity tracker no longer use it, with a third stopping within the first six months. The director of Qualcomm Life urged developers to "stop
screwing around in a saturated market for activity trackers and embrace the red-tape and regulatory friction of the healthcare industry" [7]. Simply put, more developers are
designing non-clinical or pseudo-diagnostic health monitoring tools for those who really don't need them. Meanwhile, of the adults with chronic conditions in the US, 40% with one chronic condition track their health, and 62% of adults with two chronic conditions do so. There are fewer devices that are intended for that market. The aging and elderly population is no different. If wearable technologies and data-based monitoring and
diagnostics were applied, more individuals would be able to live at home longer, and not only that, but more conditions can be caught before they become serious problems. Professor Elizabeth Mynatt of Georgia Tech has researched aging in place and the role technology and sensing will take to assess some of these problems. Three key problem
areas Mynatt and her group identify are crisis recognition, cognitive support, and awareness of daily life and long-term trends.
Crisis recognition is responding to an immediate crisis such as a fall, or an impending crisis such as a broken heater in the winter and the "house must recognize potential problems and notify residents and outside support" [9]. Cognitive support includes systems to "recognize forgotten or interrupted tasks and assist the occupant in resuming them" as senior adults are prone to lapses in memory [9]. Awareness of daily life means maintaining daily contact between family members. This contact provides a sense of security for the senior adult and peace of mind for the rest of the family.
By receiving sensor information that indicates health, fitness, environment, relationships,
social interaction, events, and activity, a family is able to see quantitatively and qualitatively how their loved-one is doing. Cognitive and physical abilities change slowly over time, and an individual living alone and away from their family may not have someone to notice these changes as they are occurring. By using real-time and historical sensor data, information and trends about the loved-one is provided constantly to the family.