Publisher’s version / Version de l'éditeur:
AIChE Journal, 52, 10, pp. 3411-3420, 2006-08-24
READ THESE TERMS AND CONDITIONS CAREFULLY BEFORE USING THIS WEBSITE. https://nrc-publications.canada.ca/eng/copyright
Vous avez des questions? Nous pouvons vous aider. Pour communiquer directement avec un auteur, consultez la première page de la revue dans laquelle son article a été publié afin de trouver ses coordonnées. Si vous n’arrivez pas à les repérer, communiquez avec nous à [email protected].
Questions? Contact the NRC Publications Archive team at
[email protected]. If you wish to email the authors directly, please see the first page of the publication for their contact information.
NRC Publications Archive
Archives des publications du CNRC
This publication could be one of several versions: author’s original, accepted manuscript or the publisher’s version. / La version de cette publication peut être l’une des suivantes : la version prépublication de l’auteur, la version acceptée du manuscrit ou la version de l’éditeur.
For the publisher’s version, please access the DOI link below./ Pour consulter la version de l’éditeur, utilisez le lien DOI ci-dessous.
https://doi.org/10.1002/aic.10946
Access and use of this website and the material on it are subject to the Terms and Conditions set forth at
Effect of dynamic vulcanization on co-continuous morphology
Bhadane, Prashant A.; Virgilio, Nick; Favis, Basil D.; Champagne, Michel F.;
Huneault, Michel A.; Tofan, Florin
https://publications-cnrc.canada.ca/fra/droits
L’accès à ce site Web et l’utilisation de son contenu sont assujettis aux conditions présentées dans le site LISEZ CES CONDITIONS ATTENTIVEMENT AVANT D’UTILISER CE SITE WEB.
NRC Publications Record / Notice d'Archives des publications de CNRC:
https://nrc-publications.canada.ca/eng/view/object/?id=6007c684-3c55-45cc-a47b-d2531fb23caf https://publications-cnrc.canada.ca/fra/voir/objet/?id=6007c684-3c55-45cc-a47b-d2531fb23caf
Effect of Dynamic Vulcanization on Co-continuous
Morphology
Prashant A. Bhadane, Nick Virgilio, and Basil D. Favis
CREPEC, Dept. of Chemical Engineering, E´ cole Polytechnique de Montre´al, Montre´al, Que´bec, H3C 3A7 Canada
Michel F. Champagne and Michel A. Huneault
Industrial Materials Institute, National Research Council of Canada, Boucherville, Que´bec, J4B 6Y4 Canada
Florin Tofan
Lavergne Group, Montre´al, Que´bec, H1J 1C8 Canada
DOI 10.1002/aic.10946
Published online August 24, 2006 in Wiley InterScience (www.interscience.wiley.com).
This study examines the effect of dynamic vulcanization on the co-continuous morphology in ethylene-propylene-diene terpolymer (EPDM)/polypropylene (PP) blends using a technique of morphology investigation involving focused ion beam (FIB) etching of the sample surface, followed by topological investigation of the sample surface using tapping mode atomic force microscopy (TMAFM). The FIB ion etching rates of EPDM and PP are distinctly different, and these differences create a significant topological contrast between the phases when subsequently ana-lyzed by atomic force microscopy. This approach allows for the high-resolution observation of dispersed EPDM, and phases as small as 100 nm, are clearly identified. Since it is shown that the etching rates of noncrosslinked and crosslinked EPDM are similar, it was necessary to selectively remove the noncrosslinked EPDM phase by solvent dissolution. This combination of techniques then allows for the clear distinction of polypropylene, as well as noncrosslinked and crosslinked EPDM phases in the blend. The high-resolution micrographs together with the continuity data, surprisingly, indicate that a noncrosslinked co-continuous EPDM phase (␣-network) transits to a finer network of crosslinked EPDM (-network) after dynamic crosslinking. It is suggested that this
-network is produced as a result of the viscosity mismatch between the noncrosslinked and
crosslinked EPDM melt occurring at the outer envelope of the ␣-network during dynamic crosslinking. As the crosslinked material pulls away from the noncrosslinked material under dynamic melt mixing conditions, it creates a smearing effect. It is shown that the initial ␣-network maintains its continuity and demonstrates a diminished pore diameter as crosslinking proceeds. Furthermore, when the noncrosslinked material is extracted almost no crosslinked phase (⬍1%)
is found to be present in the extract. These results strongly indicate that the crosslinking proceeds initially at the outer envelope of the EPDM phase, and works its way toward the center.© 2006 American Institute of Chemical Engineers AIChE J, 52: 3411–3420, 2006
Keywords: polymer blends, co-continuous morphology, dynamic vulcanization, thermo-plastic vulcanizates, FIB/TMAFM
Introduction
Thermoplastic vulcanizates (TPVs) offer the performance of a thermoset rubber together with the processing ease and
re-cyclablity of thermoplastic materials. The inverted matrix type of morphology, a morphology in which the high composition phase remains dispersed in the low composition matrix, is the key behind their performance. The above morphology is ob-tained from an initial thermoplastic-in-rubber dispersed droplet morphology by a process called dynamic vulcanization. It is the process in which a high composition elastomer phase is in
situ crosslinked during melt blending. The evolution of an
Correspondence concerning this article should be addressed to B. D. Favis at [email protected].
© 2006 American Institute of Chemical Engineers
inverted matrix morphology from a dispersed thermoplastic-in-rubber droplet morphology, as dynamic crosslinking pro-ceeds, is known to transit through co-continuous morphologies, but is not well understood.1-2A co-continuous blend
morphol-ogy is one in which neither of the blend phases can be defined as a matrix or the dispersed phase. It forms highly intercon-nected and intertwining structures, and both the blend phases remain fully continuous throughout the blend.
Our two previous articles3,4examined the detailed
morphol-ogy, continuity development and co-continuity in non-crosslinked ethylene-propylene-diene terpolymer (EPDM)/ polypropylene (PP) blends. Despite the major commercial significance of EPDM/PP TPVs, many fundamental questions related to the effect of dynamic crosslinking on the microstruc-ture of these blends have remained unanswered. This is due, in large part, to the tremendous challenge of differentiating the phases in such a blend system. The similar chemical nature of EPDM to PP and the very low interfacial tension of the blend make it arguably one of the most difficult polymer pairs for morphology characterization in the entire polymer blend liter-ature. Classical techniques, such as the selective staining of EPDM by osmium or ruthenium tetraoxide with subsequent characterization with transmission electron microscope (TEM) or scanning electron microscope (SEM) do not provide effec-tive contrast between the various phases of the TPVs.2,5-7
More recently, a number of authors have applied atomic force microscopy (AFM) in various operating modes such as contact,8-10lateral (friction),8tapping,7,10-11and force
modula-tion5,7-8,12in order to characterize these complex morphologies.
For noncrosslinked blends, they were not only able to differ-entiate between the domains of EPDM and PP, but frequently revealed the complex structure of amorphous and crystalline regions in the elastomer itself. The technique was also shown to be successful in identifying the different fillers, compatibi-lizers, and the qualitative crosslink density distribution in the blend. Because of the soft EPDM phase, and the hard PP phase, contact, lateral (friction) and force modulation modes were found to produce better results than the tapping mode.5,12
Nevertheless, these micrographs still lack quality and do not present convincingly sufficient contrast between non-crosslinked and non-crosslinked rubber phases in the blend. Further improvement in contrast is necessary in order to understand the mechanism of morphology development in TPVs, as well as the effect of dynamic vulcanization on co-continuous morphol-ogies.
Recently, Virgilio et al.13demonstrated the applicability of
focused ion beam (FIB) preparation followed by tapping mode atomic force microscopy (TMAFM) to analyze model inter-phase thicknesses in high density polyethylene/polystyrene/ poly(methyl methacrylate) (HDPE/PS/PMMA) ternary poly-mer blends. Those systems were comprised of a polyethylene matrix and a dispersed phase composed of a PS shell and a
PMMA core. FIB, most commonly, employs gallium ions with a typical energy of 30 keV. In sample preparation by such a technique, a beam scans and gradually etches the selected sample surface due to collision of the ions with the material. It was shown in that work that the three polymer components have different ion beam etching rates, which creates a topo-logical contrast between the phases of the blends when viewed by TMAFM. The contrast levels obtained were so high that this approach allowed for the estimation of PS interphase thick-nesses from 100 to 200 nm depending on the PS/PMMA composition ratio.
The objective of this work is to apply the FIB/TMAFM approach to thermoplastic vulcanizates and thereby study the effect of dynamic vulcanization on the phase continuity and co-continuity in EPDM/PP blends.
Experimental Procedures
Materials
In this study, one EPDM and two PP homopolymers with significantly different viscosities were used. The EPDM grade contains ethylidene norbornene (ENB) as the diene. For chem-ical crosslinking of the EPDM, bromomethylated alkyl phenol-formaldehyde heat reactive resin (SP-1056) from Schenectady International Inc., was used in conjunction with zinc oxide (ZnO) as a hydrogen halide scavenger. Some of the other characteristics of the materials are summarized in Table 1.
Rheological characterization
The neat EPDM, and PP containing 0.5 wt % Irganox B 225 were compression-molded at 190 °C in the form of disks. The rheological characterization was carried out using a Bohlin constant stress rheometer (CSM) in the dynamic mode. The experiments were performed in parallel plate geometry of 25 mm dia. at 190 °C and under a nitrogen atmosphere. The time and stress sweep tests were performed to determine the thermal stability of the materials and the linear zone. Accordingly, frequency sweep tests were performed using several samples to respect an experimental window permitted by the time and stress sweep tests.
Melt blending
PP, EPDM and antioxidant were first dry blended and then fed simultaneously into the mixing chamber. The two polymers were melt-blended using a Haake Rheomix 600 batch mixer with a Haake system 90 drive for 8 min, at 100 rpm, 190 °C temperature, and under a nitrogen blanket. This internal mixer is equipped with a 69 cm3chamber and roller-type rotors. The materials were weighed accurately such that the mixing cham-ber was filled to approximately 70% of its total volume.
After 8 min of mixing the master batch, a mixture of 50 parts Table 1. Characteristic Properties of the Materials
Polymer Supplier Given Name Molecular Weights⫻ 103 Ethylene Content (%) ENB Content (%) Mn Mw PP Basell PP 1 89 288 — — PP Basell PP 2 166 773 — — EPDM Bayer EP 1 71.2 141.9 62 4.0
EPDM/50 parts curing resin, was added to achieve the desired degree of gel content. This quantity comprises only 0.5 to 7.0% of the final volume of the blend. At 9 min of mixing, 5 parts of ZnO (based on the rubber content (phr)), was added to the mixture and the mixing was continued thereafter for 4 more min. After mixing, the melt was carefully taken out of the mixing chamber and was quenched immediately in cold water to freeze-in the morphology generated during melt mixing.
In total, two different viscosity ratio blends, 0.7 (EP 1/PP 2) and 5.0 (EP 1/PP 1), from 30 to 70% EPDM content (in steps of 10 vol %) were crosslinked to about 50 and 100% gel content. Using an empirical calibration technique developed by Marquez et al.14the average shear rate of 27 s⫺1 was
deter-mined under actual melt blending conditions.
Determination of gel content
At least two samples weighing less than 1 g were cut directly from the blend. The sample was then boiled in 100 mL of prefiltered xylene for 45 to 60 min. Thereafter, the solution was rapidly filtered at 140 °C through a 0.8 m membrane. An additional hot xylene wash was carried out to assure the com-plete removal of the PP and noncrosslinked EPDM phase. The weight of the filter membrane before, and after filtration and complete drying was noted. The gel content is determined using the following equation
% Gel content
⫽
冉
Wt. of the sample after extractionWt. of crosslinkable material in the sample
冊
⫻100 (1)Solvent extraction and gravimetry
The samples used for EPDM continuity measurement were extracted using cyclohexane at room temperature. The weight of the samples before extraction and after extraction and com-plete drying were noted. The comcom-plete phase removal was assured by comparing the sample weight after each solvent wash.
The wash solution was filtered using a membrane. The weight of the membrane before filtration, and after complete drying was measured to determine the amount of crosslinked EPDM phase present in the continuous part of noncrosslinked EPDM.
The continuity of noncrosslinked EPDM phase was mea-sured using the following equation
% Continuity ⫽
冉
Sample wt. before extraction ⫺ Sample wt. after extraction
Total wt. of EPDM in the sample
冊
⫻100 (2) The values reported are the average of at least two measure-ments done in this way.Focused ion beam (FIB) sample preparation and atomic force microscopy (AFM)
Specimens were first cryomicrotomed using a glass knife under liquid nitrogen to create a plane face. The instrument
used was a Leica-Jung RM 2165 equipped with a Leica LN 21 type cryochamber. Thereafter samples were plasma-coated and the focused ion beam (FIB) surface preparation was performed with a Hitachi FIB-2000A using a 30 keV Ga⫹ beam. The beam current was set at 0.8 nA and the dwell time at 3 s. A layer of approximately 3-4 m thick was removed by milling parallel to the observed surface, on an 80 m x 3-4 m section, with a fluence rate of 1.8⫻ 1015
ions/cm2/s.
The subsequent morphological observation of specimens by AFM was carried out with a scanning probe microscope Di-mension 3100 with a Nanoscope IIIa controller from Veeco Instruments. Silicon tips, model RTESP from Veeco, with spring constants of 20-80 N/m and a resonant frequency of approximately 320 kHz were used. The tip was oscillated at approximately 98% of the resonant frequency and the engage-ment on the surface was done at 95% of the free oscillation amplitude. Specimens were fixed on a metallic support using silver glue or graphite tape. More details on the technique are given by Virgilio et al.13
BET nitrogen adsorption
The solvent extracted porous samples from the solvent gravimetry were used for measuring the interfacial area (S) of the specimen. A Flowsorb 2300 BET instrument was used to carry out these measurements. The pore diameter was calcu-lated by assuming that the pores are: cylindrical in shape, the total volume of the pores is equal to that of the extracted phase (V), and the total surface area (S) is that of the pore wall. The pore diameter (d) can then be calculated as
d ⫽4V/S (3)
Li and Favis15 have described further details regarding this
technique.
Results and Discussion
Rheology
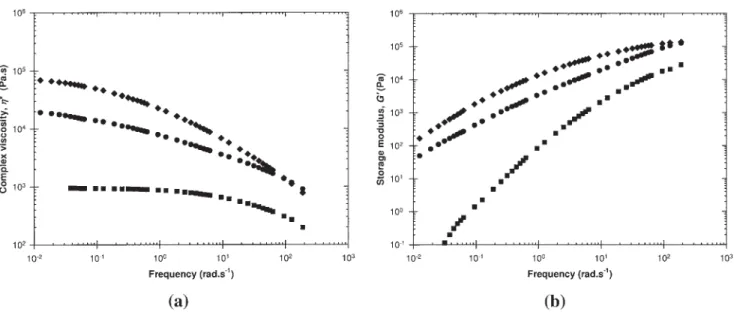
Figures 1 a and b present the complex viscosity and the storage modulus as a function of frequency, respectively. EPDM and PP are known to follow the Cox-Merz relation-ship16-18and, therefore, the complex viscosity can be treated as
the steady-shear viscosity, and the frequency in the rheometer can be treated as the actual shear rate. These conversions facilitate estimation of the actual shear rate during melt blend-ing and various rheological property ratios.
It can be seen that all the materials are showing a Newtonian plateau and shear thinning behavior. PP 2 is the most viscous and elastic, while PP 1 is the least viscous and elastic polymer of all. EP 1 possesses a viscosity and elasticity intermediate to that of PP 1 and PP 2 at an average shear rate of mixing in the internal mixer of 27 s⫺1. The rheological property ratios, such as viscosity ratio, torque ratio and elasticity ratio are evaluated at both constant shear rate and at constant shear stress, and are shown in Table 2. In the field of polymer blends, there is still some debate as to whether the rheological property ratios should be calculated at constant shear rate or at constant shear stress since the local shear rate at the surface of the droplet under deformation may be discontinuous (although the velocity may be continuous). The local shearing stress may also be AIChE Journal October 2006 Vol. 52, No. 10 Published on behalf of the AIChE DOI 10.1002/aic 3413
discontinuous, if we take into consideration the slip at the interface. Since no clear resolution of this issue has been demonstrated in the literature, we have chosen to show both calculations. In the rest of the article we will be referring to the rheological ratios estimated at constant shear rate.
Chemical crosslinking of EPDM
Figure 2 demonstrates the amount of gel content which can be achieved in a 50 EP 1/50 PP 1 blend, as a function of crosslinking agent, before and after applying corrections. The corrections arise because not all of the EPDM material in the blend is crosslinkable. The amount of noncrosslinkable mate-rial is determined as the combined EPDM fraction soluble in acetone and the fraction that remains insoluble in cyclohexane at room-temperature. The acetone soluble material is consid-ered as being noncrosslinkable, while the cyclohexane insolu-ble material is considered as being a polyolefin homopoly-mer.19Thus, for the EP 1 material 0.3% is found to be acetone
soluble and 3.2% is found to be cyclohexane insoluble. Thus, an average total correction of 3.5% is applied to determine the accurate gel content of the blends.
Figure 2 indicates that 0.81%, of crosslinking agent, based on the weight of EPDM is required to achieve 50% gel content. Four percent crosslinking agent is required to
ob-tain 100% gel content. In this latter case, in order to assure complete crosslinking, a slight excess, about 5.5% of crosslinking agent is used.
Figure 3 shows the amount of gel content achieved for a range of blend compositions. Some difficulty is associated with the precise control of the degree of crosslinking in these systems particularly at lower compositions. This, in part, depends on the amount of crosslinking agent able to migrate to the EPDM phase without being lost in the PP phase. This consideration clearly is more of a concern at low EPDM concentrations. However, at 50 –70% EPDM com-position a good control of percentage gel content is achieved. During crosslinking, attention is also given for signs of degradation of the crosslinking agent. Due to its low-viscosity, it has a tendency to migrate toward the wall of the mixer and degrade as a result of the high-temperature of the mixer wall.
Figure 3 clearly demonstrates that the vulcanization pro-tocol used here was successful at producing both 50 and 100% crosslinked EPDM phases in two systems of different starting viscosity ratios, EP 1/PP 2 (0.7) and EP 1/PP 1 (5.0). Most of the discussion that will follow will concentrate on the 50 EPDM/50 PP blend composition and on how dynamic vulcanization affects its co-continuous morphology. Figure 1. (a) Complex viscosity of the pure materials as a function of frequency at 190°C and (b) storage modulus of
the pure materials as a function of frequency at 190°C: F, EP 1; ■, PP 1; ⽧, PP 2.
Table 2. Rheological Property Ratios at Constant Shear Rate and Constant Shear Stress
# Blend Components Blend Name Torque Ratio At Const. Shear Rate Matrix Shear Stress (kPa) At Const. Shear Stress Dispersed Phase Matrix pa b pa b 1 EP 1 PP 2 EP 1/PP 2 0.7 0.7 0.5 90.9 0.5 0.7 2 EP 1 PP 1 EP 1/PP 1 4.0 5.0 6.5 11.7 12.0 1.0 3 PP 2 EP 1 PP 2/EP 1 1.4 1.4 2.0 69.4 2.5 1.5 4 PP 1 EP 1 PP 1/EP 1 0.3 0.2 0.2 69.4 — 1.0c
aViscosity ratio, based on complex viscosity (*). bElasticity ratio, based on storage modulus (G
⬘).
cBy extrapolation of the data.
PS.All the rheological properties are determined at an average shear rate in internal mixer of 27 s⫺1.
Microstructure of crosslinked blends
Micrographs after FIB ion etching, but prior to AFM obser-vation are shown in Figure 4. Micrograph 4a shows the surface of EP 1 melt-mixed with 5% zinc oxide, and micrograph 4b shows the surface of the 50 EP 1/50 PP 2 partially crosslinked blend containing 5 phr zinc oxide. Some white zinc oxide particles are clearly evident in both the micrographs, and care was taken in subsequent AFM characterization to analyze areas where no zinc oxide particles were present. FIB surface treat-ment can be seen to provide a very smooth surface in micro-graph 4a, for the case of pure EP, while the treatment leading to a topographical contrast between the EP and PP phases can be seen in micrograph 4b. Nevertheless, this contrast is still not
sufficient to clearly identify each phase and subsequent AFM analysis is necessary.
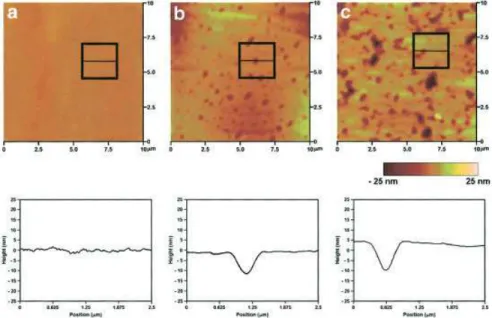
Figure 5 demonstrates the topographical surface image ob-tained by tapping mode AFM after FIB sample preparation for pure PP 2 (micrograph 5a), 20 EP 1/80 PP 2 noncrosslinked blend (micrograph 5b), and fully crosslinked 20 EP 1/80 PP2 blend (micrograph 5c). As evident in the micrograph 5a, the FIB sample preparation is yielding a very smooth surface for pure PP, and the surface generated remains free from any artifacts. Below the micrograph, a typical surface profile of pure PP 2 demonstrates an average roughness value of less than 2 nm.
Micrograph 5b demonstrates that FIB sample etching is generating an excellent topographical contrast between the PP and noncrosslinked EPDM phase. A very fine and uniform distribution of EP particles with phase sizes ranging from 100 to 500 nm is evident. The capability of combined FIB/AFM is clearly able to resolve the presence of very small EP domains. In an earlier publication,3 using SEM analysis, we
demon-strated that these dispersed domains are actually very fine diameter stable fibers. There is a good correlation between the phase size observed here and in that previous article.3 The
typical surface profile across a particle is shown below the micrograph. It is evident that EPDM is being etched more than PP and that a height difference of 12 nm exists between the phases.
Micrograph 5c, obtained after fully crosslinking the EPDM phase of the blend demonstrates similar structures of finely distributed phases in the blend. Micrograph 5c also demon-strates the occasional occurrence of a zinc oxide particle, as expected. Close analysis of the micrgraph clearly shows that the EPDM phase size has increased and that the phases have taken on a more smeared and distorted appearance. The mor-phological changes observed in the crosslinked EPDM phase are likely related to the effect of vulcanization on the viscosity of EPDM which will be discussed in more detail later on in this article. The surface height profile across a typical crosslinked phase demonstrates that the FIB preparation also etches the crosslinked EPDM more than the PP, and a height difference of 15 nm is observed. This height difference, however, is very similar to that observed for noncrosslinked EPDM and indi-cates that FIB ion etching alone is not able to differentiate between crosslinked and noncrosslinked EPDM.
Figure 6 presents the topological image of the 50 EP 1/50 PP 2 blend obtained by tapping mode AFM after FIB surface Figure 2. Gel content as a function of crosslinking
agent: , 50 EP 1/50 PP 1 (before correc-tion); , 50 EP 1/50 PP 1 (after correction).
Figure 3. Gel content as a function of EPDM composi-tion: , EP 1/PP 2 (50% crosslinked); , EP 1/PP 2 (100% crosslinked); , EP 1/PP 1 (50% crosslinked); , EP 1/PP 1 (100% crosslinked).
Figure 4. Micrographs after FIB treatment: (a) non-crosslinked EP 1 ⴙ ZnO, and (b) 50 EP 1/50 PP 2 ⴙ ZnO (EPDM crosslinked to 50%).
treatment. Micrograph 6a illustrates the structure of the non-crosslinked blend. The EPDM is evident as a red phase corre-sponding to a topographical valley of 30 nm. Note that al-though the EPDM appears to be dispersed in this 2-D micrograph, it is in fact fully co-continuous as confirmed by solvent gravimetry data in our previous article,3 and also as
shown later in Figure 7. For the purpose of further discussion, this co-continuous, noncrosslinked, 50 EPDM/50 PP morphol-ogy will be referred to as the “␣-network”.
Micrograph 6b shows the microstructure in a partially crosslinked 50 EP 1/50 PP 2 blend. It can clearly be seen in this
micrograph that vulcanization is resulting in significant mor-phological changes. Compared to micrograph 6a, a finer, more extensive EPDM network is evident. Furthermore, the phases are seen to be even more smeared and distorted than that seen in micrograph 5c.
In order to try to distinguish between noncrosslinked and crosslinked EPDM, the blend preparations used in micrographs 6a and b were initially subjected to a cyclohexane solvent extraction, and were then subjected to the FIB surface treat-ment. The TMAFM results obtained, thereafter, are shown in micrographs in 6d and e, respectively. Extracting out the non-Figure 5. TMAFM micrographs after FIB sample preparation and their topological height profiles: (a) pure PP 2; (b) 20
EP 1/80 PP 2 (0% crosslinked), and (c) 20 EP 1/80 PP 2 (100% crosslinked).
Figure 6. TMAFM micrographs of 50 EP 1/50 PP 2 after FIB sample preparation: (a) 0% crosslinked; (b) 50% crosslinked; (c) 100% crosslinked; (d) 0% crosslinked and EP 1 is extracted, and (e) 50% crosslinked and non-crosslinked EP 1 is extracted.
crosslinked EPDM phase creates an additional extreme topo-logical contrast due to the holes left in the sample, and the noncrosslinked EPDM phase can be clearly observed in the micrograph 6e. This noncrosslinked phase bears a close resem-blance to the largest phases in the micrograph found in 6a, b, and d, and, hence, it can be inferred that the fine network produced in micrograph 6b is the crosslinked EPDM phase. This fine network will be referred to as the -network in the rest of the discussion. Micrograph 6e also demonstrates a much
finer crosslinked phase, which is not evident in micrograph 6d. Unfortunately, in micrograph 6e, the analysis software tends to ignore, or designate less contrast to, the comparatively smaller variations in the topography of the sample because of the great depths of pores resulting from the extraction. Hence, the level of -network formation is not as evident in micrograph 6e, as it is in 6b.
Micrograph 6c presents the microstructure of a fully crosslinked 50 EP 1/50 PP 2 blend. A fine, extensive -network is observed. The network is much more highly developed than in micrograph 6b, due to the complete crosslinking of the system. This network formation is also confirmed with the results from the gel content measurements, that is, upon re-moval of the noncrosslinked EPDM and PP phases from the blend samples. The remaining crosslinked material remains structurally intact and maintains the original shape of the blend prior to extraction for both partially and fully crosslinked blends. These results unambiguously reinforce the concept of -network formation as seen in micrographs 6b and c. It should be noted that the structural integrity of the crosslinked EPDM upon extraction was maintained up to a concentration of 70% EPDM. At that composition and higher, the crosslinked EPDM phase is found to disintegrate into a fine powder upon removal of the noncrosslinked EPDM and PP phases.
These results indicate for the first time that co-continuous morphologies are changed as dynamic vulcanization proceeds and that a noncrosslinked, co-continuous EPDM phase (␣-network) transits to a finer network of crosslinked EPDM (-network). Coran et al.20does report a “network” of
vulca-nized elastomer, but it is worth understanding here that, unlike the finer -network evident in Figure 6 it was a network formed by physically touching, loosely bound together, vulcanized particles formed at higher compositions of an elastomer (⬇80% EPDM).
Effect of crosslinking on the continuity of noncrosslinked EPDM
In order to develop a better understanding of the structural nature of the noncrosslinked EPDM phase as dynamic vulca-nization proceeds, the continuity of the noncrosslinked phase was determined. Figure 7a shows the percent continuity of the EPDM phase in the blend, at different levels of crosslinking, as a function of the total EPDM composition in the blend. The EPDM phase in the noncrosslinked blends is about 50% con-tinuous at 30% EPDM content in the blend, and reaches co-continuity at a composition of 40% EPDM. When these blends are crosslinked to 100%, the noncrosslinked portion is so small that continuity falls to 0% at all blend compositions. However, when the 50 EP 1/50 PP 2 and 50 EP 1/50 PP 1 blends are partially crosslinked (⬇ 50%), the remaining noncrosslinked EPDM in the blend remains fully extractible. In other words, the remaining noncrosslinked material remains fully continu-ous even at 50% crosslinking. This phenomenon can be better understood from Figure 7b, where the percentage continuity is determined, based on the total amount of noncrosslinked EPDM phase remaining in the blend after partial crosslinking. Note that as the EPDM composition is increased to 60 and 70%, continuity actually exceeds 100%. This is due to the difficulty in accurately achieving and estimating a gel content (see error bars in Figure 2). A small overestimation of gel Figure 7. (a) Effect of dynamic vulcanization on
continu-ity: , EP 1/PP 2 (0% crosslinked); , EP 1/PP 2 (50% crosslinked); , EP 1/PP 2 (100% crosslinked); , EP 1/PP 1 (0% crosslinked); , EP 1/PP 1 (50% crosslinked); , EP 1/PP 1 (100% crosslinked) and (b) continuity of the non-crosslinked EPDM in the partially non-crosslinked blend as a function of EPDM composition: , EP 1/PP 2 (50% crosslinked); , EP 1/PP 1 (50% crosslinked).
content significantly affects the estimation of the amount of noncrosslinked material remaining in the blend. As a result, the value of continuity determined based on the noncrosslinked material remaining in the blend after crosslinking, that is, as in Figure 7b, exceeds the 100% value.
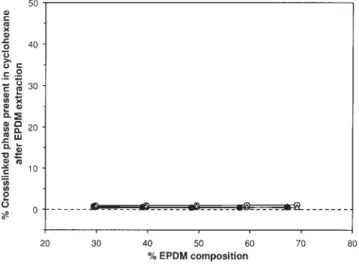
In order to verify if any crosslinked phase is being extracted with the noncrosslinked portion (which can increase the appar-ent continuity of noncrosslinked EPDM phase in the blend) we filtered the cyclohexane solution obtained after extraction using a 0.8 m membrane. Figure 8 presents the % crosslinked phase retained on the membrane as a function of the total EPDM composition in the blend. The results clearly show that no more than 1% of the dispersed phase remains on the membrane for any of the blend compositions. Since the crosslinked phase is found to exist in the form of a network and because the solution obtained upon filtration was absolutely clear, these results indicate that on crosslinking virtually none (⬍1%) of the crosslinked EPDM phase is present in the noncrosslinked EPDM phase.
Effect of crosslinking on pore diameter
Since the noncrosslinked portion of EPDM maintains full continuity during the crosslinking process it is possible to determine if crosslinking affects the phase size of this ␣-net-work. Figure 9 presents the pore diameter as a function of the total EPDM composition for the noncrosslinked and partially crosslinked EP 1/PP 1 blends. The results clearly demonstrate that the pore diameter of the ␣-network is decreasing as the blends are crosslinked. Note that for the 60 and 70% EPDM blend concentrations, the samples shrink after removing the noncrosslinked EPDM phase, rendering pore-size determination very difficult. The pore size of the partially crosslinked EP 1/PP 2 blends was also determined, however, because of their small pore sizes,3the differences
fall within the experimental error and limits of the measure-ment technique.
Conceptual mechanism of morphology development in thermoplastic vulcanizates
In this section we propose a conceptual model of morphol-ogy development during the dynamic vulcanization of cocon-tinuous morphologies. Considering that the ␣-network remains fully continuous even at 50% crosslinking, and that the pore size of that network clearly diminishes with crosslinking as shown in Figures 7 and 9, it appears that the crosslinking starts at the outer envelope of the EPDM phase and works its way toward the center. This concept is supported by the high reaction rates of this particular vulcanization protocol. During dynamic vulcanization, it is noted that the torque of the melt mixer increases almost immediately upon addition of the crosslinking agent. Therefore, it appears that as soon as the crosslinking agent comes into contact with EPDM, the crosslinking is virtually immediate and a microgel is formed. Under dynamic mixing conditions, this microgel particle de-taches from the ␣-network, because of the viscosity mismatch generated upon crosslinking, and in response to the mixing dynamics. The microgel particle while detaching from the ␣-network, however, also pulls entangled chains of non-crosslinked EPDM with it, producing a smearing effect and hence resulting in a finer and more extensive network forma-tion (Figure 5 and 6).
Figure 10 shows the mechanism of crosslinked -network formation from the template of a noncrosslinked ␣-network, based on the results from this work. Figure 10a shows the ␣-network, that is, the coarse cocontinuous network of non-crosslinked EPDM in a 50 EP/50 PP blend prior to dynamic crosslinking. As crosslinking proceeds, in Figure 10b and c, the crosslinked material, that is, -network, (shown in gray) begins to form at the outer envelope of the EPDM, and pulls material away from the main body of the EPDM during mixing, result-ing in a finer network. Ultimately in Figure 10d, all the EPDM has been crosslinked and the cocontinuous structure has tran-Figure 8. Gravimetric analysis of the quantity of
crosslinked EPDM material present in the con-tinuous noncrosslinked EPDM: , EP 1/PP 2 (50% crosslinked); , EP 1/PP 2 (100% crosslinked); , EP 1/PP 1 (50% crosslinked); , EP 1/PP 1 (100% crosslinked).
Figure 9. Effect of crosslinking on the pore diameter of the noncrosslinked EPDM phase from BET: , EP 1/PP 1 (0% crosslinked); , EP 1/PP 1 (50% crosslinked).
sited completely from a coarse ␣-network to a much finer morphology, the fully developed -network.
Conclusions
This study investigates the effect of dynamic vulcaniza-tion on the cocontinuous morphology in EPDM/PP blends. The blends are both partially and fully crosslinked during melt mixing in order to better understand the morphology evolution. The morphology of the blends is investigated by applying a technique involving focused ion beam (FIB) etching of the sample surface followed by topological anal-ysis of the sample surface using tapping mode atomic force microscopy (TMAFM). It is shown that the FIB ion etching rates of EPDM and PP are distinctly different, and, thus, leads to a significant topological contrast between the phases when subsequently analyzed by atomic-force microscopy. The technique also effectively distinguishes the zinc oxide particles in the blend. The contrast generated due to FIB ion etching is found to be so high that domains as small as 100 nm in dia. are clearly evident.
Since the FIB ion etching rates for the noncrosslinked and crosslinked EPDM phases are similar, an additional topological contrast is created by dissolving the noncrosslinked EPDM phase of the blend. In this way, the technique is found to effectively distinguish noncrosslinked and crosslinked EPDM phases in the dynamically crosslinked blends. The high-reso-lution micrographs suggest that the crosslinking of cocontinu-ous EPDM phase (␣-network), surprisingly, leads to the for-mation of a new, much finer network of crosslinked EPDM (-network). The micrographs, together with the structural integrity of the sample after gel content measurement, suggest a high-level of interconnectivity in the -network.
As dynamic crosslinking proceeds, the ␣-network maintains its cocontinuity, but decreases in pore diameter. For the vis-cosity ratios studied, the results indicate that no crosslinked phase (⬍1%) exists in the cocontinuous noncrosslinked EPDM
phase (␣-network). As the crosslinking reaction rate is very high, these results indicate that the crosslinking proceeds ini-tially at the outer envelope of the EPDM phase, and works its way toward the center.
The -network forms as a result of the viscosity mismatch created due to dynamic crosslinking between the non-crosslinked and non-crosslinked EPDM. The microgel particles, while detaching from the ␣-network, however, pull entangled chains of noncrosslinked EPDM with them, producing a smear-ing effect and, hence, resultsmear-ing in a much finer and more extensive network formation.
Acknowledgments
The authors would like to thank Mr. Mike Gallagher of Bayer, Inc. for supplying the EPDM, Mr. Denis Therrien of Basell Polyolefins, Inc. for supplying and measuring the molecular weights of the PP, and Mr. Terry Stroble of Schenectady International Inc. for supplying the phenol-form-aldehyde heat reactive curing resin. The authors would also like to thank Professor Gilles L’Espe´rance of the Center for Characterization and Mi-croscopy of Materials (CM)2and Professor Patrick Desjardins of the
Department of Engineering Physics at E´ cole Polytechnique de Montre´al for the use of the Focused ion beam (FIB) and Atomic force microscope (AFM), respectively.
Literature Cited
1. Abdou-Sabet S, Datta S. Thermoplastic vulcanizates. In: Paul DR, Bucknall CB. Polymer Blends. Vol 2: Performance. John Wiley & Sons, Inc; 2000:517-555.
2. Abdou-Sabet S, Patel RP. Morphology of elastomeric alloys. Rubber
Chem Technol. 1991;64:769-779.
3. Bhadane PA, Champagne MF, Huneault MA, Tofan F, Favis BD. Continuity development in polymer blends of very low interfacial tension. Polymer. 2006;47:2760-2771.
4. Bhadane PA, Champagne MF, Huneault MA, Tofan F, Favis BD. Erosion-dependant continuity development in high viscosity ratio blends of very low interfacial tension. J Polym Sci. Part B: Polym
Phys. 2006;44:1919-1929.
5. Galuska AA, Poulter RR, McElrath KO. Force modulation AFM of elastomer blend: morphology, fillers and crosslinking. Surf Interface
Anal.1997;25:418-429.
6. Chung O, Nadella HP. Phase morphology and cure state characteriza-tion of soft thermoplastic vulcanizates (TPVs) by using atomic force microscopy (AFM). ANTEC 2001 Proceedings of the 59thAnnual
Technical Conference, Society of Plastics Engineers. 2001;59:2926-2930.
7. Nysten B, Ghanem A, Costa J, Legras R. Influence of EP/PP viscosity ratio on the surface morphology and elasticity of injection molded PP/EP. Polym Int. 1999;48:334-338.
8. Nysten B, Legras R, Costa J. Atomic force microscopy imaging of viscoelastic properties in toughened polypropylene resins. J Appl Phys. 1995;78:5953-5958.
9. Trifonova-Van Haeringen D, Schonherr H, Vancso GJ, Vander Does L, Noordermeer JWM., Janssen PJP. Atomic force microscopy of elastomers: morphology, distribution of filler particles, and adhesion using chemically modified tips. Rubber Chem Technol. 1999;72:862-875.
10. Tanem BS, Kamfjord T, Augestad M, Lovgren TB, Lundquist M. Sample preparation and AFM analysis of heterophase polypropylene systems. Polymer. 2003;44:4283-4291.
11. Yerina N, Magonov S. Atomic force microscopy in analysis of rubber materials. Rubber Chem Technol. 2003;76:846-859.
12. Ellul MD, Tsou AH, Hu W. Crosslink densities and phase morphol-ogies in thermoplastic vulcanizates. Polymer. 2004;45:3351-3358. 13. Virgilio N, Favis BD, Pepin M, Desjardins P, L’Esperance G. High
contrast imaging of interphases in ternary polymer blends using forced ion beam preparation and atomic force microscopy. Macromolecules. 2005;38:2368-2375.
14. Marquez A, Quijano J, Gaulin M. A calibration technique to evaluate
Figure 10. Morphology development with dynamic crosslinking in a cocontinuous blend of EPDM/PP: (a) 0% crosslinked, (b) 25% crosslinked (onset of crosslinking), (c) 50% crosslinked (partial crosslinking), and (d) 100% crosslinked.
the power-law parameters of polymer melts using a torque-rheometer.
Polym Eng Sci. 1996;36:2556-2583.
15. Li J, Favis BD. Characterizing cocontinuous high density polyethyl-ene/polystyrene blends. Polymer. 2001;42:5047-5053.
16. Cox WP, Merz EH. Correlation of dynamic and steady-flow viscosi-ties. J Polym Sci. 1958;28:619-622.
17. Chung O, Coran AY. The morphology of rubber/plastic blends.
Rub-ber Chem Technol. 1997;70:781-797.
18. Chung O, Coran AY, White JL. Melt rheology of dynamically vulca-nized rubber/plastic blends. ANTEC 1997 Proceedings of the 55th
Annual Technical Conference, Society of Plastics Engineers 1997; 55:3455-3460.
19. Abdou-Sabet S, Fath MA. Thermoplastic elastomeric blends of olefin rubber and polyolefin resin. U.S. Patent 4,311,628:1982.
20. Coran AY, Patel RP. Thermoplastic elastomers based on dynamically vulcanized elastomers - thermoplastic blends. In: Holden G, Legge NR, Quirk RP, Schroeder HE. Thermoplastic elastomers. 2nded. New
York: Hanser Publishers, 1996:153-190.
Manuscript received Nov. 16, 2005, and revision received Jun. 12, 2006.