Publisher’s version / Version de l'éditeur:
Canadian Journal of Animal Science, 96, 3, pp. 354-363, 2016-04-19
READ THESE TERMS AND CONDITIONS CAREFULLY BEFORE USING THIS WEBSITE.
https://nrc-publications.canada.ca/eng/copyright
Vous avez des questions? Nous pouvons vous aider. Pour communiquer directement avec un auteur, consultez la
première page de la revue dans laquelle son article a été publié afin de trouver ses coordonnées. Si vous n’arrivez pas à les repérer, communiquez avec nous à PublicationsArchive-ArchivesPublications@nrc-cnrc.gc.ca.
Questions? Contact the NRC Publications Archive team at
PublicationsArchive-ArchivesPublications@nrc-cnrc.gc.ca. If you wish to email the authors directly, please see the first page of the publication for their contact information.
NRC Publications Archive
Archives des publications du CNRC
This publication could be one of several versions: author’s original, accepted manuscript or the publisher’s version. / La version de cette publication peut être l’une des suivantes : la version prépublication de l’auteur, la version acceptée du manuscrit ou la version de l’éditeur.
For the publisher’s version, please access the DOI link below./ Pour consulter la version de l’éditeur, utilisez le lien DOI ci-dessous.
https://doi.org/10.1139/cjas-2015-0141
Access and use of this website and the material on it are subject to the Terms and Conditions set forth at
Ruminal in vitro gas production, dry matter digestibility, methane abatement potential, and fatty acid biohydrogenation of six species of microalgae
Anele, U. Y.; Yang, W. Z.; McGinn, P. J.; Tibbetts, S. M.; McAllister, T. A.
https://publications-cnrc.canada.ca/fra/droits
L’accès à ce site Web et l’utilisation de son contenu sont assujettis aux conditions présentées dans le site LISEZ CES CONDITIONS ATTENTIVEMENT AVANT D’UTILISER CE SITE WEB.
NRC Publications Record / Notice d'Archives des publications de CNRC: https://nrc-publications.canada.ca/eng/view/object/?id=f8b0a750-4f37-4784-9ebf-0c43084640f9 https://publications-cnrc.canada.ca/fra/voir/objet/?id=f8b0a750-4f37-4784-9ebf-0c43084640f9
Ruminal in vitro gas production, dry matter digestibility, methane abatement potential and fatty acid biohydrogenation of six species of microalgae.
U.Y. Anelea, W.Z. Yanga, P.J. McGinnb, S.M. Tibbettsb, T.A. McAllistera,*
aAgriculture and Agri-Food Canada, Lethbridge, Alberta, T1J 4B1, Canada
b
National Research Council of Canada, Aquatic and Crop Resource Development, 1411 Oxford Street, Halifax, Nova Scotia B3H 3Z1, Canada
Short title: Effect of microalgae on in vitro rumen fermentation
*Corresponding author: Tim McAllister, Agriculture and Agri-Food Canada, Box 3000, Lethbridge Alberta, T1J 4B1 Canada, Phone: (403) 317-2240; fax: (403) 382-3156; E-mail: Tim.McAllister@agr.gc.ca.
ABSTRACT
This study evaluated the ruminal gas production, dry matter digestibility (DMD), methane (CH4) abatement potential and fatty acid biohydrogenation of six species of microalgae using an in vitro batch culture technique. Lipid content ranged from 115 g/kg DM in
Scenedesmus sp. AMDD to 361 g/kg DM in Tetracystis sp., while protein content varied from 132 to 350 g/kg DM in Tetracystis sp. and Nannochloropsis granulata, respectively. Scenedesmus sp. AMDD had the highest total carbohydrate (364 g/kg DM) and fibre content (277 g/kg DM); whereas its protein content was intermediate (285 g/kg DM). Asymptotic gas production was higher
(P<0.001) for fermentation cultures containing Micractinium reisseriand Chlorella vulgaris (92-94 mL/g DM) than the other species.
In vitro DMD ranged from 654 g/kg for Scenedesmus sp. AMDD to 797 g/kg for Nannochloris bacillaris. Total CH4 production varied (P<0.001) among the fermentation cultures containing microalgae, ranging from 1.76 mL/g DM for Tetracystis sp. to 4.07 mL/g DM for M. reisseri. Greater molar proportion of propionic acid in Tetracystis sp. and N. bacillaris resulted in the lowest acetic acid:propionic acid ratio for these two samples. Pre-in vitro fermentation fatty acid profiles showed higher myristic acid (C14:0), palmitoleic acid (C16:1n−7) and eicosapentaenoic acid (20:5n–3) in the marine microalga N. granulata compared to the freshwater microalgae species. A higher level of α-linolenic acid (C18:3n-3) was found in Scenedesmus sp. AMDD than all other microalgae species. Both monounsaturated (MUFA) and polyunsaturated (PUFA) fatty acid concentrations were generally reduced after in vitro fermentation with concomitant increases in saturated fatty acid (SFA) concentrations. In contrast, concentrations of stearic acid (C18:0) and eicosapentaenoic acid (20:5n–3) in N. granulata increased after in vitro fermentation. CH4 production was negatively correlated (P<0.05) with microalgae levels of total carbohydrate, oleic acid (C18:1n–9) and α-linolenic acid (C18:3n–3). Interestingly,
even though Scenedesmus sp. AMDD had the lowest lipid content, CH4 reduction with this species was comparable to Tetracystis sp. and N. bacillaris. Reductions in CH4 with Tetracystis sp. and N. bacillaris were achieved without a decline in DMD, suggesting that this reduction was achieved without inhibiting overall microbial activity.
Keywords: Biohydrogenation; In vitro batch culture; Lipids; Methane; Microalgae
Abbreviations: BSCFA, branched short-chain fatty acid; CP, crude protein; DM, dry matter; DMD, dry matter digestibility; GE, gross energy; GP, gas production; MUFA, monounsaturated fatty acids; PUFA, polyunsaturated fatty acids; SCFA, short-chain fatty acids; SFA, saturated fatty acids; TCHO, total carbohydrate
1. Introduction
Microalgae are prokaryotic or eukaryotic photosynthetic microorganisms that convert sunlight and carbon dioxide into biomass rich in lipids, proteins, and carbohydrates (Chisti, 2007). Some microalgae are considered rich sources of n–3 polyunsaturated fatty acids (PUFA) such as α-linolenic acid (C18:3n–3), eicosapentaenoic acid (C20:5n–3) and docosahexaenoic acid (C22:6n–3). A great deal of effort has been directed towards increasing the n-3 fatty acid composition of ruminant meat and milk as these PUFA have been associated with a reduced risk of coronary heart disease in humans (Gatrell et al., 2014). Like fish oil (Fievez et al., 2003), some microalgae have been shown to reduce ruminal methane (CH4) production in vitro (Fievez et al., 2007); a response that has also been confirmed to occur in ruminants in vivo (Boeckaert et al., 2007; Calsamiglia et al., 2007; Jouany and Morgavi, 2007). This response is
thought to mainly arise due to the toxicity of PUFA to methanogenic bacteria in the rumen (Dohme et al., 2001), but the diversion of some H2 away from CH4 towards biohydrogenation of PUFA may also play a minor role (Johnson and Johnson, 1995). Considering that microalgae lack lignin (Chen et al., 2013), they are able to sequester more CO2 into digestible biomass (carbohydrate, protein or lipids) than terrestrial plants (Walker, 2009).
Depending on down-stream processing methods, lipid-extracted microalgae biomass remaining after oil extraction (e.g., for renewable energy production) may contain high levels of residual oil that is suitable as an energy-dense feed as well as a source of essential fatty acids for livestock (Tibbetts et al., 2015). The six microalgae species used in this study were previously identified as promising candidates for carbon sequestration and biomass production in Northern climates (Bjornsson et al., 2012; McGinn et al., 2012; Park et al., 2012; Bhatti et al., 2014; Tibbetts et al., 2015a,b). As such, they were mass cultivated in illuminated 1000 L enclosed photobioreactors to produce sufficient biomass for evaluation. Biomass was cultivated without the use of waste streams (e.g., flue gas, wastewater) and, as such, was suitable for use as animal feed as it is unlikely to contain accumulated toxicants as a result of the production process. However, there is a need to assess the value of microalgae as a feed source, particularly from the perspective of fermentation as there appears to be good potential to use this biomass as cattle feed in Canada.
The objective of this study was to compare the in vitro ruminal gas production, dry matter digestibility, CH4 abatement potential and fatty acid biohydrogenation of whole, freeze-dried biomass produced from six microalgae species.
2.1. Microalgal biomass
Microalgae species used in this study included Scenedesmus sp. AMDD (SK-1), Chlorella vulgaris (AB02-C-U-BBM),
Nannochloris bacillaris (AB03-C-F-PLM), Tetracystis sp. (AB04-C-F-PLM02), Micractinium reisseri (AB05-C-U-BBM02) and
Nannochloropsis granulata (CCMP 535). The methods used to isolate, confirm species, cultivate and harvest these microalgae have been previously described by Tibbetts et al. (2015a,b,c). With the exception of N. granulata (which is a marine microalgae), the remaining microalgae were all freshwater species. Samples were obtained from pooled composites of duplicate biomass harvests with the exception of Scenedesmus sp. AMDD, which was a pooled composite of triplicate biomass harvests.
2.2. In vitro incubations
Approximately 0.5 g of algal biomass sample was weighed into triplicate 500 mL Ankom gas production modules (RF1; Ankom Technology, Macedon, NY, USA). Ruminal fluid was collected 2 h after feeding (0900 h) from three ruminally-fistulated beef heifers (650 kg body weight) provided (DM basis) ad libitum access to a diet consisting of whole crop barley silage (700 g/kg), dry-rolled barley grain (270 g/kg), and a vitamin and mineral supplement (30 g/kg). All animal procedures were conducted in accordance with the guidelines of the Canadian Council on Animal Care (2009). Whole ruminal contents were obtained from four locations within the rumen of the 3 animals, mixed together and squeezed through four layers of cheesecloth. The pH of ruminal fluid was measured immediately (B20PI, SympHony Benchtop Meters; VWR, Edmonton, AB, Canada) and ranged from 5.60 to 6.03 throughout the study. The strained ruminal fluid was immediately transferred to the laboratory in an insulated, air-tight container and held at 39°C in
a water bath. Rumen fluid was re-strained through four layers of cheesecloth to remove any contaminating particles that could interfere with dispensing rumen fluid into serum bottles. Each Ankom gas production module received 45 mL of McDougall’s buffer (McDougall, 1948) and 15 mL of strained ruminal fluid (3:1 ratio), after which each module was flushed with oxygen-free CO2 and sealed. Modules were incubated on an oscillating shaker at 39oC at 125 rpm for 24 h. The entire process was repeated twice, generating six analytical replicates (i.e. three per run) for each treatment. In addition, 3 blanks containing 60 mL of medium only were included to correct for gas production that was not associated with substrate digestion.
The modules were programmed to measure gas pressure every 30 min and valves were set to release at 3 psi (21 kPa). Data were sent wirelessly to a software-controlled base unit (Base Coordinator (RF2); Ankom Technology, Macedon, NY, USA) attached to a desktop computer. Pressure data were converted to moles of gas produced using the ‘Ideal’ gas law (n = p(V/RT)), and then converted to mL of gas produced using Avogadro’s law (gas in mL = n × 22.4 × 1000): where ‘n’ is gas produced in moles, ‘p’ is pressure in kPa, ‘V’ is head-space volume in the bottle in L, ‘T’ is temperature in Kelvin and ‘R’ the gas constant. Gas data obtained were fitted to the exponential model (Ørskov and McDonald, 1979) as:
y = B(1−exp −c×[t−lag]),
where ‘y’ is the cumulative volume of gas produced at time ‘t’ (h), ‘B’ is the asymptotic gas volume, ‘c’ is the rate constant and ‘lag’ is the time (h) between inoculation and commencement of gas production (GP). Initial GP rate (Absg) was calculated as the product of asymptotic cumulative gas volume and rate of fermentation (Larbi et al., 1996).
After 24 h of incubation, bottles were placed in ice to impede fermentation. Dry matter digestibility was determined by high-speed centrifugation (20,000×g) of incubation residues at 4oC for 30 min (Blümmel and Lebzien, 2001). Blanks were also centrifuged and the pellet weight was used to correct for residues from the ruminal inoculum. In vitro apparent degraded DM coefficients were calculated as:
Substrate DM incubated−[substrate pellet DM−blank pellet DM]/substrate DM incubated.
A sample of the fermentation liquid (5 mL) was obtained from each bottle and preserved in 1 mL 0.25 (w/v) HPO3 and stored at -20°C until analyzed for short chain fatty acid (SCFA) concentrations. The SCFA production at the end of 24 h of incubation was calculated by subtracting initial (blanks) SCFA from the final estimates.
2.3. Chemical analyses
Samples were analyzed according to the standard methods of AOAC (1995) for DM (976.63). Nitrogen (N) content was determined by elemental analysis (950°C furnace) using a Leco N determinator (model FP-528, Leco Corporation, St. Joseph, MI, USA) with ultra-high purity oxygen as the combustion gas and ultra-high purity helium as the carrier gas. Protein content was calculated using a nitrogen-to-protein conversion factor of N × 4.78 (Lourenço et al., 2004). Lipids were extracted by methanolic HCl
in-situ transesterification as described by McGinn et al. (2012). For fatty acid analyses, lipid extraction and methylation were as described by He et al. (2012). Fatty acid methyl esters were quantified using a gas chromatograph (Hewlett-Packard GC System 6890; Hewlett-Packard, Mississauga, ON, Canada) equipped with a flame ionization detector and SP-2560 fused silica capillary column (75
m × 0.18 mm × 0.14 μm; Supelco Inc., Oakville, ON, Canada). To obtain fatty acid profiles, hexane extracts (1 μL) were injected using a 20:1 split. The initial oven temperature (55°C) was held for 5 min, increased by 15°C/min to 155°C, held for 56 min, and increased at 10°C/min to 240°C at which point it was allowed to stand for an additional 15 min. Hydrogen was used as the carrier gas (head pressure 112.4 kPa and flow rate of 0.3 mL/min) and helium was used as the make-up gas (10 mL/min). Peaks in chromatograms were identified and quantified using pure methyl ester standards (Sigma-Aldrich Inc., Bellefonte, PA, USA). Total carbohydrate (TCHO) levels were determined by colorimetry using phenol and sulfuric acid as described by Dubois et al. (1956); following acid hydrolysis (2.5 M HCl at 80–90°C for 3 h; Sukenik et al., 1993). Final results were determined against a dextrose standard curve (0–100 μg/mL; D-glucose, solid, 99% pure, Sigma Product # G5400). Starch content was determined by the α-amylase and amyloglucosidase method (Fernandes et al., 2012) using a total starch assay kit (K-TSTA, Megazyme International Ireland Ltd., Wicklow, Ireland) according to AOAC (Official Method 996.11) and AACC (Method 76.13). Fiber contents were estimated by difference (fiber = total carbohydrate - starch). Caloric content was measured as gross energy (MJ/kg) using an oxygen bomb calorimeter (model 6200, Parr Instrument Company, Moline, IL, USA) equipped with a Parr 6510 water handling system for closed-loop operation.
In vitro SCFA concentrations were separated and quantified using a gas chromatograph (model 5890, Hewlett-Packard Lab, Palo Alto, CA, USA) equipped with a capillary column (30 m × 0.32 mm i.d., 1 µm phase thickness, Zebron ZB-FAAP, Phenomenex, Torrance, CA, USA), and flame ionization detection. Crotonic acid (trans-2-butenoic acid) was used as an internal standard and helium was used as the carrier gas (28.5 cm/s). For SCFA determination, 1 μL was injected using a split ratio of 50:1. The injector
temperature was set at 225°C and the column temperature was held at 150°C for 1 min followed by a 5°C/min increase in temperature until reaching 195°C, after which the temperature was held for 5 min. The detector temperature was held constant at 250°C.
2.4. Statistical analyses
Data from the in vitro study were subjected to analysis of variance (ANOVA) using the mixed model procedure of SAS (2002) in a completely randomized design. Differences among sample means with P < 0.05 were accepted as statistically significant. Correlation analysis was used to establish relationships between variables using PROC CORR of SAS (2002).
3. Results
3.1. Chemical composition
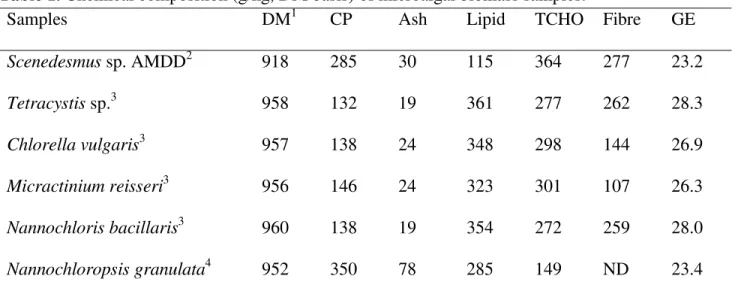
There were marked differences in the chemical composition of the microalgae samples (Table 1). Crude protein, lipid and TCHO contents of the microalgae varied from 132 to 350, 115 to 361 and 149 to 364 g/kg DM, respectively. The same was true for ash, fibre and gross energy contents at 19 to 78, 107 to 277 g/kg DM and 23 to 28 MJ/kg DM, respectively.
Gas production kinetics of the microalgae are shown in Table 2. Only the change in asymptotic gas production (b) were significant; being greater (P<0.001) in M. reisseri and C. vulgaris (92 to 94 mL/g DM) compared to the other microalgae species (60 to 88 mL/g DM).
3.2. In vitro DMD, pH and CH4 production
In vitro DMD ranged from 654 g/kg for Scenedesmus sp. AMDD to 797 g/kg for N. bacillaris (Table 3). Total CH4 production differed (P<0.001) among the microalgae, ranging from 1.76 mL/g DM for Tetracystis sp. to 4.07 mL/g DM for M. reisseri. When corrected for CH4 produced from the rumen fluid, results showed a tendency for Tetracystis sp. to reduce (P=0.079) CH4 production.
3.3. Concentrations of short- and long-chain fatty acids
No differences were noted in the butyric, valeric, or branched short-chain fatty acids concentrations among the samples (Table 4). Total SCFA varied from 48.9 mmol/L in Tetracystis sp. to 57.5 mmol/L in M. reisseri. Greater molar proportion of propionic acid in
Tetracystis sp. and N. bacillaris resulted in the lowest acetate:propionate ratio for these samples.
Fatty acid composition of the microalgae pre- and post-in vitro fermentation are shown in Tables 5 and 6, respectively. Pre-in vitro fermentation fatty acid results showed greater (P<0.001) myristic acid (C14:0), palmitoleic acid (C16:1n−7) and eicosapentaenoic acid (20:5n–3) in N. granulata (the only marine microalgae used in the study) compared with the other microalgae. Among the 5 freshwater microalgae, heptadecenoic acid (C17:1) was only detected in Scenedesmus sp. AMDD. In addition, greater (P<0.001)
α-linolenic acid (C18:3n-3) was noted in Scenedesmus sp. AMDD compared with other microalgae. As a proportion of the lipid remaining after in vitro fermentation, stearic acid (C18:0) and eicosapentaenoic acid (20:5n–3) concentrations of N. granulata increased.
3.4. Relationship between selected variables
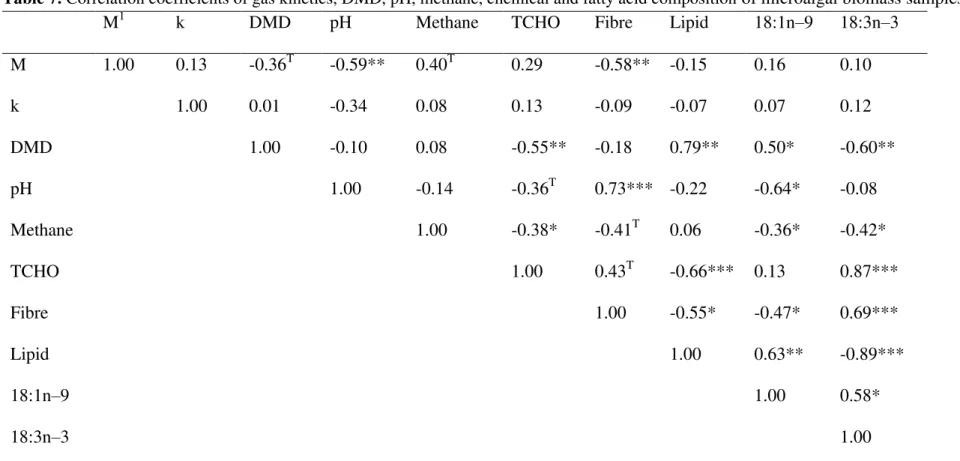
CH4 production was negatively correlated (P<0.05) with microalgae levels of total carbohydrate, oleic acid (C18:1n–9) and α-linolenic acid (C18:3n–3) (Table 7). Results showed that asymptotic gas production was negatively correlated (P<0.01) with final pH and fibre content of the microalgae. Increasing levels of TCHO and α-linolenic acid (C18:3n–3) in the microalgae resulted in decreasing DMD, whereas both lipid and oleic acid (C18:1n–9) contents of the microalgae were positively correlated (P<0.05) with DMD.
4. Discussion
4.1. Chemical composition
The greater CP content of N. granulata and Scenedesmus sp. AMDD make these species very attractive dietary supplements for livestock feed as ingredients with high CP content typically command higher market value. Despite having a high fibre content (0.36– 0.95 of TCHO), the fibre in microalgae contains no lignin and is low in hemicellulose (Tibbetts et al., 2015). This raises the likelihood that the cell wall fraction in microalgae is highly digestible and that the protein will also be readily available as it will not be
complexed with lignin (Moore and Jung, 2001). Drewery et al. (2014) reported an increase in OM digestibility with increasing supplementation of post-extraction algae residue (CP; 179 g/kg DM) in steers fed oat straw (CP; 45 g/kg DM). Similarly, the greater lipid content of Tetracystis sp., N. bacillaris and C. vulgaris is advantageous as it is well documented that supplementation of diets with certain lipids frequently reduces enteric CH4 emissions from ruminant animals (Boadi et al., 2004; Beauchemin et al., 2007).
4.2. In vitro gas production
Gas production is a reflection of differences in the chemical composition of feedstuffs and may have application in predicting their nutritional value. It is also a reflection of the formation of SCFA and the synthesis of microbial biomass (Getachew et al., 1998). Gas is produced when substrate carbohydrates and proteins are fermented to acetate, butyrate and ammonia (Getachew et al., 1998). One can only speculate that the greater lipid content in Tetracystis sp. may have been responsible for the reduced gas production compared to other microalgae. Greater asymptotic gas volume noted for M. reisseri and C. vulgaris (despite their high lipid content) is contrary to this assumption. Getachew et al. (1998) reported that greater gas production is associated with acetate and butyrate production while propionate production is associated with lower gas production. Consistent with their results, both Tetracystis sp. and N.
bacillaris which had numerically the lowest concentrations of acetate and butyrate and the highest concentration of propionate, compared to the other microalgae species; which also exhibited the lowest asymptotic gas values (60.5 and 72.2 mL/g DM).
The relatively high DMD values (654 to 797 g/kg) observed for the microalgae suggests that they could be easily digested and utilized by ruminants. Observed differences in DMD among microalgae may be due to differences in the rate of fermentation as well as due to the level of potentially digestible materials. Unlike C. vulgaris, the greater asymptotic gas volume of M. reisseri did not result in increased DMD. We expected increased asymptotic gas volume to result in greater DMD, as gas is produced when carbohydrates are fermented to acetate and butyrate (Getachew et al., 1998). In addition, there was no correlation between asymptotic gas and DMD. This is illustrated with Tetracystis sp. which had the lowest asymptotic gas estimate, but a DMD that was comparable to the other species of microalgae.
CH4 production followed a trend similar as asymptotic gas volume with greater CH4 produced by M. reisseri and C. vulgaris as compared to other species. Reduction of CH4 by Tetracystis sp. without a concomitant decrease in DMD suggests that the microbial activity involved in the digestion of this species was not inhibited. This is contrary to a previous report by Johnson and Johnson (1995) who noted that lipid supplementation can decrease CH4 production by lowering the quantity of organic matter fermented in the rumen and to a very minor extent through biohydrogenation of unsaturated fatty acids. Similarly, Dohme et al. (2001) reported that increased lipid content in feed is thought to decrease methanogenesis through inhibition of protozoa, increased production of propionic acid, and by biohydrogenation of unsaturated fatty acids. Other fatty acids (C12:0, C14:0 and C18:2) are thought to inhibit methanogens directly through binding to the cell membrane and interrupting membrane transport (Dohme et al., 2001).
Interestingly, even though Scenedesmus sp. AMDD possessed the lowest lipid content, it reduced CH4 in a manner similar to the high lipid containing species, Tetracystis sp. and N. bacillaris. The ability of Scenedesmus sp. AMDD to exhibit similar CH4
abatement potential is rather promising, but without knowing exactly how Scenedesmus sp. AMDD was able to reduce CH4, one can only speculate that this particular species may possess secondary compounds such as phenolic acids that may have elicited the response. Additionally, lower DMD noted for Scenedesmus sp. AMDD versus other microalgae could be responsible for this reduction in CH4 production.
4.4. Concentrations of short- and long-chain fatty acids
Contrary to expectations, greater DMD noted in Tetracystis sp. and N. bacillaris did not result in greater SCFA concentration for these samples. A biological explanation could be that these samples partitioned more nutrients into microbial mass versus SCFA. Although this explanation is consistent with Hungate (1966), who reported that microbial mass and SCFA are inversely related, we can only speculate because we did not measure microbial mass in the present study. Differences in SCFA concentrations are consistent with differences noted in asymptotic gas volume. Blümmel et al. (1997) reported that in addition to CO2 and CH4 produced as a result of fermentation (i.e. direct gas production), CO2 is also produced upon buffering of SCFA generated (i.e. indirect gas production) and that molar production of CO2 equals the molar SCFA production.
Biohydrogenation of unsaturated fatty acids constitute an alternative pathway for hydrogen disposal; thereby reducing the amount of hydrogen available for CH4 production (Johnson and Johnson, 1995). We noted that biohydrogenation of PUFA concentrations (0.78 of linoleic acid (18:2n–6), 0.94 of α-linolenic acid (C18:3n–3) and 1.0 of eicosapentaenoic acid (C20:5n−3) was greatest for the 3 microalgae (Scenedesmus sp. AMDD, Tetracystis sp. and N. bacillaris) that had negative net CH4 production. Contrary to the
reduction (as a result of biohydrogenation) noted in PUFA concentrations of the microalgae after in vitro fermentation, PUFA concentration of N. granulata increased from 115 to 275 g/kg total FA after 24 h of incubation. One can only speculate on what led to the increase in eicosapentaenoic acid (C20:5n−3; EPA) concentration of N. granulata which led to a concomitant increase in its PUFA concentration. There have been some discrepancies in results from previous in vitro and in vivo studies regarding the extent to which EPA is biohydrogenated in the rumen. Gulati et al. (1999) reported that biohydrogenation of EPA was minimal when fish oil was incubated with rumen contents for 24 h. However, AbuGhazaleh and Jenkins (2004) noted that up to 0.94 of EPA disappeared when this free fatty acid was incubated in cultures of mixed rumen organisms. However, Chilliard et al. (2000) reported that EPA is biohydrogenated to a lesser extent than typically observed for other 18-carbon PUFA, with saturation often being incomplete, resulting in the formation of trans isomer mixtures as intermediates. Palmitoleic acid (C16:1n−7) was completely biohydrogenated in
N. granulata samples as it was not detected after in vitro incubation, resulting in a greater concentration of palmitic acid (C16:0) in these samples.
The slight increase in α-linolenic acid (C18:3n–3) concentration of N. granulata may have also contributed to greater PUFA concentration associated with this species. Carriquiry et al. (2008) reported that biohydrogenation of unsaturated fatty acids is variable and is affected by the nature of the unsaturated fatty acid itself, the relative proportions of different unsaturates in the mixture and temperature. In a previous study (Doreau and Ferlay, 1994), in which several relatively common diets were examined, the authors found that 0.70–0.95 of linoleic acid (18:2n–6) and 0.85–1.00 of α-linolenic acid (C18:3n–3) were biohydrogenated in the rumen.
4.5. Relationship between selected variables
The negative relationship observed for CH4 production with oleic (C18:1n–9) and α-linolenic acid (C18:3n–3) can be partly attributed to biohydrogenation. Previous studies have shown that biohydrogenation of PUFA provides an alternative hydrogen sink to methanogenesis (Dohme et al., 2001; Boeckaert et al., 2007; Fievez et al., 2007). Similarly, Fievez et al. (2007) reported that in addition to the inhibitory effect of microalgae on CH4 production, a shift in the fermentation pattern results in a decrease of acetate and butyrate and an increase in propionate production. This was true for some, but not all of the microalgae evaluated in the present study. We were not surprised that CH4 was negatively correlated with TCHO as previous studies have shown that high grain based diets (high in TCHO) reduced enteric CH4 emissions (Johnson and Johnson, 1995; Grainger and Beauchemin, 2011). Carbohydrate fermentation favours propionate production over acetate which creates an alternative hydrogen sink to methanogenesis; thereby reducing enteric CH4 emissions (Murphy et al., 1982). Soluble carbohydrates may also negatively influence enteric CH4 emissions by promoting shorter residence times in the rumen (Grainger and Beauchemin, 2011).
5. Conclusion
Overall, both MUFA and PUFA concentrations were reduced after in vitro fermentation with concomitant increases in SFA concentration. Greater lipid contents of Tetracystis sp. and N. bacillaris are correlated with resulted in reduced CH4 production. In addition, reduction of CH4 production by Tetracystis sp. and N. bacillaris without a concomitant decrease in DMD suggests that microbial activity was not inhibited although total SCFA concentration was slightly reduced. Interestingly, Scenedesmus sp. AMDD
(with the least lipid) was able to reduce CH4 in a manner similar to that achieved with the higher lipid containing microalgae,
Tetracystis sp. and N. bacillaris. The ability of Scenedesmus sp. AMDD to exhibit similar CH4 abatement potential is quite promising but without knowing exactly how Scenedesmus sp. AMDD was able to reduce CH4 production, one can only speculate that a form of synergistic effect of low lipid and high CHO may be responsible. Additionally, lower DMD noted for Scenedesmus sp. AMDD versus other microalgae could also be responsible for this reduction.
Acknowledgement
Alastair Furtado and Darrell Vedres are acknowledged for their assistance with rumen sampling and laboratory analyses. The authors wish to thank Drs. Stephen O’Leary and Shabana Bhatti for kindly reviewing a draft of this manuscript. This work was supported in part by the NRCC Algal Carbon Conversion (ACC) Flagship Program.
References
AbuGhazaleh, A.A., Jenkins, T.C., 2004. Disappearance of docosahexaenoic and eicosapentaenoic acids from cultures of mixed ruminal microorganisms. J. Dairy Sci. 87, 645–651.
AOAC, 1995. Official Methods of Analysis, 16th ed. Association of Official Analytical Chemists, Arlington, VA, USA.
Beauchemin, K.A., McGinn, S.M., Petit, H.V., 2007. Methane abatement strategies for cattle: lipid supplementation of diets. Canadian J. Anim. Sci. 87(3)431–440.
Bhatti, S., MacPherson, M.J., Kozera, C., McGinn, P.J., O’Leary, S.J.B., 2014. Microalgae conversion of industrial carbon dioxide emissions to value-added biomass and biofuels: Sampling, isolation and screening of microalgal strains for industrial deployment in Canada, Fourth International Conference on Algal Biomass, Biofuels and Bioproducts, June 15-18, Santa Fe, New Mexico, USA. O2.37.
Bjornsson, W.J., MacDougall, K.M., Melanson, J.E., O’Leary, S.J.B., McGinn, P.J., 2012. Pilot-scale supercritical carbon dioxide extractions for the recovery of triacylglycerols from microalgae: a practical tool for algal biofuels research. J. Appl. Phycol. 24, 547–555.
Blümmel, M., Lebzien, P., 2001. Predicting ruminal microbial efficiencies of dairy ration by in vitro techniques. Livest. Prod. Sci. 68, 107–117.
Blümmel, M., Makkar, H.P.S., Becker, K., 1997. In vitro gas production: a technique revisited. J. Anim. Physiol. Anim. Nutr. 77, 24– 34.
Boadi, D., Benchaar, C., Chiquette, J., Massé, D., 2004. Mitigation strategies to reduce enteric methane emissions from dairy cows: Update review. Can. J. Anim. Sci. 84, 319–335.
Boeckaert, C., Mestdagh, J., Vlaeminck, B., Fievez, V., 2007. In vitro examination of DHA-edible micro algae. 1. Effect on rumen lipolysis and biohydrogenation of linoleic and linolenic acids. Anim. Feed Sci. Technol. 136, 63–79.
Calsamiglia, S., Busquet, M., Cardozo, P.W., Castillejos, L., Ferret, A., 2007. Essential oils as modifiers of rumen microbial fermentation: A review. J. Dairy Sci. 90, 2580–2595.
Canadian Council on Animal Care. 2009. Guidelines on: The care and use of farm animals in research, teaching and testing. CCAC, Ottawa, ON, Canada.
Carriquiry, M., Weber, W.J., Baumgard, L.H., Crooker, B.A., 2008. In vitro biohydrogenation of four dietary fats. Anim. Feed Sci. Technol. 141, 339–355.
Chen, C., Zhao, X., Yen, H., Ho, S., Cheng, C., Lee, D., Bai, F. and Chang, J. 2013. Microalgae-based carbohydrates for biofuel production. Biochem. Eng. J. 78, 1-10.
Chilliard, Y., Ferlay, A., Mansbridge, R.M., Doreau, M., 2000. Ruminant milk fat plasticity: nutritional control of saturated, polyunsaturated, trans and conjugated fatty acids. Ann. Zootech. 49, 181–205.
Chisti, Y., 2007. Biodiesel from microalgae. Biotechnol. Adv. 25, 294–306.
Dohme, F., Machmüller, A., Wasserfallen, A., Kreuzer, M., 2001. Ruminal methanogenesis as influenced by individual fatty acids supplemented to complete ruminant diets. Lett. Appl. Microbiol. 32, 47–51.
Doreau, M., Ferlay, A., 1994. Digestion and utilisation of fatty acids by ruminants. Anim. Feed Sci. Technol. 45, 379–396.
Drewery, M.L., Sawyer, J.E., Pinchak, W.E., Wickersham, T.A., 2014. Effect of increasing amounts of postextraction algal residue on straw utilization in steers. J. Anim. Sci. 92, 4642–4649.
Dubois, M., Gilles, K.A., Hamilton, J.K., Rebers, P.A., Smith, F., 1956. Colorimetric method for determination of sugars and related substances, Anal. Chem. 28, 350–356.
Fernandes, B., Dragone, G., Abreu, A.P., Geada, P., Teixeira, J., Vicente, A., 2012. Starch determination in Chlorella vulgaris — a comparison between acid and enzymatic methods, J. Appl. Phycol. 24, 1203–1208.
Fievez, V., Boeckaert, C., Vlaeminck, B., Mestdagh, J., Demeyer, D., 2007. In vitro examination of DHA-edible micro algae: 2. Effect on rumen methane production and apparent degradability of hay. Anim. Feed Sci. Tech. 136, 80–95.
Fievez, V., Dohme, F., Danneels, M., Raes, K., Demeyer, D., 2003. Fish oils as potent rumen methane inhibitors and associated effects on rumen fermentation in vitro and in vivo. Anim. Feed Sci. Technol. 104, 41–58.
Gatrell, S., Lum, K., Kim, J., Lei, X.G., 2014. Potential of defatted microalgae from the biofuel industry as an ingredient to replace corn and soybean meal in swine and poultry diets. J. Anim. Sci. 92, 1306–1314.
Getachew, G., Blummel, M., Makkar, H.P.S., Becker, K., 1998. In vitro gas measuring techniques for assessment of nutritional quality of feeds: a review. Anim. Feed Sci. Technol. 72, 261–281.
Grainger, C., Beauchemin, K.A., 2011. Can enteric methane emissions from ruminants be lowered without lowering their production? Anim. Feed Sci. Technol. 166-167, 308–320.
Gulati, S.K., Ashes, J.R., Scott, T.W., 1999. Hydrogenation of eicosapentaenoic and docosahexaenoic acids and their incorporation into milk fat. Anim. Feed Sci. Technol. 79, 57–64.
He, M.L., McAllister, T.A., Kastelic, J.P., Mir, P.S., Aalhus, J.L., Dugan, M.E.R., Aldai, N., McKinnon, J.J., 2012. Feeding flaxseed in grass hay and barley silage diets to beef cows increases alpha-linolenic acid and its biohydrogenation intermediates in subcutaneous fat. J. Anim. Sci. 90, 592–604.
Hungate, R.E., 1966. The Rumen and its Microbes. Academic Press, NY, USA.
Johnson, K.A., Johnson, D.E., 1995. Methane emissions from cattle. J. Anim. Sci. 73, 2483–2492.
Jouany, J. P., Morgavi, D.P., 2007. Use of ‘natural’ products as alternatives to antibiotic feed additives in ruminant production. Animal 1, 1443–1466.
Larbi, A., Smith, J.W., Adekunle, I.O., Kurdi, I.O., 1996. Studies on multipurpose fodder trees and shrubs in West Africa: variation in determinants of forage quality in Albizia and Paraserianthes species. Agrofor. Syst. 33, 1–11.
Lourenço, S.O., Barbarino, E., Lavín, P.L., Marquez, U.M.L., Aidar, E., 2004. Distribution of intracellular nitrogen in marine microalgae: calculation of new nitrogen-to-protein conversion factors. Eur. J. Phycol. 39, 17–32.
McDougall, E.I., 1948. Studies on ruminant saliva. I: The composition and output of sheep’s saliva. Biochem. J. 43, 99–109.
McGinn, P.J., Dickinson, K.E., Park, K.C., Whitney, C.G., MacQuarrie, S.P., Black, F.J., Frigon, J., Guio, S.R., O'Leary, S.J.B., 2012. Assessment of the bioenergy and bioremediation potentials of themicroalga Scenedesmus sp. AMDD cultivated in municipal wastewater effluent in batch and continuous mode. Algal Res. 1, 155–165.
Moore, K.J., Jung, H.G., 2001. Lignin and fiber digestion. J. Range. Manage. 54, 420–430.
Mostafa, S.S.M., 2012. Microalgal biotechnology: Prospects and applications. In: Dhal, N.K., Sahu, S.C. (Eds.) Plant science.
www.intechopen.com/books/plant-science/microalgal-biotechnology-prospects-and-applications (Accessed 09 June 2015).
Murphy, M.R., Baldwin, R.L., Koong, L.J., 1982. Estimation of stoichiometric parameters for rumen fermentation of roughage and concentrate diets. J. Anim. Sci. 55, 411–421.
SAS®, 2002. User's guide: Statistics, Version 9.1. SAS Institute, Inc. Cary, NC, USA.
Sukenik, A., Zmora, O., Carmeli, Y., 1993. Biochemical quality of marine unicellular algae with special emphasis on lipid composition. II. Nannochloropsis sp. Aquaculture 117, 313–326.
Park, K.C., Whitney, C., McNichol, J.C., Dickinson, K.E., MacQuarrie, S., Skrupski, B.P., Zou, J., Wilson, K.E., O’Leary, S.J.B., McGinn, P.J., 2012. Mixotrophic and photoautotrophic cultivation of 14 microalgae isolates from Saskatchewan, Canada: potential applications for wastewater remediation for biofuel production. J. Appl. Phycol. 24, 339–348.
Tibbetts, S.M., Whitney, C.G., MacPherson, M.J., Bhatti, S., Banskota, A.H., Stefanova, R., McGinn, P.J., 2015a. Biochemical characterization of microalgal biomass from freshwater species isolated in Alberta, Canada for animal feed applications. Algal Res. doi:10.1016/j.algal.2014.11.011
Tibbetts, S.M., Bjornsson, W.J., McGinn, P.J., 2015b. Biochemical composition and amino acid profiles of Nannochloropsis
granulata algal biomass before and after supercritical fluid CO2 extraction at two processing temperatures, Anim. Feed Sci. Technol. 204, 62–71.
Tibbetts, S.M., Melanson, R.J., Park, K.C., Banskota, A.H., Stefanova, R., McGinn, P.J., 2015c. Nutritional evaluation of whole and lipid-extracted biomass of the microalga Scenedesmus sp. AMDD isolated in Saskatchewan, Canada for animal feeds: Proximate, amino acid, fatty acid, carotenoid and elemental composition. Current Biotechnology (Accepted).
Wąsowska, I., Maia, M.R.G., Niedzwiedzka, K.M., Czauderna, M., Ramalho Ribeiro, J.M.C., Devillard, E., Shingfield, K.J., Wallace, R.J., 2006. Influence of fish oil on ruminal biohydrogenation of C18 unsaturated fatty acids. Brit. J. Nutr. 95, 1199–1211.
Table 1. Chemical composition (g/kg, DM basis) of microalgal biomass samples.
Samples DM1 CP Ash Lipid TCHO Fibre GE
Scenedesmus sp. AMDD2 918 285 30 115 364 277 23.2 Tetracystis sp.3 958 132 19 361 277 262 28.3 Chlorella vulgaris3 957 138 24 348 298 144 26.9 Micractinium reisseri3 956 146 24 323 301 107 26.3 Nannochloris bacillaris3 960 138 19 354 272 259 28.0 Nannochloropsis granulata4 952 350 78 285 149 ND 23.4 1
DM, dry matter; CP, crude protein; TCHO, total carbohydrate; Fibre was estimated as TCHO – starch; GE, gross energy. 2
Freshwater strain of Scenedesmus sp. AMDD isolated from a soil sample in Saskatoon, Saskatchewan. 3
Samples are all similar freshwater species isolated from Sylvan Lake, Athabasca River, Pigeon Lake and Gregoire Lake in Alberta. 4
Whole biomass of marine species of N. granulata (originally purchased from the Provasoli-Guillard National Center for Marine Algae and Microbiota, Maine, USA).
Table 2. In vitro gas production kinetics of microalgal biomass samples.
Samples M1 (mL/g DM) k (mL/h) Lag (h) Absg (mL/g DM)
Scenedesmus sp. AMDD2 87.9b 4.58 -5.04 4.03 Tetracystis sp.3 60.5d 4.66 -2.62 2.82 Chlorella vulgaris3 92.1a 6.13 -2.99 5.65 Micractinium reisseri3 93.6a 4.19 -5.41 3.92 Nannochloris bacillaris3 72.2c 3.02 -2.97 2.18 Nannochloropsis granulata4 72.3c 4.05 -5.56 2.93 SEM 2.97 1.152 0.966 0.317 P value <0.001 0.778 0.362 0.514
Means within a column with different superscripts differ (P<0.05). 1
M, asymptotic gas volume; k, specific rate of gas production; Lag, lag time; Absg, absolute initial gas production during the first hour (mL/g DM).
2
Freshwater strain of Scenedesmus sp. AMDD isolated from a soil sample in Saskatoon, Saskatchewan. 3
Samples are all similar freshwater species isolated from Sylvan Lake, Athabasca River, Pigeon Lake and Gregoire Lake in Alberta. 4
Whole biomass of marine species of N. granulata (originally purchased from the Provasoli-Guillard National Center for Marine Algae and Microbiota, Maine, USA).
Table 3. Dry matter digestibility (g/kg), pH, total and net CH4 production (mL/g DM) of microalgal biomass samples during in vitro incubation.
Samples DMD1 pH Total CH4 Net CH42
Scenedesmus sp. AMDD3 654d 6.25b 2.96b -0.45 Tetracystis sp.4 769a 6.25b 1.76c -1.30 Chlorella vulgaris4 763ab 6.21c 3.99a 0.13 Micractinium reisseri4 690cd 6.18c 4.07a 0.35 Nannochloris bacillaris4 797a 6.26b 2.53bc -0.70 Nannochloropsis granulata5 719bc 6.31a 3.24b 0.43 SEM 12.3 0.011 0.211 0.439 P value <0.001 <0.001 <0.001 0.079
Means within column with different superscripts differ (P<0.05). 1
DMD, dry matter digestibility. 2
Net CH4 was estimated as: CH4 produced in samples – CH4 produced in blanks. 3
Freshwater strain of Scenedesmus sp. AMDD isolated from a soil sample in Saskatoon, Saskatchewan. 4
Samples are all similar freshwater species isolated from Sylvan Lake, Athabasca River, Pigeon Lake and Gregoire Lake in Alberta. 5
Whole biomass of marine species of N. granulata (originally purchased from the Provasoli-Guillard National Center for Marine Algae and Microbiota, Maine, USA).
Table 4. Concentration and molar proportion of individual short-chain fatty acids (SCFA, mmol/L) of the microalgal biomass samples after 24 h of in vitro incubation.
Samples C21 C3 C4 C5 BSCFA C2:C3 TSCFA
Scenedesmus sp. AMDD2 0.488b 0.170bc 0.183 0.058 0.089 2.91bc 56.1ab
Tetracystis sp.3 0.468b 0.197ab 0.175 0.063 0.085 2.56c 48.9c
Chlorella vulgaris3 0.510a 0.132d 0.206 0.056 0.087 3.90a 53.5abc
Micractinium reisseri3 0.499ab 0.149cd 0.207 0.055 0.081 3.35ab 57.5a
Nannochloris bacillaris3 0.485b 0.203a 0.164 0.062 0.078 2.59c 52.5bc
Nannochloropsis granulata4 0.509ab 0.139d 0.195 0.063 0.085 3.66a 53.8ab
SEM 0.0083 0.0119 0.0110 0.0028 0.0034 0.193 1.53
P value 0.013 <0.001 0.069 0.243 0.135 <0.001 0.003
Means within a column with different superscripts differ (P<0.05). 1
C2, acetic; C3, propionic; C4, butyric; C5, valeric; BSCFA, branched short-chain fatty acids; C2:C3, acetic to propionic ratio; TSCFA, total short-chain fatty acids.
2
Freshwater strain of Scenedesmus sp. AMDD isolated from a soil sample in Saskatoon, Saskatchewan. 3
Samples are all similar freshwater species isolated from Sylvan Lake, Athabasca River, Pigeon Lake and Gregoire Lake in Alberta. 4
Whole biomass of marine species of N. granulata (originally purchased from the Provasoli-Guillard National Center for Marine Algae and Microbiota, Maine, USA).
Table 5. Fatty acid composition (g/kg of total fatty acid) of microalgae before in vitro fermentation. Fatty acid Scenedesmus sp.
AMDD1 Tetracystis sp.2 Chlorella vulgaris2 Micractinium reisseri2 Nannochloris bacillaris2 N. granulata3 14:0 3.89b 2.58c 2.68c 3.09c 2.42c 62.8a 16:0 111e 208b 136d 183c 204b 264a 18:0 15.7c 46.9b 13.4d 4.93f 48.9a 8.50e 16:1n–7 4.71c 5.56c 2.09d 8.79b 4.91c 298a 17:1 36.1a nd nd nd nd 2.52b 18:1n–9 326c 449ab 493a 404b 445ab 200d 18:1n–11 58.6bc 62.3ab 53.5d 54.9cd 63.2a 4.78e 18:2n–6 123c 122c 209b 267a 126c 23.8d 18:3n–3 222a 86.7b 72.7bc 62.4c 91.9b 0.90d 20:5n–3 Nd 0.46b 0.73b 0.93b 0.95b 84.0a ∑SFA 184c 265b 157d 194c 262b 353a ∑MUFA 427e 520bc 554a 470d 516c 532b ∑PUFA 389a 215d 289c 336b 222d 115e Lipid (g/kg DM) 115d 361a 348a 323b 354a 285c
Means within a row with different superscripts differ (P<0.05).
1
Freshwater strain of Scenedesmus sp. AMDD isolated from a soil sample in Saskatoon, Saskatchewan.
2
Samples are all similar freshwater species isolated from Sylvan Lake, Athabasca River, Pigeon Lake and Gregoire Lake in Alberta.
3
Whole biomass of marine species of Nannochloropsis granulata (originally purchased from the Provasoli-Guillard National Center for Marine Algae and Microbiota, Maine, USA).
Table 6. Fatty acid composition (g/kg of total fatty acid) of microalgae after in vitro fermentation. Fatty acid Scenedesmus sp.
AMDD1 Tetracystis sp.2 Chlorella vulgaris2 Micractinium reisseri2 Nannochloris bacillaris2 N. granulata3 14:0 4.39c 4.60bc 7.23b 6.04bc 4.36c 83.9a 16:0 152d 266b 179cd 217c 280b 357a 18:0 45.7b 78.7a 91.5a 46.7b 94.2a 40.1b 16:1n–7 8.82a 5.38ab 3.71b 6.84ab 6.09ab nd 17:1 20.5a nd nd nd nd 2.07b 18:1n–9 352a 398a 401a 408a 374a 242b 18:1n–11 21.9b 24.8ab 30.9a 15.4c 23.8b 5.69d 18:2n–6 19.6b 29.2b 141a 144a 34.3b 27.6b 18:3n–3 7.69c 5.39d 43.3a 32.1b 6.99cd 1.61e 20:5n–3 nd nd nd nd nd 144 ∑SFA 484a 495a 315b 321b 517a 533a ∑MUFA 475a 462a 479a 482a 433a 275b ∑PUFA 39.9b 43.1b 206a 197a 50.1b 192a
Means within a row with different superscripts differ (P<0.05).
1
Freshwater strain of Scenedesmus sp. AMDD isolated from a soil sample in Saskatoon, Saskatchewan.
2
Samples are all similar freshwater species isolated from Sylvan Lake, Athabasca River, Pigeon Lake and Gregoire Lake in Alberta.
3
Whole biomass of marine species of Nannochloropsis granulata (originally purchased from the Provasoli-Guillard National Center for Marine Algae and Microbiota, Maine, USA).
Table 7. Correlation coefficients of gas kinetics, DMD, pH, methane, chemical and fatty acid composition of microalgal biomass samples.
M1 k DMD pH Methane TCHO Fibre Lipid 18:1n–9 18:3n–3
M 1.00 0.13 -0.36T -0.59** 0.40T 0.29 -0.58** -0.15 0.16 0.10 k 1.00 0.01 -0.34 0.08 0.13 -0.09 -0.07 0.07 0.12 DMD 1.00 -0.10 0.08 -0.55** -0.18 0.79** 0.50* -0.60** pH 1.00 -0.14 -0.36T 0.73*** -0.22 -0.64* -0.08 Methane 1.00 -0.38* -0.41T 0.06 -0.36* -0.42* TCHO 1.00 0.43T -0.66*** 0.13 0.87*** Fibre 1.00 -0.55* -0.47* 0.69*** Lipid 1.00 0.63** -0.89*** 18:1n–9 1.00 0.58* 18:3n–3 1.00 1
M, asymptotic gas volume; k, specific rate of gas production; Lag, lag time; Absg, absolute initial gas production during the first hour (mL/g DM); DMD, dry matter disappearance. T, 0.05 <P<0.1; *, P<0.05; **, P<0.01; ***, P<0.001.