arXiv:1606.02699v3 [hep-ex] 18 Oct 2017
EUROPEAN ORGANISATION FOR NUCLEAR RESEARCH (CERN)
Phys. Lett. B761 (2016) 136
DOI:10.1016/j.physletb.2016.08.019
CERN-PH-2016-088 19th October 2017
Measurement of the t ¯t production cross-section
using eµ events with b-tagged jets in pp collisions at
√ s = 13 TeV with the ATLAS detector
The ATLAS Collaboration
This paper describes a measurement of the inclusive top quark pair production cross-section (σt¯t) with a data sample of 3.2 fb−1 of proton–proton collisions at a centre-of-mass energy of √s = 13 TeV, collected in 2015 by the ATLAS detector at the LHC. This measurement uses events with an opposite-charge electron–muon pair in the final state. Jets containing
b-quarks are tagged using an algorithm based on track impact parameters and reconstructed
secondary vertices. The numbers of events with exactly one and exactly two b-tagged jets are counted and used to determine simultaneously σt¯tand the efficiency to reconstruct and b-tag a jet from a top quark decay, thereby minimising the associated systematic uncertainties. The cross-section is measured to be:
σt¯t=818 ± 8 (stat) ± 27 (syst) ± 19 (lumi) ± 12 (beam) pb,
where the four uncertainties arise from data statistics, experimental and theoretical systematic effects, the integrated luminosity and the LHC beam energy, giving a total relative uncertainty of 4.4%. The result is consistent with theoretical QCD calculations at next-to-next-to-leading order. A fiducial measurement corresponding to the experimental acceptance of the leptons is also presented.
c
2017 CERN for the benefit of the ATLAS Collaboration.
1 Introduction
The top quark is the heaviest known fundamental particle, with a mass mtwhich is much larger than any of the other quarks, and close to the scale of electroweak symmetry breaking. The study of its production and decay properties forms a core part of the LHC physics programme. At the LHC, top quarks are primarily produced in quark–antiquark pairs (t¯t), and the precise prediction of the corresponding inclusive cross-section is sensitive to the gluon parton distribution function (PDF) and the top quark mass, and presents a substantial challenge for QCD calculational techniques. Physics beyond the Standard Model may also lead to an enhancement of the t¯t production rate.
Calculations of the t¯t production cross-section at hadron colliders are available at full next-to-next-to-leading-order (NNLO) accuracy in the strong coupling constant αS, including the resummation of next-to-next-to-leading logarithmic (NNLL) soft gluon terms [1–5]. In this paper a reference value of 832+40
−46pb at a centre-of-mass energy of √s = 13 TeV assuming mt =172.5 GeV is used, corresponding to a relative precision of+4.8
−5.5%. This value was calculated using the top++ 2.0 program [6]. The combined PDF and αS uncertainties of ±35 pb were calculated using the PDF4LHC prescription [7] with the MSTW2008 68% CL NNLO [8,9], CT10 NNLO [10,11] and NNPDF2.3 5f FFN [12] PDF sets, and added in quadrature to the factorisation and renormalisation scale uncertainty of+20
−29pb. The cross-section at √s = 13 TeV is predicted to be 3.3 times larger than the cross-section at √s = 8 TeV.
Measurements of σt¯thave been made at √s = 7 and 8 TeV by both ATLAS [13–15] and CMS [16– 18]. The most precise ATLAS measurements of σt¯tat these collision energies were made using events with an opposite-charge isolated electron and muon pair and additional b-tagged jets [13]. This paper documents a measurement of σt¯t at √s = 13 TeV using the same final state and analysis technique. Wherever possible, the analysis builds on the studies and procedures used in the earlier publication [13]. A fiducial measurement determining the cross-section in the region corresponding to the experimental lepton acceptance is also presented.
The data and Monte Carlo simulation samples are described in Section2, followed by the object and event selection in Section3and the method for determining the t¯t cross-section in Section4. The evaluation of backgrounds is discussed in Section5and the systematic uncertainties in Section6. Finally, the results and conclusions are given in Section7.
2 Data and simulation samples
The analysis is performed using the full 2015 proton–proton (pp) collision data sample at √s = 13 TeV with 25 ns bunch spacing recorded by the ATLAS detector [19,20]. The data correspond to an integrated luminosity of 3.2 fb−1after requiring stable LHC beams and that all detector subsystems were operational. Events are required to pass either a single-electron or single-muon trigger, with thresholds set to be almost fully efficient for leptons with transverse momentum pT >25 GeV passing offline selections. Each event includes the signals from on average about 14 additional inelastic pp collisions in the same bunch crossing (known as pile-up).
Monte Carlo simulated event samples are used to optimise the analysis, to compare to the data, and to evaluate signal and background efficiencies and uncertainties. The samples used in the analysis are summarised in Table1. The main t¯t signal and background samples were processed through the ATLAS detector simulation [21] based on GEANT4 [22]. Some of the systematic uncertainties were studied using
alternative t¯t samples processed through a faster simulation making use of parameterised showers in the calorimeters [23]. Additional simulated pp collisions generated with Pythia8.186 [24] were overlaid to model the effects from additional collisions in the same and nearby bunch crossings. All simulated events were processed using the same reconstruction algorithms and analysis chain as the data, and small corrections were applied to lepton trigger and reconstruction efficiencies and resolutions to improve the agreement with the response observed in data.
The baseline t¯t simulation sample was produced at next-to-leading order (NLO) in QCD using the matrix-element generator Powheg-Box v2 [25–27] with CT10 PDFs [10], interfaced to Pythia6 [28] with the Perugia 2012 set of tuned parameters (tune) [29] for parton shower, fragmentation and underlying event modelling. The hdampparameter, which gives a cutoff scale for the first gluon emission, was set to mt, a value which was chosen to give good modelling of the t¯t system pTat √s = 7 TeV [30]. The EvtGen [31] package was used to better simulate the decay of heavy-flavour hadrons.
Alternative t¯t simulation samples were generated using Powheg interfaced to Herwig++ [32], and Mad-graph5_aMC@NLO [33] interfaced to Herwig++. The effects of initial- and final-state radiation were explored using two alternative Powheg + Pythia6 samples: one with hdamp set to 2mt, the factorisation and renormalisation scale varied by a factor of 0.5 and using the Perugia 2012 radHi tune, giving more parton shower radiation; and a second one with the Perugia 2012 radLo tune, hdamp = mt and the factor-isation and renormalfactor-isation scale varied by a factor of 2, giving less parton shower radiation. The samples were simulated following the recommendations documented in Ref. [34]. The top quark mass was set to 172.5 GeV in all these simulation samples and the t → Wb branching fraction to 100%.
Backgrounds in this measurement are classified into two types: those with two real prompt leptons from
W or Z decays (including those produced via leptonic decays of τ-leptons), and those where at least
one of the reconstructed lepton candidates is ‘fake’, i.e. a non-prompt lepton produced from the decay of a bottom or charm hadron, an electron arising from a photon conversion, a jet misidentified as an electron, or a muon produced from an in-flight decay of a pion or kaon. Backgrounds containing two real prompt leptons include single-top production in association with a W boson (Wt), Z+jets production with
Z→ ττ → eµ, and diboson production (WW, WZ and ZZ) where both bosons decay leptonically.
The dominant Wt single-top background was modelled using Powheg-Box v1 + Pythia6 with the CT10 PDFs and the Perugia 2012 tune, using the ‘diagram removal’ generation scheme [35]. The Z+jets back-ground was modelled using Sherpa 2.1.1 [36]: matrix elements (ME) were calculated for up to two partons at NLO and four partons at leading order using the Comix [37] and OpenLoops [38] matrix-element gen-erators and merged with the Sherpa parton shower (PS) using the ME + PS@NLO [39] prescription; the CT10 PDF set was used in conjunction with dedicated parton shower tuning in Sherpa. Diboson produc-tion with addiproduc-tional jets was also simulated using Sherpa 2.1.1 and CT10 PDFs as described above; the four-lepton final state, the three-lepton final state with two different-flavour leptons, and the two-lepton final state were simulated to cover ZZ, ZW and WW production, and include off-shell Z/γ∗ contribu-tions. Same-charge WW production from QCD and electroweak processes was included. Alternative
Wtand diboson simulation samples were generated using Powheg + Herwig++ and Powheg + Pythia8,
respectively, to estimate the background modelling uncertainties.
The majority of the background with at least one fake lepton in the selected sample arises from t¯t pro-duction where only one of the W bosons from the top quarks decays leptonically, which was simulated as discussed earlier. Other processes with one real lepton which can contribute to this background include the t-channel single-top production, modelled using Powheg-Box v1 + Pythia6, and W+jets with the W
Process Generator + Parton Shower Calculation t¯t Powheg-Box v2 + Pythia6 NLO Powheg-Box v2 + Herwig++ Madgraph5_aMC@NLO + Herwig++
Wtsingle top Powheg-Box v1 + Herwig++Powheg-Box v1 + Pythia6 NLO
Z+jets Sherpa 2.1.1 NLO (up to two partons)
Diboson Powheg + Pythia8Sherpa 2.1.1 NLO (up to two partons)NLO
t-channel single top Powheg-Box v1 + Pythia6 NLO
W+jets Powheg-Box v2 + Pythia8 NLO
t¯t + W/Z MadGraph + Pythia8 LO
Table 1: Summary of Monte Carlo samples used to model the signal and background processes. The ’Calculation’ column corresponds to the order of the matrix element calculation in the Monte Carlo generator.
decaying to eν, µν or τν where the τ-lepton subsequently decays leptonically. This background was mod-elled using Powheg-Box v2 + Pythia8 with the CT10 PDFs. The small expected contribution from t¯t in association with a W or Z boson to the same-charge eµ sample used for background estimation was mod-elled using MadGraph + Pythia8 [40]. Other backgrounds, including processes with two misidentified leptons, are negligible.
3 Object and event selection
This measurement makes use of reconstructed electrons, muons and b-tagged jets. The object and event selections largely follow those used in the earlier publication; in particular the same kinematic cuts are used for electrons and jets, and very similar ones are used for muons.
Electron candidatesare reconstructed from an isolated electromagnetic calorimeter energy deposit match-ed to a track in the inner detector and passing a mmatch-edium likelihood-basmatch-ed requirement [41,42], within the fiducial region of transverse energy ET >25 GeV and pseudorapidity1 |η| < 2.47. Candidates within the transition region between the barrel and endcap electromagnetic calorimeters, 1.37 < |η| < 1.52, are removed. The electron candidates must satisfy requirements on the transverse impact parameter signific-ance calculated with respect to the beamline of |d0|/σd0 < 5 and on the longitudinal impact parameter calculated with respect to the primary vertex of |∆z0 sin θ| < 0.5 mm. The primary vertex is defined as the one with the highest sum of p2
T of tracks associated to it. Electrons are required to be isolated using requirements on the calorimeter energy in a cone of size ∆R < 0.2 around the electron (excluding the deposit from the electron itself) divided by the electron pT, and on the sum of track pT in a variable-size cone around the electron direction (again excluding the electron track itself). The track isolation cone size is given by the smaller of ∆R = 10 GeV/pT(e) and ∆R = 0.2, i.e. a cone which increases in size at low
pTup to a maximum of 0.2. Selection criteria, dependent on pT and η, are applied to produce a nominal 1ATLAS uses a right-handed coordinate system with its origin at the nominal interaction point (IP) in the centre of the detector and the z-axis along the beam pipe. The x-axis points from the IP to the centre of the LHC ring, and the y-axis points upwards. Cylindrical coordinates (r, φ) are used in the transverse plane, φ being the azimuthal angle around the z-axis. The pseudorapidity is defined in terms of the polar angle θ as η = − ln tan(θ/2). Angular distance is measured in units of ∆R≡p(∆η)2+(∆φ)2.
efficiency of 95% for electrons from Z → ee decays with pT of 25 GeV which rises to 99% at 60 GeV. The efficiencies in t¯t events are smaller, due to the increased jet activity. To prevent double-counting of electron energy deposits as jets, the closest jet with ∆R < 0.2 of a reconstructed electron is removed. Finally, if the nearest jet surviving the above selection is within ∆R = 0.4 of the electron, the electron is discarded, to ensure it is sufficiently separated from nearby jet activity.
Muon candidatesare reconstructed by combining matching tracks reconstructed in both the inner de-tector and muon spectrometer, and are required to satisfy pT > 25 GeV and |η| < 2.4 [43]. Muons are also required to be isolated, using requirements similar to those for electrons, with the selection criteria tuned to give similar efficiencies for Z → µµ events. The muon candidates must satisfy the requirements on the transverse impact parameter significance and on the longitudinal impact parameter of |d0|/σd0 <3 and |∆z0sin θ| < 0.5 mm, respectively. To reduce the background from muons from heavy-flavour decays inside jets, muons are removed if they are separated from the nearest jet by ∆R < 0.4. However, if this jet has fewer than three associated tracks, the muon is kept and the jet is removed instead; this avoids an inefficiency for high-energy muons undergoing significant energy loss in the calorimeter.
Jetsare reconstructed using the anti-kt algorithm [44, 45] with radius parameter R = 0.4, starting from topological clusters of deposited energy in the calorimeters. Jets are calibrated using an energy- and η-dependent simulation-based calibration scheme with corrections derived from data. No corrections for semileptonic b-hadron decays are applied. Jets are accepted within the fiducial region pT > 25 GeV and |η| < 2.5. To reduce the contribution from jets associated with pile-up, jets with pT < 50 GeV and |η| < 2.4 are required to pass a pile-up rejection veto [46].
Jets are b-tagged as likely to contain b-hadrons using the MV2c20 algorithm [47], a multivariate discrim-inant making use of track impact parameters and reconstructed secondary vertices and tuned with the new detector configuration, i.e. including the Insertable B-Layer detector (IBL) [20]. Jets are defined as be-ing b-tagged if the MV2c20 weight is larger than a threshold value correspondbe-ing to approximately 70%
b-tagging efficiency for b-jets in t¯t events, although the exact efficiency varies with pT. In simulation, the tagging algorithm gives a rejection factor of about 440 against light-quark and gluon jets, and about 8 against jets originating from charm quarks. The improvements of a factor of three in the light-quark rejection and of 60% in the charm-quark rejection compared to the b-tagging algorithm used in Ref. [13] originate from the gain in track impact parameter resolution from the IBL, and improvements in the track reconstruction and b-tagging algorithms [47].
Events are rejected if the selected electron and muon are separated by ∆φ < 0.15 rad and ∆θ < 0.15 rad, where ∆φ and ∆θ are the differences in polar and azimuthal angles between the two leptons. This require-ment rejects events where a muon undergoes significant energy loss in the electromagnetic calorimeter, thus leading to a reconstructed electron candidate. Events passing the above requirements, and having exactly one selected electron and one selected muon of opposite electric charge sign (OS), define the eµ preselected sample. The corresponding same-sign (SS) sample is used in the estimation of background from events with misidentified leptons. Events are then further classified into those with exactly one or exactly two b-tagged jets.
4 Extraction of the t ¯t cross-section
The t¯t cross-section is measured in the dileptonic eµ channel, where one top quark decays as t → Wb →
eνband the other as t → Wb → µνb.2 The final states from leptonic τ decays are also included. As in
Ref. [13], σt¯tis determined by counting the numbers of opposite-sign eµ events with exactly one (N1) and exactly two (N2) b-tagged jets, ignoring any jets that are not b-tagged which may be present, due to
e.g.light-quark or gluon jets from QCD radiation or b-jets from top quark decays which are not b-tagged.
The two event counts can be expressed as:
N1 = Lσt¯tǫeµ2ǫb(1 − Cbǫb) + N1bkg
N2 = Lσt¯tǫeµCbǫb2+ N2bkg (1) where L is the integrated luminosity of the sample and ǫeµthe efficiency for a t¯tevent to pass the opposite-sign eµ preselection. The combined probability for a jet from the quark q in the t → Wq decay to fall within the acceptance of the detector, be reconstructed as a jet with transverse momentum above the selection threshold, and be tagged as a b-jet, is denoted by ǫb. If the decays of the two top quarks and the subsequent reconstruction of the two b-tagged jets are completely independent, the probability to tag both b-jets ǫbb is given by ǫbb = ǫb2. In practice, small correlations are present for kinematic and instrumental reasons, and these are taken into account via the tagging correlation coefficient Cb, defined as Cb = ǫbb/ǫb2or equivalently Cb = 4Neµt¯tN2t¯t/(N1t¯t+2N2t¯t)2, where Neµt¯t is the number of preselected eµ
t¯tevents and N1t¯tand N2t¯tare the numbers of events with one and two b-tagged jets. Background from
sources other than t¯t → eµννb¯b also contributes to the event counts N1 and N2, and is given by the background terms N1bkg and N2bkg. The preselection efficiency ǫeµ and tagging correlation Cb are taken from t¯t event simulation and are about 0.83% and 1.002, respectively, and the background contributions
N1bkg and N2bkg are estimated using a combination of simulation and data-based methods as described in
Section5, allowing the two equations (1) to be solved yielding σt¯tand ǫb by minimising a likelihood function.
In the method to measure the t¯t cross-section outlined above, some of the largest systematic uncertain-ties come from the use of simulation to estimate the preselection efficiency ǫeµ. This efficiency can be factorised into the product of two terms: ǫeµ = AeµGeµ. The acceptance Aeµrepresents the fraction of t¯t events that have a true eµ pair within the detector acceptance (pT >25 GeV and |η| < 2.5) and it is about 1.4% (1.2% excluding τ decays). The term Geµrepresents the ratio of reconstructed t¯t events to t¯t events with a true eµ pair within the fiducial region, where the numerator includes the approximately 2% of reconstructed t¯t events where one or both leptons have true pT < 25 GeV. The fiducial cross-section σfidt¯t is defined as σfid
t¯t = Aeµσt¯t, avoiding the systematic uncertainties associated with the extrapolation from the measured lepton phase space to the full phase space, and measured following the same technique as in Ref. [13]. The contribution of t¯t events produced in the fiducial region with at least one lepton originating via W → τ → l decay is estimated from simulation to be 12.2 ± 0.1%.
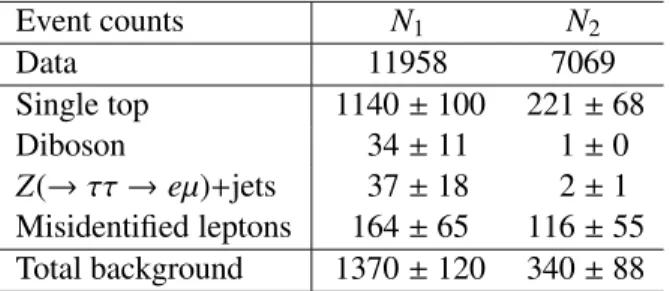
A total of 30879 data events passed the eµ opposite-sign preselection. Table2shows the number of events with one and two b-tagged jets, together with the estimates of non-t¯t background and their systematic uncertainties discussed below. The ratio of b-tagged events to preselected events (before b-tagging) is higher for 13 TeV than at 7 and 8 TeV due to the larger increase of the t¯t cross-section with √s compared with the Z+jets and diboson background cross-sections. In simulation, the sample with one b-tagged jet is expected to be about 89% pure in t¯t events, with the dominant background originating from Wt single-top
Event counts N1 N2 Data 11958 7069 Single top 1140 ± 100 221 ± 68 Diboson 34 ± 11 1 ± 0 Z(→ ττ → eµ)+jets 37 ± 18 2 ± 1 Misidentified leptons 164 ± 65 116 ± 55 Total background 1370 ± 120 340 ± 88
Table 2: Observed numbers of opposite-sign eµ events with one and two b-tagged jets (N1and N2), together with the estimates of non-t¯t backgrounds and associated systematic uncertainties. Uncertainties quoted as 0 are < 0.5.
production, and smaller contributions from events with misidentified leptons, Z+jets and dibosons. The sample with two b-tagged jets is expected to be about 96% pure in t¯t events, with Wt production again being the dominant background.
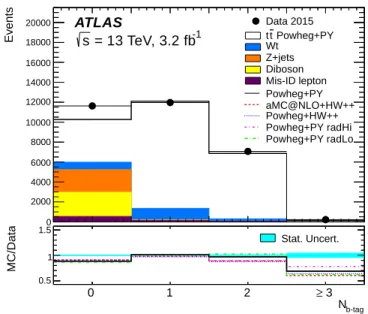
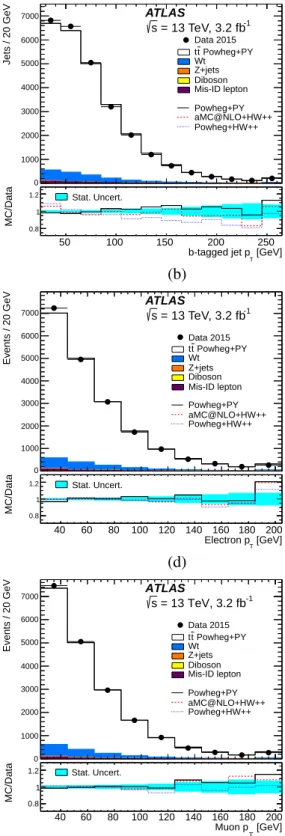
The distribution of the number of b-tagged jets in opposite-sign eµ events is shown in Figure 1, and compared to the baseline and alternative t¯t and background simulation samples. The t¯t contribution is normalised to the theoretical t¯t cross-section prediction at √s = 13 TeV of 832 pb. The agreement between data and simulation in the one and two b-tagged bins used for the cross-section measurement is good. However, the data has about 40% more events with three or more b-tags than the baseline simulation, indicating a mismodelling of events with t¯t produced in association with additional heavy-flavour jets, as discussed further in Section6. There is also an approximately 11% excess of data over simulation for events with zero b-tagged jets which does not affect the measurement, and is compatible with the expected uncertainties in modelling WW [48] and Z+jets production. Distributions of the number of jets, the jet pT, and the electron and muon |η| and pT are shown for opposite-sign eµ events with at least one b-tagged jet in Figure2, where the simulation is normalised to the same number of events as the data. In general, the data and simulation agree well.
5 Background estimation
Most background contributions are estimated from simulation. The Wt single-top background is normal-ised to the approximate NNLO cross-section of 71.7 ± 3.8 pb, determined as in Ref. [49]. The diboson background normalisation is estimated using Sherpa as discussed in Section2. The normalisation of the
Z+jets background, originating from events with a Z → ττ → eµ decay accompanied by one or two b-tagged jets, is determined by scaling the Sherpa simulation with scale factors obtained in Z → ee and Z→ µµ events as described in Section6.
The background from events with one real and one misidentified lepton is estimated from a combina-tion of data and simulacombina-tion, using the method employed in Ref. [13]. Simulation studies show that the samples with a same-sign eµ pair and one or two b-tagged jets are dominated by events with a misidenti-fied lepton, with rates comparable to those in the opposite-sign sample. The contributions of events with misidentified leptons are therefore estimated using the same-sign event counts in data after subtraction of the estimated prompt same-sign contributions, multiplied by the opposite- to same-sign fake-lepton ratios
Rjfor j = 1 and 2 b-tagged jets predicted from simulation. The results are shown in Table2and the pro-cedure is illustrated in Table3, which shows the expected breakdown of same-sign event counts in terms of prompt-lepton and misidentified-lepton events, and the corresponding predictions for misidentified
Events 0 2000 4000 6000 8000 10000 12000 14000 16000 18000 20000 ATLAS -1 = 13 TeV, 3.2 fb s Data 2015 Powheg+PY t t Wt Z+jets Diboson Mis-ID lepton Powheg+PY aMC@NLO+HW++ Powheg+HW++ Powheg+PY radHi Powheg+PY radLo b-tag N 0 1 2 ≥ 3 MC/Data 0.5 1 1.5 Stat. Uncert.
Figure 1: Distribution of the number of b-tagged jets in preselected opposite-sign eµ events. The data are shown compared to the prediction from simulation, broken down into contributions from t¯t (using the baseline Powheg+Pythia6 sample), Wt single top, Z+jets, dibosons, and events with fake electrons or muons, normalised to the same integrated luminosity as the data. The lower part of the figure shows the ratio of simulation to data, using various t¯t signal samples, and the shaded band indicates the statistical uncertainty. The t¯t contribution is normalised to the theoretical t¯t cross-section prediction at √s = 13 TeV of 832 pb.
leptons in the opposite-sign sample with all contributions estimated from simulation. The misidentified-lepton contributions are classified into those where the electron is from a photon conversion, from the decay of a heavy-flavour hadron or from other sources (e.g. a misidentified hadron within a jet), or the muon is from a heavy-flavour decay or other sources (e.g. a pion or kaon decay). The values of Rj are taken to be R1 = 1.55 ± 0.50 and R2 = 1.99 ± 0.82, where the central values are taken from ratios of the total numbers of misidentified-lepton events in opposite- and same-sign samples. The uncertainties encompass the different values of Rjpredicted for the various sub-components of the misidentified-lepton background separately, allowing the background composition to be significantly different from that pre-dicted by simulation, where it is dominated by electrons from photon conversions, followed by electrons and muons from the decays of heavy-flavour hadrons. A 50% uncertainty is assigned to the prompt same-sign contribution, which includes events where the charge of the electron was misidentified (denoted by wrong-sign prompt in Table3) or right-sign with two genuine same-sign leptons (e.g. from t¯tW/Z pro-duction). The largest uncertainties in the misidentified-lepton background come from the uncertainties in
Rj.
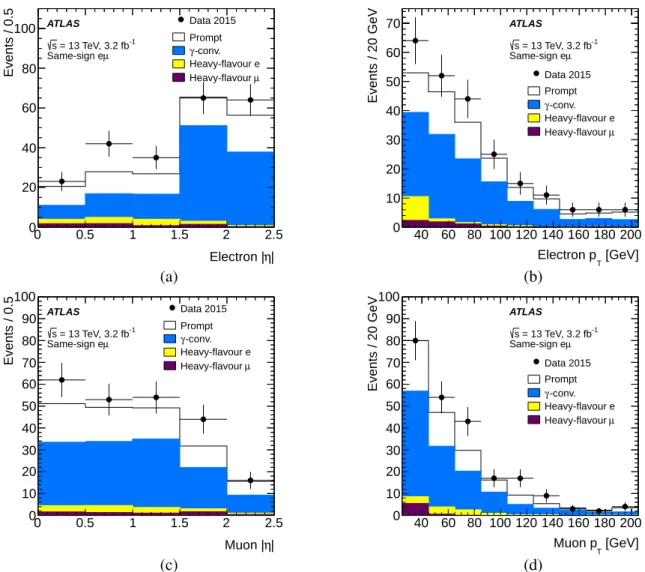
The modelling in simulation of the different components of the misidentified-lepton background is checked by studying kinematic distributions of same-sign events, as illustrated for the pT and |η| distributions of the leptons in events with at least one b-tagged jet in Figure3. The simulation models the shapes of the distributions well, but underestimates the number of data events with two b-tagged jets by about 40%, as shown in Table3. This deficit in simulation is attributed to a larger rate of misidentified-lepton events in data, which increases the estimate of misidentified leptons in the opposite-sign two-b-tag sample accord-ingly. The modelling is also checked in same-sign control samples with relaxed isolation cuts, enhancing the contributions of heavy-flavour decays, and similar levels of agreement were found, giving
confid-Events 0 1000 2000 3000 4000 5000 6000 7000 8000 ATLAS -1 = 13 TeV, 3.2 fb s Data 2015 Powheg+PY t t Wt Z+jets Diboson Mis-ID lepton Powheg+PY aMC@NLO+HW++ Powheg+HW++ jet N 1 2 3 4 5 ≥ 6 MC/Data 0.8 1 1.2 Stat. Uncert. (a) Jets / 20 GeV 0 1000 2000 3000 4000 5000 6000 7000 ATLAS -1 = 13 TeV, 3.2 fb s Data 2015 Powheg+PY t t Wt Z+jets Diboson Mis-ID lepton Powheg+PY aMC@NLO+HW++ Powheg+HW++ [GeV] T b-tagged jet p 50 100 150 200 250 MC/Data 0.8 1 1.2 Stat. Uncert. (b) Events / 0.25 0 500 1000 1500 2000 2500 3000 3500 ATLAS -1 = 13 TeV, 3.2 fb s Data 2015 Powheg+PY t t Wt Z+jets Diboson Mis-ID lepton Powheg+PY aMC@NLO+HW++ Powheg+HW++ | η Electron | 0 0.5 1 1.5 2 2.5 MC/Data 0.9 1 1.1 Stat. Uncert. (c) Events / 20 GeV 0 1000 2000 3000 4000 5000 6000 7000 ATLAS -1 = 13 TeV, 3.2 fb s Data 2015 Powheg+PY t t Wt Z+jets Diboson Mis-ID lepton Powheg+PY aMC@NLO+HW++ Powheg+HW++ [GeV] T Electron p 40 60 80 100 120 140 160 180 200 MC/Data 0.8 1 1.2 Stat. Uncert. (d) Events / 0.25 0 500 1000 1500 2000 2500 3000 ATLAS -1 = 13 TeV, 3.2 fb s Data 2015 Powheg+PY t t Wt Z+jets Diboson Mis-ID lepton Powheg+PY aMC@NLO+HW++ Powheg+HW++ | η Muon | 0 0.5 1 1.5 2 2.5 MC/Data 0.9 1 1.1 Stat. Uncert. (e) Events / 20 GeV 0 1000 2000 3000 4000 5000 6000 7000 ATLAS -1 = 13 TeV, 3.2 fb s Data 2015 Powheg+PY t t Wt Z+jets Diboson Mis-ID lepton Powheg+PY aMC@NLO+HW++ Powheg+HW++ [GeV] T Muon p 40 60 80 100 120 140 160 180 200 MC/Data 0.8 1 1.2 Stat. Uncert. (f)
Figure 2: Distributions of (a) the number of jets, (b) the transverse momentum pT of the b-tagged jets, (c) the |η| of the electron, (d) the pT of the electron, (e) the |η| of the muon and (f) the pT of the muon, in events with an opposite-sign eµ pair and at least one b-tagged jet. The data are compared to the prediction from simulation, broken down into contributions from t¯t (using the baseline Powheg+Pythia6 sample), single top, Z+jets, dibosons, and events with fake electrons or muons, normalised to the same number of entries as the data. The lower parts of the figures show the ratios of simulation to data, using various t¯t signal samples, and with the shaded band indicating the statistical uncertainty. The last histogram bin includes the overflow.
Component OS 1b SS 1b OS 2b SS 2b Conversion e 113 ± 5 83 ± 5 60 ± 3 33.3 ± 1.7 Heavy-flavour e 11.0 ± 1.8 9.8 ± 0.9 1.1 ± 0.3 0.9 ± 0.3 Other e 15 ± 13 0.4 ± 0.2 3.3 ± 1.9 0.2 ± 0.1 Heavy-flavour µ 9.5 ± 0.9 5.6 ± 0.7 1.9 ± 0.4 0.5 ± 0.2 Other µ 3.4 ± 0.5 0.3 ± 0.2 2.7 ± 0.5 0.0 ± 0.0 Total misidentified 151 ± 14 99 ± 5 69 ± 4 35 ± 2 Wrong-sign prompt - 30.0 ± 1.6 - 16.0 ± 1.1 Right-sign prompt - 11.8 ± 0.5 - 4.4 ± 0.2 Total - 141 ± 6 - 55 ± 2 Data - 149 - 79
Table 3: The expected numbers of events with at least one misidentified lepton in the one- and two-b-tag opposite-and same-sign eµ samples, broken down into different categories as described in the text. For the same-sign samples, the contributions from wrong-sign (where the electron charge sign is misreconstructed) and right-sign prompt lepton events are also shown, and the total expected numbers of events are compared to the data. The uncertainties are due to simulation statistics, and numbers quoted as ‘0.0’ are smaller than 0.05.
ence that the simulation adequately models the different sources of misidentified leptons in the selected sample.
6 Systematic uncertainties
The systematic uncertainties in the extracted cross-sections, σt¯tand σfidt¯t , are shown in Table4, together with their effects (where relevant) on the t¯t preselection efficiency ǫeµ, tagging correlation Cband recon-struction efficiency Geµ. Each source of uncertainty is evaluated by repeating the cross-section extrac-tion with all relevant input parameters simultaneously changed by ±1 standard deviaextrac-tion. Correlaextrac-tions between input parameters (in particular significant anti-correlations between ǫeµand Cbwhich contribute with opposite signs to σt¯t) are thus taken into account. The total uncertainties are calculated by adding the effects of all the individual systematic components in quadrature, assuming them to be independent. The sources of systematic uncertainty are discussed in detail below.
t ¯t modelling: The modelling uncertainties in ǫeµand Cb due to the choice of t¯t generator are assessed by comparing the predictions of the baseline Powheg + Pythia6 sample with the various alternative samples discussed in Section2. Three separate uncertainties are considered: the NLO generator un-certainty (evaluated by considering the relative difference between MadGraph5_aMC@NLO + Herwig++ and Powheg + Herwig++), the parton shower and hadronisation uncertainty (evaluated by consider-ing the relative difference between Powheg + Pythia6 and Powheg + Herwig++), and the radiation uncertainty (evaluated by considering half the relative difference between the Powheg + Pythia6 samples with more or less radiation). The prediction for ǫeµis found to be particularly sensitive to the amount of hadronic activity near the leptons, which strongly affects the efficiency of the lepton isolation requirements described in Section3. These isolation efficiencies are therefore measured directly from data, as discussed below, and thus no modelling uncertainty is considered for the lepton isolation. Motivated by the level of agreement for events with at least three b-tags seen in Figure1, an additional uncertainty in Cb is determined by calculating in data and simulation the
| η Electron | 0 0.5 1 1.5 2 2.5 Events / 0.5 0 20 40 60 80 100 ATLAS -1 = 13 TeV, 3.2 fb s Data 2015 Prompt -conv. γ Heavy-flavour e µ Heavy-flavour µ Same-sign e (a) [GeV] T Electron p 40 60 80 100 120 140 160 180 200 Events / 20 GeV 0 10 20 30 40 50 60 70 ATLAS -1 = 13 TeV, 3.2 fb s Data 2015 Prompt -conv. γ Heavy-flavour e µ Heavy-flavour µ Same-sign e (b) | η Muon | 0 0.5 1 1.5 2 2.5 Events / 0.5 0 10 20 30 40 50 60 70 80 90 100 ATLAS -1 = 13 TeV, 3.2 fb s Data 2015 Prompt -conv. γ Heavy-flavour e µ Heavy-flavour µ Same-sign e (c) [GeV] T Muon p 40 60 80 100 120 140 160 180 200 Events / 20 GeV 0 10 20 30 40 50 60 70 80 90 100 ATLAS -1 = 13 TeV, 3.2 fb s Data 2015 Prompt -conv. γ Heavy-flavour e µ Heavy-flavour µ Same-sign e (d)
Figure 3: Distributions of electron and muon |η| and pTin same-sign eµ events with at least one b-tagged jet. The simulation prediction is normalised to the same integrated luminosity as the data, and broken down into contribu-tions where both leptons are prompt, or one is a misidentified lepton from a photon conversion or heavy-flavour decay. In the pTdistributions, the last bin includes the overflow.
Uncertainty (inclusive σt¯t) ∆ǫeµ/ǫeµ[%] ∆Cb/Cb[%] ∆σt¯t/σt¯t[%]
Data statistics 0.9
t¯tNLO modelling 0.7 −0.1 0.8
t¯thadronisation −2.4 0.4 2.8
Initial- and final-state radiation −0.3 0.1 0.4
t¯theavy-flavour production - 0.4 0.4
Parton distribution functions 0.5 - 0.5
Single-top modelling - - 0.3 Single-top/t¯t interference - - 0.6 Single-top Wt cross-section - - 0.5 Diboson modelling - - 0.1 Diboson cross-sections - - 0.0 Z+jets extrapolation - - 0.2
Electron energy scale/resolution 0.2 0.0 0.2
Electron identification 0.3 0.0 0.3
Electron isolation 0.4 - 0.4
Muon momentum scale/resolution −0.0 0.0 0.0
Muon identification 0.4 0.0 0.4
Muon isolation 0.2 - 0.3
Lepton trigger 0.1 0.0 0.2
Jet energy scale 0.3 0.1 0.3
Jet energy resolution −0.1 0.0 0.2
b-tagging - 0.1 0.3 Misidentified leptons - - 0.6 Analysis systematics 2.7 0.6 3.3 Integrated luminosity - - 2.3 LHC beam energy - - 1.5 Total uncertainty 2.7 0.6 4.4
Uncertainty (fiducial σfid
t¯t ) ∆Geµ/Geµ[%] ∆Cb/Cb[%] ∆σ fid t¯t /σ fid t¯t [%] t¯tNLO modelling 0.5 −0.1 0.6 t¯thadronisation −1.6 0.4 1.9
Parton distribution functions 0.1 - 0.1
Other uncertainties (as above) 0.8 0.4 1.5
Analysis systematics (σfid
t¯t ) 1.8 0.6 2.5
Total uncertainty (σfid
t¯t ) 1.8 0.6 3.9
Table 4: Summary of the systematic uncertainties in ǫeµ, Geµ and Cb (with their relative signs where relevant), and the statistical, systematic, luminosity and beam energy uncertainties in the measured t¯t cross-section σt¯t at √s =13 TeV. All uncertainties from the inclusive cross-section measurement apply to the fiducial measurement; in the lower part of the table only the systematic uncertainties that are different for the measurement of the fiducial cross-section σfid
t¯t are given, together with the total analysis systematic uncertainties and total uncertainties in σ fid t¯t . Uncertainties quoted as ‘0.0’ are smaller than 0.05%, whilst ‘-’ indicates that the corresponding uncertainty is not applicable.
ratio R32of the number of events with at least three b-tagged jets to the number with at least two. The baseline simulation sample is reweighted to change the fraction of events with at least three
b-jets at generator level, which effectively changes the t¯t plus heavy-flavour fraction and the values
of both Cband R32. A linear relation between changes in Cband R32is found, and used to translate the difference between the R32values found in data (3.1 ± 0.2%) and simulation (2.21 ± 0.05%) to a shift in Cb of 0.39%. This shift is treated as an additional uncertainty in Cb due to the model-ling of heavy-flavour production in t¯t events, uncorrelated to the NLO, hadronisation and radiation uncertainties discussed above.
Parton distribution functions: The uncertainties in ǫeµ and Cbdue to limited knowledge of the proton PDFs are evaluated by reweighting simulated events produced with MadGraph5_aMC@NLO us-ing the error sets of the NNPDF 3.0 PDF sets [50]. The eigenvectors consist of a central PDF and 100 Monte Carlo replicas, for which the root mean square was taken to calculate the uncer-tainty. The MadGraph5_aMC@NLO sample was produced with CT10; therefore the cross-section was corrected for the relative difference between the central prediction of CT10 and NNPDF 3.0, which is about 1%. The uncertainty using the PDF4LHC Run-2 recommendations with 100 eigen-vectors [51] is very similar to that obtained with NNPDF 3.0.
Single-top modelling: The uncertainties related to Wt single-top modelling are assessed by comparing the predictions of Powheg + Pythia6 and Powheg + Herwig++ and considering the relative differ-ence, comparing the diagram removal and diagram subtraction schemes for dealing with the inter-ference between the t¯t and Wt final states, and also considering half the relative difinter-ference between the Powheg + Pythia6 samples with more or less radiation. Production of single top quarks via the
t- and s-channels gives rise to final states with only one prompt lepton, and is accounted for as part
of the misidentified-lepton background.
Diboson modelling: The uncertainties in the background contributions from dibosons with one or two additional b-tagged jets were assessed by comparing the baseline prediction from Sherpa with that of Powheg+Pythia8. These uncertainties have a limited effect on the cross-section measurement due to the small number of diboson background events.
Background cross-sections: The uncertainties in the Wt single-top and diboson cross-sections are taken to be 5.3% [49] and 6% [52], based on the corresponding theoretical predictions.
Z+jets extrapolation: The cross-sections for Z+jets and especially Z+heavy-flavour jets are subject to large theoretical uncertainties, making purely simulation-based estimates unreliable. This back-ground was therefore determined by measuring the rates of Z → ee and Z → µµ events with one and two b-tagged jets in both data and simulation, and using the resulting ratio to scale the simulation estimate of background from Z → ττ+jets. The Z+jets background prediction from simulation was scaled by 1.1 for the background with one b-tagged jet and by 1.2 for the back-ground with two b-tagged jets. A 50% uncertainty was applied to the Z+jets contributions which cover the differences observed on the event yields comparing Z+jets Sherpa vs Powheg+Pythia8. Lepton-related uncertainties: The modelling of the electron and muon trigger efficiencies,
identifica-tion efficiencies, energy scales and resoluidentifica-tions are studied using Z → ee and Z → µµ decays in data and simulation. Small corrections are applied to the simulation to improve the agreement with the response observed in data. These corrections have associated uncertainties that are propagated to the cross-section measurement. The uncertainty in the trigger efficiency is small compared to those for electron or muon identification since most events are triggered redundantly by both leptons. The
efficiency of the lepton isolation requirements was measured directly in data t¯t events, thus includ-ing the effects of pile-up, by relaxinclud-ing the cuts alternately on electrons and muons as in Ref. [13]. The results, after the correction for the contamination from misidentified leptons estimated using the same-sign eµ samples as described in Section5, showed that the baseline Powheg+Pythia6 simulation overestimates the efficiencies of the isolation requirements by about 0.2% for both the electrons and muons. These corrections were applied to ǫeµ and the corresponding uncertainties are dominated by the subtraction of misidentified leptons.
Jet-related uncertainties: Although the efficiency to reconstruct and b-tag jets from t¯tevents is extracted from the data, uncertainties in the jet energy scale, energy resolution and reconstruction efficiency affect the backgrounds estimated from simulation and the estimate of the tagging correlation Cb. They also have a small effect on ǫeµvia the lepton–jet ∆R separation cuts. The jet energy scale is varied in simulation according to the uncertainties derived from the √s = 8 TeV simulation and data calibration, extrapolated to √s = 13 TeV [53]. The uncertainties are evaluated using a model with 19 separate orthogonal components and the resulting variations were added in quadrature. The jet energy resolution uncertainty is also assessed using √s = 8 TeV data, and extrapolated to √
s =13 TeV.
b-tagging uncertainties: The correlation factor Cbdepends weakly on the b-tagging and mistagging ef-ficiencies predicted by the simulation, as it is evaluated from the numbers of events with one and two b-tagged jets. The uncertainties are determined from √s = 8 TeV data, with additional un-certainties to account for the presence of the newly-installed insertable B-layer detector (IBL) [20] and the extrapolation to √s = 13 TeV. Since the definition of ǫeµdoes not involve b-tagged jets, it has no b-tagging or mistagging-related uncertainties.
Misidentified leptons: The uncertainties in the number of events with misidentified leptons in the one and two b-tagged samples are derived from the statistical uncertainties in the numbers of same-sign lepton events, the systematic uncertainties in the opposite- to same-same-sign ratios Rj, and the uncertainties in the numbers of prompt same-sign events, as discussed in detail in Section5. Integrated luminosity: The uncertainty in the integrated luminosity is 2.1%. It is derived, following a
methodology similar to that detailed in Ref. [54], from a calibration of the luminosity scale using x– ybeam-separation scans performed in August 2015. The effect on the cross-section measurement is slightly larger than 2.1% because the Wt single-top and diboson backgrounds are evaluated from simulation, so they are also sensitive to the assumed integrated luminosity.
LHC beam energy: The LHC beam energy during the 2012 pp run was calibrated to be 0.30 ± 0.66% smaller than the nominal value of 4 TeV per beam, using the revolution frequency difference of pro-tons and lead ions during p+Pb runs in early 2013 [55]. This relative uncertainty is also applicable to the 2015 pp run. Since this calibration is compatible with the nominal centre-of-mass energy of 13 TeV, no correction is applied to the measured σt¯tvalue. However, an uncertainty of 1.5%, corresponding to the expected change in σt¯tfor a 0.66% change in centre-of-mass energy, is quoted separately for the final result.
Top quark mass: Alternative t¯t samples generated with different mt from 170 to 177.5 GeV are used to quantify the dependence of the acceptance for t¯t events on the assumed mt value. The level of Wt single-top background based on the change of the Wt cross-section for the same mass range is also considered. The t¯t acceptance and background effects partially cancel, and the final dependence of the result on the assumed mt value is determined to be dσt¯t/dmt = −0.3%/GeV. The result
of the analysis is reported for a top quark mass of 172.5 GeV, and the small dependence of the cross-section on the assumed mass is not included in the total systematic uncertainty.
The total systematic uncertainties in ǫeµ, Cb, Geµand the fitted values of σt¯tand σfidt¯t are shown in Table4, and the total systematic uncertainties in the individual background components are shown in Table2. The dominant uncertainties in the cross-section result come from the luminosity determination and t¯t modelling, in particular from the t¯t shower and hadronisation uncertainty.
7 Results and conclusions
The inclusive t¯t production cross-section is measured in the dilepton t¯t → eµννb¯b decay channel using 3.2 fb−1 of √s = 13 TeV pp collisions recorded by the ATLAS detector at the LHC. The numbers of opposite-sign eµ events with one and two b-tagged jets are counted, allowing a simultaneous determina-tion of the t¯t cross-secdetermina-tion σt¯tand the probability to reconstruct and b-tag a jet from a t¯t decay. Assuming a top quark mass of mt=172.5 GeV, the result is:
σt¯t=818 ± 8 (stat) ± 27 (syst) ± 19 (lumi) ± 12 (beam) pb,
where the four uncertainties are due to data statistics, experimental and theoretical systematic effects, the integrated luminosity and the LHC beam energy, giving a total relative uncertainty of 4.4%. The combined probability for a jet from a top quark decay to be within the detector acceptance and tagged as a b-jet is measured to be ǫb = 0.559 ± 0.004 ± 0.003, where the first error is statistical and the second systematic, in fair agreement with the nominal prediction from simulation of 0.549.
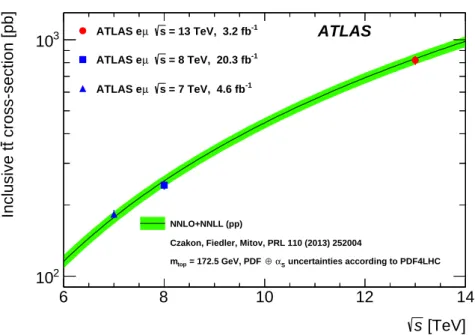
This cross-section measurement is consistent with the theoretical prediction based on NNLO+NNLL cal-culations of 832+40
−46pb at mt =172.5 GeV. Figure4shows the result of this σt¯tmeasurement together with the most precise ATLAS results at √s = 7 and 8 TeV [13]. The data are compared to the NNLO+NNLL predictions as a function of the centre-of-mass energy. The result is also consistent with a recent meas-urement by CMS at √s = 13 TeV using a smaller data sample [56].
The measured fiducial cross-section σfid
t¯t for a t¯t event producing an eµ pair, each lepton originating directly from t → W → ℓ or via a leptonic τ decay t → W → τ → ℓ and satisfying pT > 25 GeV and |η| < 2.5 is:
σfid
t¯t =11.32 ± 0.10 (stat) ± 0.29 (syst) ± 0.26 (lumi) ± 0.17 (beam) pb,
with uncertainties due to data statistics, systematic effects, the knowledge of the integrated luminosity and the LHC beam energy, corresponding to a total relative uncertainty of 3.9% and an internal systematic uncertainty excluding the luminosity and the LHC beam energy of 2.5%. The breakdown of the systematic uncertainties is presented in Table4. Overall, the analysis systematic uncertainties in the fiducial cross-section are smaller than those in the inclusive cross-cross-section, due to the substantial reductions in the PDF and hadronisation uncertainties that contribute significantly to both the acceptance Aeµand reconstruction efficiency Geµ.
[TeV] s 6 8 10 12 14 cross-section [pb]t Inclusive t 2 10 3 10 ATLAS -1 = 13 TeV, 3.2 fb s µ ATLAS e -1 = 8 TeV, 20.3 fb s µ ATLAS e -1 = 7 TeV, 4.6 fb s µ ATLAS e NNLO+NNLL (pp)
Czakon, Fiedler, Mitov, PRL 110 (2013) 252004
uncertainties according to PDF4LHC S α ⊕ = 172.5 GeV, PDF top m
Figure 4: Cross-section for t¯tpair production in pp collisions as a function of centre-of-mass energy. ATLAS results in the dilepton eµ channel at √s = 13, 8 and 7 TeV are compared to the NNLO+NNLL theoretical predictions.
Acknowledgements
We thank CERN for the very successful operation of the LHC, as well as the support staff from our institutions without whom ATLAS could not be operated efficiently.
We acknowledge the support of ANPCyT, Argentina; YerPhI, Armenia; ARC, Australia; BMWFW and FWF, Austria; ANAS, Azerbaijan; SSTC, Belarus; CNPq and FAPESP, Brazil; NSERC, NRC and CFI, Canada; CERN; CONICYT, Chile; CAS, MOST and NSFC, China; COLCIENCIAS, Colombia; MSMT CR, MPO CR and VSC CR, Czech Republic; DNRF and DNSRC, Denmark; IN2P3-CNRS, CEA-DSM/IRFU, France; GNSF, Georgia; BMBF, HGF, and MPG, Germany; GSRT, Greece; RGC, Hong Kong SAR, China; ISF, I-CORE and Benoziyo Center, Israel; INFN, Italy; MEXT and JSPS, Japan; CNRST, Morocco; FOM and NWO, Netherlands; RCN, Norway; MNiSW and NCN, Poland; FCT, Por-tugal; MNE/IFA, Romania; MES of Russia and NRC KI, Russian Federation; JINR; MESTD, Serbia; MSSR, Slovakia; ARRS and MIZŠ, Slovenia; DST/NRF, South Africa; MINECO, Spain; SRC and Wallenberg Foundation, Sweden; SERI, SNSF and Cantons of Bern and Geneva, Switzerland; MOST, Taiwan; TAEK, Turkey; STFC, United Kingdom; DOE and NSF, United States of America. In addition, individual groups and members have received support from BCKDF, the Canada Council, CANARIE, CRC, Compute Canada, FQRNT, and the Ontario Innovation Trust, Canada; EPLANET, ERC, FP7, Ho-rizon 2020 and Marie Skłodowska-Curie Actions, European Union; Investissements d’Avenir Labex and Idex, ANR, Région Auvergne and Fondation Partager le Savoir, France; DFG and AvH Foundation, Ger-many; Herakleitos, Thales and Aristeia programmes co-financed by EU-ESF and the Greek NSRF; BSF, GIF and Minerva, Israel; BRF, Norway; Generalitat de Catalunya, Generalitat Valenciana, Spain; the Royal Society and Leverhulme Trust, United Kingdom.
The crucial computing support from all WLCG partners is acknowledged gratefully, in particular from CERN, the ATLAS Tier-1 facilities at TRIUMF (Canada), NDGF (Denmark, Norway, Sweden),
CC-IN2P3 (France), KIT/GridKA (Germany), INFN-CNAF (Italy), NL-T1 (Netherlands), PIC (Spain), ASGC (Taiwan), RAL (UK) and BNL (USA), the Tier-2 facilities worldwide and large non-WLCG resource pro-viders. Major contributors of computing resources are listed in Ref. [57].
References
[1] M. Cacciari et al., Top-pair production at hadron colliders with next-to-next-to-leading
logarithmic soft-gluon resummation,Phys. Lett. B 710 (2012) 612, arXiv:1111.5869 [hep-ph]. [2] P. Bärnreuther et al., Percent Level Precision Physics at the Tevatron: First Genuine NNLO QCD
Corrections to q¯q → t¯t+ X,Phys. Rev. Lett. 109 (2012) 132001, arXiv:1204.5201 [hep-ph]. [3] M. Czakon and A. Mitov, NNLO corrections to top-pair production at hadron colliders: the
all-fermionic scattering channels,JHEP 1212 (2012) 054, arXiv:1207.0236 [hep-ph]. [4] M. Czakon and A. Mitov,
NNLO corrections to top pair production at hadron colliders: the quark-gluon reaction,
JHEP 1301 (2013) 080, arXiv:1210.6832 [hep-ph].
[5] M. Czakon, P. Fiedler and A. Mitov,
The total top quark pair production cross-section at hadron colliders throughO(α4S),
Phys. Rev. Lett. 110 (2013) 252004, arXiv:1303.6254 [hep-ph].
[6] M. Czakon and A. Mitov,
Top++: A Program for the Calculation of the Top-Pair Cross-Section at Hadron Colliders,
Comput. Phys. Commun. 185 (2014) 2930, arXiv:1112.5675 [hep-ph].
[7] M. Botje et al., The PDF4LHC Working Group Interim Recommendations, (2011), arXiv:1101.0538 [hep-ph].
[8] A.D. Martin et al., Parton distributions for the LHC,Eur. Phys. J. C 63 (2009) 189, arXiv:0901.0002 [hep-ph].
[9] A.D Martin et al., Uncertainties on αsin global PDF analyses and implications for predicted
hadronic cross sections,Eur. Phys. J. C 64 (2009) 653, arXiv:0905.3531 [hep-ph]. [10] H.L. Lai et al., New parton distributions for collider physics,Phys. Rev. D 82 (2010) 074024,
arXiv:1007.2241 [hep-ph].
[11] J. Gao et al., The CT10 NNLO Global Analysis of QCD,Phys. Rev. D 89 (2014) 033009, arXiv:1302.6246 [hep-ph].
[12] R. D. Ball et al., Parton distributions with LHC data,Nucl. Phys. B 867 (2013) 244, arXiv:1207.1303 [hep-ph].
[13] ATLAS Collaboration, Measurement of the t¯t production cross-section using eµ events with
b-tagged jets in pp collisions at √s =7 and 8 TeV with the ATLAS detector,
Eur. Phys. J. C 74 (2014) 3109, arXiv:1406.5375 [hep-ex].
[14] ATLAS Collaboration, Measurement of the top pair production cross section in 8 TeV
proton–proton collisions using kinematic information in the lepton+jets final state with ATLAS,
Phys. Rev. D 91 (2015) 112013, arXiv:1504.04251 [hep-ex].
[15] ATLAS Collaboration, Measurement of the top quark pair production cross-section with ATLAS
[16] CMS Collaboration, Measurement of the t¯t production cross section in the e-mu channel in
proton-proton collisions at √s =7 and 8 TeV, (2016), arXiv:1603.02303 [hep-ex].
[17] CMS Collaboration, Measurements of the t¯t production cross section in lepton+jets final states in
pp collisions at 8 TeV and ratio of 8 to 7 TeV cross sections, (2016),
arXiv:1602.09024 [hep-ex].
[18] CMS Collaboration, Measurement of the t¯t production cross section in pp collisions at √s = 7
TeV with lepton + jets final states,Phys. Lett. B 720 (2013) 83, arXiv:1212.6682 [hep-ex]. [19] ATLAS Collaboration, The ATLAS Experiment at the CERN Large Hadron Collider,
JINST 3 (2008) S08003.
[20] ATLAS Collaboration, ATLAS Insertable B-Layer Technical Design Report,
ATLAS-TDR-19 (2010), url:http://cdsweb.cern.ch/record/1291633.
[21] ATLAS Collaboration, The ATLAS Simulation Infrastructure,Eur. Phys. J. C 70 (2010) 823, arXiv:1005.4568 [hep-ex].
[22] S. Agostinelli et al., GEANT4: A simulation toolkit,Nucl. Instr. Meth. A 506 (2003) 250. [23] ATLAS Collaboration,
The simulation principle and performance of the ATLAS fast calorimeter simulation FastCaloSim,
ATLAS-PHYS-PUB-2010-013 (2010), url:http://cdsweb.cern.ch/record/1300517.
[24] T. Sjöstrand, S. Mrenna and P. Skands, A Brief Introduction to Pythia 8.1,
Comput. Phys. Commun. 178 (2008) 852, arXiv:0710.3820 [hep-ph].
[25] P. Nason, A new method for combining NLO QCD with shower Monte Carlo algorithms,
JHEP 0411 (2004) 040, arXiv:hep-ph/0409146.
[26] S. Frixione, P. Nason and C. Oleari,
Matching NLO QCD computations with Parton Shower simulations: the POWHEG method,
JHEP 0711 (2007) 070, arXiv:0709.2092 [hep-ph].
[27] S. Alioli, P. Nason, C. Oleari and E. Re, A general framework for implementing NLO calculations
in shower Monte Carlo programs: the POWHEG BOX,JHEP 1006 (2010) 043,
arXiv:1002.2581 [hep-ph].
[28] T. Sjöstrand, S. Mrenna and P. Skands, Pythia 6.4 Physics and Manual,JHEP 0605 (2006) 026, arXiv:hep-ph/0603175.
[29] P. Z. Skands, Tuning Monte Carlo Generators: The Perugia Tunes,
Phys. Rev. D 82 (2010) 074018, arXiv:1005.3457 [hep-ph].
[30] ATLAS Collaboration, Comparison of Monte Carlo generator predictions to ATLAS
measurements of top pair production at √s =7 TeV, ATLAS-PHYS-PUB-2015-002 (2015),
url:http://cdsweb.cern.ch/record/1981319.
[31] D. J. Lange, The EvtGen particle decay simulation package, Nucl. Instrum. Meth. A 462 (2001) 152.
[32] M. Bahr et al., Herwig++ Physics and Manual,Eur. Phys. J. C 58 (2008) 639, arXiv:0803.0883 [hep-ph].
[33] J. Alwall et al., The automated computation of tree-level and next-to-leading order differential
cross sections, and their matching to parton shower simulations,JHEP 1407 (2014) 079,
[34] ATLAS Collaboration,
Simulation of top-quark production for the ATLAS experiment at √s =13 TeV,
ATL-PHYS-PUB-2016-004 (2016), url:http://cdsweb.cern.ch/record/2120417.
[35] S. Frixione et al., Single-top hadroproduction in association with a W boson,
JHEP 0807 (2008) 029, arXiv:0805.3067 [hep-ph].
[36] T. Gleisberg et al., Event generation with SHERPA 1.1,JHEP 0902 (2009) 007, arXiv:0811.4622 [hep-ph].
[37] T. Gleisberg and S. Höche, Comix, a new matrix element generator,JHEP 0812 (2008) 039, arXiv:0808.3674 [hep-ph].
[38] F. Cascioli, P. Maierhofer and S. Pozzorini, Scattering Amplitudes with Open Loops,
Phys. Rev. Lett. 108 (2012) 111601, arXiv:1111.5206 [hep-ph].
[39] S. Höche, F. Krauss, M. Schönherr and F. Siegert,
QCD matrix elements + parton showers: The NLO case,JHEP 1304 (2013) 027,
arXiv:1207.5030 [hep-ph].
[40] J. Alwall, M. Herquet, F. Maltoni, O. Mattelaer and T. Stelzer, MadGraph 5 : Going Beyond,
JHEP 1106 (2011) 128, arXiv:1106.0522 [hep-ph].
[41] ATLAS Collaboration, Electron reconstruction and identification efficiency measurements with
the ATLAS detector using the 2011 LHC proton–proton collision data,
Eur. Phys. J. C 74 (2014) 2941, arXiv:1404.2240 [hep-ex].
[42] ATLAS Collaboration, Electron efficiency measurements with the ATLAS detector using the 2012
LHC proton–proton collision data, ATLAS-CONF-2014-032 (2014),
url:http://cdsweb.cern.ch/record/1706245.
[43] ATLAS Collaboration, Muon reconstruction performance of the ATLAS detector in proton–proton
collision data at √s =13 TeV, (2016), arXiv:1603.05598 [hep-ex]. [44] M. Cacciari and G. P. Salam, Dispelling the N3myth for the k
tjet-finder, Phys. Lett. B 641 (2006) 57, arXiv:0512210 [hep-ph].
[45] M. Cacciari, G. P. Salam and G. Soyez, The anti-kt jet clustering algorithm,
JHEP 0804 (2008) 063, arXiv:0802.1189 [hep-ph].
[46] ATLAS Collaboration, Performance of pile-up mitigation techniques for jets in pp collisions at √
s =8 TeV using the ATLAS detector,Eur. Phys. J. C 76 (2016) 581,
arXiv:1510.03823 [hep-ex].
[47] ATLAS Collaboration, Expected performance of the ATLAS b-tagging algorithms in Run-2,
ATL-PHYS-PUB-2015-022 (2015), url:http://cdsweb.cern.ch/record/2037697.
[48] ATLAS Collaboration,
Measurement of total and differential W+W−production cross sections in proton-proton collisions
at √s = 8 TeV with the ATLAS detector and limits on anomalous triple-gauge-boson couplings,
(2016), arXiv:1603.01702 [hep-ex]. [49] N. Kidonakis,
Two-loop soft anomalous dimensions for single top quark associated production with a W−or H−,
Phys. Rev. D 82 (2010) 054018, arXiv:1005.4451 [hep-ph].
[50] R. D. Ball et al., Parton distributions for the LHC Run II,JHEP 04 (2015) 040, arXiv:1410.8849 [hep-ph].
[51] J. Butterworth et al., PDF4LHC recommendations for LHC Run II,
J. Phys. G: Nucl. Part. Phys. 43 (2016) 023001, arXiv:1510.03865 [hep-ph].
[52] J. M. Campbell and R. K. Ellis, An update on vector boson pair production at hadron colliders,
Phys. Rev. D 60 (1999) 113006, arXiv:9905386 [hep-ph].
[53] ATLAS Collaboration, Jet Calibration and Systematic Uncertainties for Jets Reconstructed in the
ATLAS Detector at √s=13 TeV, ATL-PHYS-PUB-2015-015 (2015),
url:http://cdsweb.cern.ch/record/2037613.
[54] ATLAS Collaboration, Improved luminosity determination in pp collisions at √s = 7 TeV using
the ATLAS detector at the LHC,Eur. Phys. J. C 73 (2013) 2518, arXiv:1302.4393 [hep-ex]. [55] J. Wenninger, Energy Calibration of the LHC Beams at 4 TeV, CERN-ATS-2013-040 (2013),
url:http://cdsweb.cern.ch/record/1546734.
[56] CMS Collaboration, Measurement of the top quark pair production cross section in proton-proton
collisions at √s =13 TeV,Phys. Rev. Lett. 116 (2016) 052002, arXiv:1510.05302 [hep-ex]. [57] ATLAS Collaboration, ATLAS Computing Acknowledgements 2016–2017,
The ATLAS Collaboration
M. Aaboud136d, G. Aad87, B. Abbott114, J. Abdallah65, O. Abdinov12, B. Abeloos118, R. Aben108, O.S. AbouZeid138, N.L. Abraham150, H. Abramowicz154, H. Abreu153, R. Abreu117, Y. Abulaiti147a,147b, B.S. Acharya164a,164b ,a, L. Adamczyk40a, D.L. Adams27, J. Adelman109, S. Adomeit101, T. Adye132, A.A. Affolder76, T. Agatonovic-Jovin14, J. Agricola56, J.A. Aguilar-Saavedra127a,127f, S.P. Ahlen24, F. Ahmadov67,b, G. Aielli134a,134b, H. Akerstedt147a,147b, T.P.A. Åkesson83, A.V. Akimov97,
G.L. Alberghi22a,22b, J. Albert169, S. Albrand57, M.J. Alconada Verzini73, M. Aleksa32,
I.N. Aleksandrov67, C. Alexa28b, G. Alexander154, T. Alexopoulos10, M. Alhroob114, B. Ali129, M. Aliev75a,75b, G. Alimonti93a, J. Alison33, S.P. Alkire37, B.M.M. Allbrooke150, B.W. Allen117, P.P. Allport19, A. Aloisio105a,105b, A. Alonso38, F. Alonso73, C. Alpigiani139, M. Alstaty87,
B. Alvarez Gonzalez32, D. Álvarez Piqueras167, M.G. Alviggi105a,105b, B.T. Amadio16, K. Amako68, Y. Amaral Coutinho26a, C. Amelung25, D. Amidei91, S.P. Amor Dos Santos127a,127c, A. Amorim127a,127b, S. Amoroso32, G. Amundsen25, C. Anastopoulos140, L.S. Ancu51, N. Andari109, T. Andeen11,
C.F. Anders60b, G. Anders32, J.K. Anders76, K.J. Anderson33, A. Andreazza93a,93b, V. Andrei60a, S. Angelidakis9, I. Angelozzi108, P. Anger46, A. Angerami37, F. Anghinolfi32, A.V. Anisenkov110,c, N. Anjos13, A. Annovi125a,125b, C. Antel60a, M. Antonelli49, A. Antonov99,∗, F. Anulli133a, M. Aoki68, L. Aperio Bella19, G. Arabidze92, Y. Arai68, J.P. Araque127a, A.T.H. Arce47, F.A. Arduh73, J-F. Arguin96, S. Argyropoulos65, M. Arik20a, A.J. Armbruster144, L.J. Armitage78, O. Arnaez32, H. Arnold50,
M. Arratia30, O. Arslan23, A. Artamonov98, G. Artoni121, S. Artz85, S. Asai156, N. Asbah44,
A. Ashkenazi154, B. Åsman147a,147b, L. Asquith150, K. Assamagan27, R. Astalos145a, M. Atkinson166, N.B. Atlay142, K. Augsten129, G. Avolio32, B. Axen16, M.K. Ayoub118, G. Azuelos96,d, M.A. Baak32, A.E. Baas60a, M.J. Baca19, H. Bachacou137, K. Bachas75a,75b, M. Backes32, M. Backhaus32,
P. Bagiacchi133a,133b, P. Bagnaia133a,133b, Y. Bai35a, J.T. Baines132, O.K. Baker176, E.M. Baldin110,c, P. Balek130, T. Balestri149, F. Balli137, W.K. Balunas123, E. Banas41, Sw. Banerjee173,e,
A.A.E. Bannoura175, L. Barak32, E.L. Barberio90, D. Barberis52a,52b, M. Barbero87, T. Barillari102, T. Barklow144, N. Barlow30, S.L. Barnes86, B.M. Barnett132, R.M. Barnett16, Z. Barnovska5, A. Baroncelli135a, G. Barone25, A.J. Barr121, L. Barranco Navarro167, F. Barreiro84,
J. Barreiro Guimarães da Costa35a, R. Bartoldus144, A.E. Barton74, P. Bartos145a, A. Basalaev124, A. Bassalat118, R.L. Bates55, S.J. Batista159, J.R. Batley30, M. Battaglia138, M. Bauce133a,133b, F. Bauer137, H.S. Bawa144, f, J.B. Beacham112, M.D. Beattie74, T. Beau82, P.H. Beauchemin162,
P. Bechtle23, H.P. Beck18,g, K. Becker121, M. Becker85, M. Beckingham170, C. Becot111, A.J. Beddall20e, A. Beddall20b, V.A. Bednyakov67, M. Bedognetti108, C.P. Bee149, L.J. Beemster108, T.A. Beermann32, M. Begel27, J.K. Behr44, C. Belanger-Champagne89, A.S. Bell80, G. Bella154, L. Bellagamba22a, A. Bellerive31, M. Bellomo88, K. Belotskiy99, O. Beltramello32, N.L. Belyaev99, O. Benary154, D. Benchekroun136a, M. Bender101, K. Bendtz147a,147b, N. Benekos10, Y. Benhammou154, E. Benhar Noccioli176, J. Benitez65, D.P. Benjamin47, J.R. Bensinger25, S. Bentvelsen108, L. Beresford121, M. Beretta49, D. Berge108, E. Bergeaas Kuutmann165, N. Berger5, J. Beringer16, S. Berlendis57, N.R. Bernard88, C. Bernius111, F.U. Bernlochner23, T. Berry79, P. Berta130, C. Bertella85, G. Bertoli147a,147b, F. Bertolucci125a,125b, I.A. Bertram74, C. Bertsche44, D. Bertsche114, G.J. Besjes38, O. Bessidskaia Bylund147a,147b, M. Bessner44, N. Besson137, C. Betancourt50, S. Bethke102, A.J. Bevan78, W. Bhimji16, R.M. Bianchi126, L. Bianchini25, M. Bianco32, O. Biebel101, D. Biedermann17,
R. Bielski86, N.V. Biesuz125a,125b, M. Biglietti135a, J. Bilbao De Mendizabal51, H. Bilokon49, M. Bindi56, S. Binet118, A. Bingul20b, C. Bini133a,133b, S. Biondi22a,22b, D.M. Bjergaard47, C.W. Black151,
J.E. Black144, K.M. Black24, D. Blackburn139, R.E. Blair6, J.-B. Blanchard137, J.E. Blanco79,