Local adaptation of sex induction in a facultative sexual crustacean: insights from QTL mapping and natural populations of Daphnia magna
A N N E C . R O U L I N , * J A R K K O R O U T T U , * M A T T H E W D . H A L L , * T I M J A N I C K E , * I S A B E L L E C O L S O N , * C H R I S T O P H R . H A A G† and D I E T E R E B E R T *
*Department of Evolutionary Biology,Zoological Institute, University of Basel, Vesalgasse 1, Basel, Switzerland,†Department of Ecology and Evolution,University of Fribourg, Chemin du musee 10, 1700 Fribourg, Switzerland
Abstract
Dormancy is a common adaptation in invertebrates to survive harsh conditions. Trig- gered by environmental cues, populations produce resting eggs that allow them to sur- vive temporally unsuitable conditions.
Daphnia magnais a crustacean that reproduces by cyclical parthenogenesis, alternating between the production of asexual offspring and the sexual reproduction of diapausing eggs (ephippia). Prior to ephippia produc- tion, males (necessary to ensure ephippia fertilization) are produced parthenogeneti- cally. Both the production of ephippia and the parthenogenetic production of males are induced by environmental factors. Here, we test the hypothesis that the induction of
D. magnaresting egg production shows a signature of local adaptation. We postu- lated that
Daphnia from permanent ponds would produce fewer ephippia and malesthan
Daphniafrom intermittent ponds and that the frequency and season of habitat deterioration would correlate with the timing and amount of male and ephippia pro- duction. To test this, we quantified the production of males and ephippia in clonal
D. magnapopulations in several different controlled environments. We found that the production of both ephippia and males varies strongly among populations in a way that suggests local adaptation. By performing quantitative trait locus mapping with par- ent clones from contrasting pond environments, we identified nonoverlapping genomic regions associated with male and ephippia production. As the traits are influenced by two different genomic regions, and both are necessary for successful resting egg production, we suggest that the genes for their induction co-evolve.
Keywords: Daphnia magna, local adaptation, male production, quantitative trait locus mapping, resting eggs
Introduction
In natural habitats characterized by spatial and tempo- ral diversity, variation in selection acting on heritable traits can cause phenotypic divergence between popu- lations of the same species (Merila & Crnokrak 2001;
Sanford & Kelly 2011). Populations may exhibit local adaptation if selection is not counteracted by processes such as gene flow, mutation and genetic drift (Kawecki & Ebert 2004). However, while empirical
studies are increasingly finding evidence for local adaptation in natural populations (Hereford 2009; Bar- rett & Hoekstra 2011), the mechanisms underlying this adaptation remain unclear, as the connection between genotype, phenotype and local environments requires a good understanding of the organism’s ecology as well as powerful genomic resources (Nachman et al.
2003). So far, only a few studies, often conducted with model organisms, have been able to illuminate the genetic basis of local adaptation (Michalak et al. 2001;
Nachman et al. 2003; Korol et al. 2006; Lowry & Willis 2010; Manceau et al. 2011). Fortunately, alternative methods to identify the genetic basis of phenotypic Correspondence: Anne C. Roulin, Fax: +41 (0) 612 670 362;
E-mail: [email protected]
Published in "0ROHFXODU(FRORJ\±"
which should be cited to refer to this work.
http://doc.rero.ch
variation and adaptation are now available, even for nonmodel organisms. These tools include QST/FST com- parison (Le Corre & Kremer 2012), genome wide asso- ciation (GWA) mapping (Oleksyk et al. 2010) and quantitative trait locus (QTL) analysis (Morjan &
Rieseberg 2004), which combined with the growing number of sequenced genomes, offer effective tools to identify the genetic basis to phenotypic variation and adaptation.
In this study, we use population comparisons and QTL mapping to explore how populations adapt locally to survive seasonal environmental deterioration. Many habitats inhibit plant and animal growth and reproduc- tion for part of the year. Some organisms cope with these adverse conditions by undergoing dormancy (Carlisle & Pitman 1961; Moran 1992; Gilbert & Schrei- ber 1998; St€ocklin & Fischer 1999; Evans & Dennehy 2005). While many environmental cues, such as change in temperature (Simon et al. 2002), food quality/avail- ability (Koch et al. 2009) and predation (Hairston &
Olds 1984) trigger quiescence (a dormant stage caused and maintained by environmental condition, Caceres 1997), variation in day length has often been shown to be the signal for synchronizing dormancy with environ- mental changes (Moran 1992; Alekseev & Lampert 2001;
Gilbert & Schr€oder 2004; Mathiaset al.2007 Alekseev &
Lajus 2009). The genetic basis of dormancy has been partially explained in insect species (Emerson et al.
2009). For example, the analysis of photoperiodic mutants in the fly Chymomyza costata and the linden bug Pyrrhocoris apterus has revealed that the alteration of circadian clock gene expression is necessary to enter dormancy (Syrova et al. 2003; Stehliket al. 2008), while complex gene cascades and hormone interactions are responsible for maintaining and ending it. (Emerson et al.2009; Tapia & Morano 2010; for review see Denlin- ger 2002). However, other than studies conducted on Caenorhabditis elegans(Fielenbach & Antebi 2008; Harvey et al. 2008), the genetic architecture of dormancy induc- tion, that is, the genes and pathways triggering dor- mancy in response to environmental stress, remains largely unknown.
The planktonic crustacean Daphnia magna constitutes an ideal model system to study the local adaptation of dormancy induction at the ecological and genetic level.
Its ecology is well known, and clones of populations from habitats with strong contrasting seasonality are available. In addition, the genome of D. magna is in advanced draft stage (The D. magna Genome Consor- tium, in preparation), and genetic maps are available (Routtu et al. 2010; Routtu et al., in preparation), allowing QTL mapping of this trait. As resting eggs are only produced sexually, dormancy in D. magna is directly linked to sexual reproduction. Like most
Daphniaspecies,D. magnareproduce by cyclical parthe- nogenesis (Stross & Hill 1965; Alekseev & Lampert 2001; Altermatt & Ebert 2008), alternating the produc- tion of asexual eggs (clonal reproduction) with the pro- duction of resting eggs (hereafter called ephippia) by sexual reproduction. Ephippia contain a maximum of two embryos, while asexual clutches can give rise to dozens of offspring (Ebert 2005). Individual females can alternate between asexual and sexual reproduction.
While ephippia are essential to survive harsh condi- tions, their production is costly, as it reduces asexual reproduction and, therefore, short-term fitness. Thus, the female’s reproductive strategy involves a compro- mise between maximizing fecundity through asexual reproduction and ensuring long-term survival through ephippia production (Deng 1996). Male production, required for ephippia fertilization, represents the sec- ond component of sexual reproduction in D. magna.
Males are produced when the mother—triggered by biotic or abiotic stresses, such as pollution, parasite infection, food and photoperiod (Zhang & Baer 2000;
Haeba et al. 2008; Roth et al. 2008; Baer et al. 2009)—
secretes a juvenile hormone (Oda et al. 2006). The pro- duction of males starts before ephippia production (Galimovet al. 2011). At the population level, ephippia and male production are synchronized to maximize the chance of fertilization. However, at the clone level, male and ephippia production are uncoupled, which reduces the chance of inbreeding due to within-clone mating (Yampolsky 1992; DeMeester & Vanoverbeke 1999).
The induction of both male and ephippia produc- tion represents good candidates for traits evolved to maximize fitness under local conditions, because their production is necessary to enter dormancy and thus to ensure population survival. Nevertheless, little is known about their potential adaptation to local envi- ronment. In rotifers, which harbour a life cycle com- parable to D. magna’s, a recent studied showed that sex dormancy is correlated with water permanency (Smith & Snell 2012) and that the transition to obli- gate parthenogenesis is controlled by one locus show- ing Mendelian segregation (Stelzer et al. 2010). Early studies on D. magna suggest genotypic differences between parthenogenetic and sexual individuals (Hebert 1974), but only few disjointed works have suggested that ephippia and male production might be locally adapted traits. One study, for example, showed that Daphnia populations in Finland living in small rock pools that dried up occasionally during summer, produced resting egg all summer, with a peak in July (Altermatt & Ebert 2008), whereas a pop- ulation from continental Russia (Moscow) produced resting eggs only in September before the planktonic
http://doc.rero.ch
populations were killed by freezing (Galimov et al.
2011). Nevertheless, relatively little is known about the genetic architecture of sex and dormancy induc- tion in invertebrates.
In this study, we used 13 populations of D. magna from contrasting diverse and geographically separate habitats to assess whether traits related to dormancy are correlated with local habitat conditions. Using a large number of broadly distributed populations, we aimed to extend previous studies that have shown cor- relation between local habitat conditions and dormancy in organisms such asDaphnia (Caceres & Tessier 2004), aphids (Sandrock et al. 2011) and rotifers (Gilbert &
Schreiber 1998; Campillo et al. 2011). We then tested experimentally two hypotheses that allowed us to investigate, for the first time in a cyclical parthenoge- netic organism, the genetic basis of local adaptation regarding sex induction.
First, we hypothesized that local adaptation for the induction of males and ephippia production should be observed in natural populations living in different envi- ronmental conditions. Under this hypothesis, male and ephippia should be produced before environmental deterioration. Thus, their production should vary in intensity and timing among populations with different seasonal cycles of habitat deterioration. Specifically, pop- ulations from ponds that typically dry up during sum- mer and have water in winter would be expected to produce males and ephippia in spring. In contrast, pop- ulations from ponds that have water in summer but typically freeze in the winter would be expected to pro- duce males and ephippia in autumn when day length decreases. Furthermore, populations from ephemeral environments (e.g. rock pools), where the water freezes in winter but also dries out unpredictably during sum- mer, would be expected to produce male and ephippia at a high rate regardless of the photoperiod because both long and short day are synonymous with habitat deterioration (drying and freezing, respectively). Con- versely, populations from mild and rainy climatic regions would be expected to produce low numbers of males and ephippia, because their year-round condi- tions allow for planktonic individuals to survive perma- nently.
Second, we postulated that if male and ephippia pro- duction are locally adapted, both traits should be genet- ically determined. We therefore aimed to identify the genetic components of male and ephippia induction using QTL mapping. Given that male and ephippia pro- duction should be induced in a synchronized way, but not necessarily by the same stimulus, the identification of distinct genomic regions responsible for each trait would suggest the co-evolution of induction of males and ephippia production.
Materials and methods
Variation in male and ephippia production in natural populations
System. We used D. magnaclones from 13 natural pop- ulations collected across Europe and the Middle East (Fig. 1). The populations were named for the country, region or city where they were collected: Finland, White Sea, Sweden, United Kingdom (UK), Belgium, Italy, Israel, Astrakhan, Belarus, Germany_1 (Kniphagen), Germany_2 (Munich), Moscow and Volgograd. Two to three clones were randomly chosen from each popula- tion (total: 37 clones), representing within-population phenotypic and genetic diversity. The populations were assigned to one of four environment types (see Fig. 1) as defined by field observations (Dieter Ebert, pers.
observations), local average temperature data (http://
www.weatherbase.com) or previous studies (Decaestec- ker et al. 2002; Altermatt et al. 2009; Galimov et al.
2011): (i) ephemeral (unstable and unpredictable envi- ronments with desiccation during spring/summer and freezing during autumn/winter, typical of small Scandi- navian rock pools <40 cm deep and <3 m2 in surface area); (ii) permanent (mild, stable environments with water throughout the year, as is typical in coastal popu- lations of central Europe); (iii) seasonal summer-dry (warm environments with ponds that desiccate during summer, no freezing, typical of southern populations) and (iv) seasonal winter-frozen (cold environments, ponds freeze in winter, no desiccation in summer, typical of central and eastern Eurasian populations).
Initial culture conditions. For several generations before the experiment, clones were cultured in the laboratory in artificial Daphnia medium (ADaM) (Kluttgen et al.
1994) and kept at 20°C with 16 h of light per day. For all experiments, animals were kept in ADaM and fed 4 million algae cells per day per jar (100 mL).
Experimental design and procedures. For each clonal culture, we started 10 independent replicates using 1–3-day-old females raised under the initial culture conditions outlined above. We then distributed the rep- licates randomly across trays and shelves in the incuba- tor to minimize bias due to position effects and kept them at 20°C, with 12 h of light per day for 2 weeks.
The replicates were then split into two sets, each con- taining the same number of replicates per clone and population (i.e. per treatment: 13 populations92–3 clones95 replicates). For one set, day length was grad- ually increased every day over 6 weeks (~5 generations) to reach a photoperiod of 18 hours of light/6 hours of dark per day (spring to summer photoperiod). For the
http://doc.rero.ch
second set of replicates, day length was gradually decreased to reach 6 hours of light/18 hours of dark per day (late summer to winter photoperiod). We thus covered the whole range of photoperiods encountered by the populations in the study. At the end of the experiment, we assessed the number of ephippia, males and females produced in each jar according to the following measures: ephippia production (number of ephippia produced divided by the number of females at the end of the experiment) and male production (number of males produced divided by the total num- ber of individuals at the end of the experiment).
Statistical analyses. Differences in ephippia production (number of ephippia weighted by the number of females in the jar) and male production (number of males divided by the total number of individuals in the jar) were tested using mixed-effect models (LMMs). The animals’ environment (ephemeral, permanent, seasonal summer-dry, seasonal winter-frozen), the treatment (increase or decrease of the day length) and their inter- action were entered as fixed factors. Population and clone were used as random factors, with clone being nested within population. To ensure normal distribution of residuals, a cube–square transformation was applied to ephippia production. Male production was arcsine
square-root transformed, although the final figures are presented on the original scales. All statistical analyses were performed with JMP, 7.0.1. (SAS Institute Inc., Cary, NC, USA).
QTL analysis
Experimental lines and genetic map. This analysis is based on the QTL panel introduced by Routtu et al. (2010).
We summarize only the features important for our study. Two inbred parental lines, one originating from the seasonal winter-frozen population Germany_2 (Iinb1, genotype AA) and one from an ephemeral rock pool population in Finland (Xinb3, genotype BB), were crossed. The original clones used to produce the inbred parental lines were part of the above experiment on natural populations (Germany_2 for Iinb1 and Finland for Xinb3). The Finnish clone produced more males and ephippia than the clone from Germany_2. The resulting F1 clone was self-crossed (mating with members of the same clone is genetically equivalent to self-fertilization), generating F2 lines with recombinant genotypes. To produce two generations of the D. magna linkage map, each F2 line was first genotyped at 109 microsatellite markers (Routtu et al. 2010) and later at 1324 SNP- markers using an SNP-array (Routtu et al. publication Fig. 1 Geographic map displaying popu- lation locations. Numbers in brackets indicate the number of clones used per population. *Shows the two populations (Finland and Munich) used to develop the F2 panel parental inbred lines Xinb3 and Iinb1. The dashed line represents the January zero degree isocline, separating winter-frozen ( ) from permanent (+) environments.
http://doc.rero.ch
in preparation). SNP and microsatellite data on 180 F2 lines were used.
Assessment of male production in the F2 lines. Male pro- duction can be induced in the laboratory by different environmental cues. We used two experimental designs to monitor male production, assuming that the proba- bility of obtaining an artefactual signal twice at the same position was low. The same 180 F2 lines used for the map construction were used in both experiments.
The first experiment was performed in July 2007.
Prior to the experiment and for each F2 line, we trans- ferred five neonate females of the second generation together into fresh 400-mL jars, assuming that maternal effects were minimized by raising each replicate sepa- rately for two generations. These five females were allowed to reproduce and to build up clonal popula- tions for 4 weeks, during which no offspring were removed. Male production was estimated by sexing a random subset of 20 juveniles using a dissecting scope.
The second experiment was performed in February 2011. Prior to the experiment and for each F2 line, as well as for the parental lines, we started eight indepen- dent replicates using 1–3-day-old females that were grown separately in 400-mL jars for three generations to avoid similarities between replicates due to maternal effects. We distributed the replicates randomly across trays and shelves in the incubator to ensure no bias due to position effect. During the 6-week experimental phase, the initial females were singly transferred into a fresh jar once a week, and the offspring of each female were sexed. Because offspring production was low dur- ing the first 2 weeks, only offspring produced during the last 4 weeks were included in the analysis. The average offspring sex ratio (number of males/total number of offspring produced) during these 4 weeks was used as a response variable.
Assessment of ephippia production in the F2 lines. At the end of the 2007 experiment, the number of ephippia produced in each jar was counted. However, as very few ephippia were produced in the 2011 experiment, we included an additional step, as in the 2007 experi- mental design, in which we transferred five females of the third generation into a single 400-mL jar for each F2 line, as well as for the parental lines. The populations were grown for 4 weeks, and the ephippia were counted.
QTL mapping. The QTL mapping for male and ephippia production was performed using the R/qtl package (Bro- man et al. 2003; version R 2.14.2) as implemented in R (version 2.10.1, R Development Core Team 2005). Because our data for male and ephippia production did not
follow a normal distribution, we used a nonparametric model to perform a single-QTL genome scan. This assumes that the trait is influenced by just a single QTL.
The LOD thresholds for significance level were obtained by performing 1000 permutations. We then looked for additional QTLs and for interactions between QTLs by performing a two-QTL genome scan. The phenotypic variances explained by our QTL were first estimated by fitting a model with only one major QTL and then by fit- ting a model adding the interactions between the main QTL and additional loci. Comparisons of male and ep- hippia production between AA (German background), AB and BB (Finnish background) genotypes were per- formed in R. To map our loci of interest, each marker of interest was submitted to aBLASTNsearch (Altschulet al.
1990) against the whole genome ofD. magna.
Genotyping error. To estimate the rate of genotyping errors, one of the markers flanking the peaks for ephip- pia production (SNPcontig29113_349, data set 2011) was re-genotyped for a subsample of 25 lines, including the two parental lines Iinb1 and Xinb3, as well as the F1 line. PCR followed a standard protocol with an anneal- ing temperature of 55°C (Forward primer: GATAGCG GTGGCTTGAGTTT; Reverse primer: TTAGTCCGCTCC GGTCTATG).
Results
Among-population variation in male and ephippia production
Ephippia production was significantly influenced by an interaction between environment type and treatment (Table 1A). A significant contrast P-value in Table 1 means that ephippia production is significantly different in long day vs. short day. As predicted, summer-dry populations produced more ephippia under increasing day length, while populations from winter-frozen ponds produced significantly more ephippia under decreasing day length (Fig. 2, Table 1B). Populations belonging to the ephemeral and the permanent environ- ment group were not sensitive to the day length treat- ment, but they did differ in the overall amount of ephippia produced (Fig. 2, Table 1B), with clones from ephemeral populations producing many more ephippia, than clones from permanent populations. It is noted that the same results are obtained if the analysis is per- formed with the raw number of ephippia and the den- sity as a co-variate.
Male production was significantly influenced by the environment type, but not by the treatment or by inter- action between treatment and environment (Table 1A).
Male production was highest in animals from the
http://doc.rero.ch
seasonal winter-frozen populations, followed by the ephemeral, the seasonal summer-dry and the permanent populations (Fig.2, Table 1B).
QTL analysis
Differences between the parental lines for male and ephippia production. The experiment performed in 2011 on the
two parental lines confirmed that the Finnish clone Xinb3 (BB genotype) produced significantly more males than the German clone Iinb1 (AA genotype) (Wilcoxon W=43,P=0.017, Fig. 3). The same was true for ephippia production (WilcoxonW=61.5,P=0.001, Fig. 3).
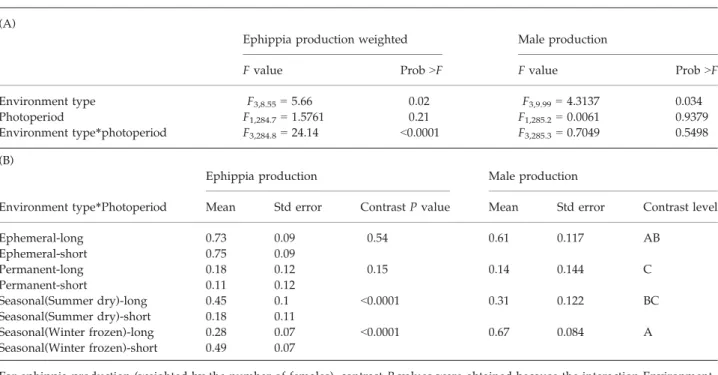
QTL mapping of male production. For the 2007 data, the single-QTL genome scan identified a QTL on linkage Table 1LMM results. (A) LMM results for ephippia (weighted by the number of females) and male production (transformed data).
(B) Table comparing ephippia (weighted by the number of female) and male production (transformed data) as a function of day length. The environment type corresponds to the habitat from which the animals originated (ephemeral, permanent, seasonal sum- mer-dry, seasonal winter-frozen). Treatment corresponds to the increase or decrease of day length
(A)
Ephippia production weighted Male production
Fvalue Prob>F Fvalue Prob>F
Environment type F3,8.55=5.66 0.02 F3,9.99=4.3137 0.034
Photoperiod F1,284.7=1.5761 0.21 F1,285.2=0.0061 0.9379
Environment type*photoperiod F3,284.8=24.14 <0.0001 F3,285.3=0.7049 0.5498 (B)
Ephippia production Male production
Environment type*Photoperiod Mean Std error ContrastPvalue Mean Std error Contrast level
Ephemeral-long 0.73 0.09 0.54 0.61 0.117 AB
Ephemeral-short 0.75 0.09
Permanent-long 0.18 0.12 0.15 0.14 0.144 C
Permanent-short 0.11 0.12
Seasonal(Summer dry)-long 0.45 0.1 <0.0001 0.31 0.122 BC
Seasonal(Summer dry)-short 0.18 0.11
Seasonal(Winter frozen)-long 0.28 0.07 <0.0001 0.67 0.084 A
Seasonal(Winter frozen)-short 0.49 0.07
For ephippia production (weighted by the number of females), contrastP-values were obtained because the interaction Environment type*Photoperiod was significant. For male production, the table displays only the differences in male production per environment because the interaction Environment type*Photoperiod was not significant. Levels not connected by same letter are significantly different.
Ephemeral Permanent Seasonal-summer dry Seasonal-winter frozen
Treatment Treatment Treatment
Short day Low
High
Ephippia/Male production Ephippia production/female Male production
Expected Observed
Long day Short day Long day Short day Long day
(A) (B)
Fig. 2Expected and observed ephippia and male production for increasing (long day) and decreasing (short day) photoperiod per environment type (data not transformed). Vertical bars represent standard errors. (A) Expectation for male and ephippia production (B) Observed production; left: Ephippia production weighted by the number of females; right: Male production, letters indicate the statistical difference (ranking) between each group. Groups sharing letters are not statistically different.
http://doc.rero.ch
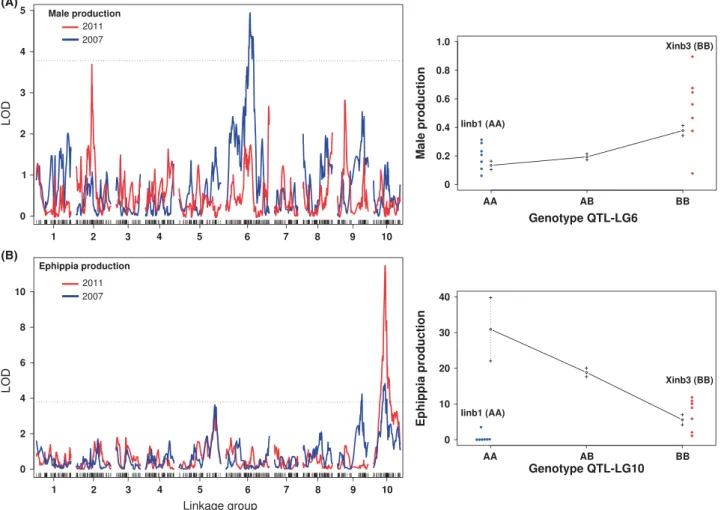
group (LG) 6 (LOD<2007> =4.8, LOD<threshold>=3.8, Fig. 3A), explaining 14.5% of the variance in male pro- duction among the F2 lines. At this locus, the genotype BB produced significantly more males than the geno- types AA (W=391.5,P<0 .0001) and AB (W=2098.5, P=0.0002), while no difference was observed between the genotypes AA and AB (W=1568, P =0.22). The difference in male production between AA and BB genotypes in the F2 was comparable to the difference between the parental lines (Fig. 3A). The two markers most closely associated with the QTL are located 3 cM apart from each other; the BLAST search showed that they are located on two different scaffolds of the cur- rent genome assembly. The two-QTL genome scan anal- ysis identified two additional loci on LGs 1 and 6 that interact with the main QTL on LG6 (Fig. 4). Together with the main QTL, these interactions explain 34% of
the variance in male production among the F2 lines.
An additional peak on LG 2 was identified from data col- lected in 2011 (Fig. 3A). However, as it was only margin- ally significant (LOD<2011> =3.7), this peak was excluded from further analysis.
QTL mapping of ephippia production. In contrast to the data on male production, both experiments on ephippia production were performed using the same design (see Materials and Methods). We therefore considered a QTL significant only if it was confirmed by both data sets. The single-QTL genome scan identified a major QTL for ephippia production on LG10 (Fig. 3B). This QTL (LOD<2007>=4.8, LOD<2011>=11.4, LOD<threshold>=3.8) explains 23.3% of the variance in ephippia production among the F2 lines. However, only three F2 lines had the genotype AA at the marker next to the ephippia (A)
(B)
Fig. 3Quantitative trait locus (QTL) mapping performed with nonparametric method for male and ephippia production. Dashed lines in the left panels represent the LOD threshold for significance; red and black curves represent the experiments performed in 2007 and 2011, respectively. (A) Left: LOD scores for male production; right: LG6 QTL effect in F2 lines on male production. For comparison, the red and blue points represent male production for the parental lines Xinb3 and Iinb1, respectively. (B) Left: LOD curves for ephippia production; right: LG10 QTL effect in F2 lines on ephippia production. For comparison, the red and blue points represent ephippia production for the parental lines Xinb3 and Iinb1, respectively. The data were obtained over seven replicates; each replicate is represented by a dot.
http://doc.rero.ch
production QTL. This was likely due to linkage to a ste- rility locus (responsible for the absence of asexual egg production when homozygous AA) and does not ques- tion the significance of the QTL identified; it did, however, make statistical comparisons of ephippia production between AA and AB or BB genotypes unreliable (genotyping errors were excluded after re- genotyping a subsample of F2 lines). The level of ephip- pia production in the BB F2 lines was comparable to the Finnish parental line Xinb3 (BB genotype). How- ever, the genotype BB produced significantly fewer ep- hippia than the genotype AB (W lines=745, P<0 .0001), which is opposite of what the differences between parental lines would lead one to expect (Fig. 3B). The markers associated with this QTL are sit- uated 1 cM apart from each other; the BLAST search identified a 1.2 Mb scaffold on which they are located.
The two-QTL genome scan identified six loci interacting with the main QTL on LG10 (Fig. 4). Together, the LG10 QTL and these interactions explain 55.5% of the
variance in ephippia production between the F2 lines.
A second potential QTL on LG5 did not surpass the sig- nificance threshold in either data set (Fig. 3B) and was therefore not included in the analysis.
Discussion
Local adaptation of ephippia and male production Species distributed across wide areas with strong habi- tat gradients often harbour variation in fitness-related traits because natural selection favours genotypes adapted to local environments (Kawecki & Ebert 2004;
Kawakami et al. 2011; Keller et al. 2012). In D. magna, ephippia and male production are two of the most strikingly variable traits observed in the field, probably because the timing and intensity of sexual offspring production must be precise. The inability to induce male and ephippia production at the right time would lead to the extinction of the individual’s genotype (Deng 1996). Here, in conducting a laboratory environ- ment, we found that the production of ephippia and males is significantly correlated with water permanency and that ephippia production is also correlated with photoperiodic conditions that indicate the onset of habi- tat deterioration. These findings strongly point to local adaptation for both traits and were consistent with our a priori predictions based on the habitat characteristics of each population (increased production of males/
ephippia in animals from more intermittent populations and under conditions indicating the end of the growing period). These results constitute a new case of adaptive phenotypic plasticity (Beldade et al. 2011), especially concerning ephippia production, because its variation (based on particular environmental cues, such as photo- period here) is adjusted as a function of the natural selective environment (freezing or dryness of the pond).
In addition, male and ephippia production did not respond in the same manner to the photoperiod, sug- gesting that each trait may need different stimuli to reveal its local adaptation. This corresponds with field observations that male production is induced more stochastically—that is, with small peaks of production throughout the population’s planktonic phase in addi- tion to the main peak before habitat deterioration—and is likely to be more sensitive to small environmental variations than ephippia production (Y. Galimov, pers.
comm.). We will conduct further experiments on this issue in the near future, testing the effects of conditions such as temperature, food quality/quantity or popula- tion density on male and ephippia production.
It has long been known that photoperiod affects Daphnia ephippia (Stross & Hill 1965; Stross 1971;
Zhang & Baer 2000; Alekseev & Lampert 2001).
10 20 30 40
0
AA AB BB LG1-125 cM
LG16-25 cM 0.10
0.40
0.20 0.30 0.50 0.60
AA AB BB
AA AB
QTL LG6-115 cM
QTL LG10-56 cM Ephippia production
Male production
BB
AA AB BB
(A)
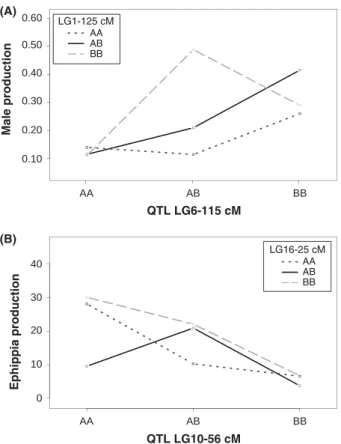
(B)
Fig. 4Plots for male and ephippia production for two of the major interactions among quantitative trait locus (QTLs). (A) Male production: interaction between the main QTL on LG6 and a locus on LG1. (B) Ephippia production: interaction between the main QTL on LG10 and a locus on LG6. The num- ber in the box indicates the linkage group (LG) and the posi- tion on the LG (in cM) of the marker interacting with the main QTL.
http://doc.rero.ch
However, very few studies have explored the induction of diapausing egg production as a part of a comparative analysis between diverse populations. Using 12 popula- tions of Daphnia pulicaria, Caceres & Tessier (2004) showed that optimizing dormancy induction depends on the risk of extinction associated with remaining active.
Our study therefore confirms this work and demon- strates experimentally that populations of D. magna are locally adapted to the environment in the timing of dor- mancy induction. Similar experiments on species with comparable life cycles, for example, copepods, rotifers, aphids, may allow us to devise a general model of local adaptation of sex induction in various habitats and to understand to what degree sex induction is under genetic control. Various biotic and abiotic cues, includ- ing change in photoperiod, are known to induce a switch to resting egg production in these groups, for example, rotifers (Gilbert & Schreiber 1998; Gilbert &
Schr€oder 2004) and aphids (Simon et al. 2002), and given their wide geographic distributions, we speculate that local adaptation is also likely in these taxa.
Genetic bases of ephippia and male production
The genetic basis of local adaptation has been explored in diverse organisms, and studies have shown that mutations as well as chromosome rearrangements and polymorphic insertion of transposable elements are involved in this evolutionary process (Michalak et al.
2001; Nachman et al. 2003; Korol et al. 2006; Lowry &
Willis 2010; Manceauet al. 2011). However, despite the growing evidence for local adaptation in many natural populations, examples that fully illustrate how adaption works at the genetic level remain scarce. Our analysis, based on the genotyping of 1324 SNPs in 180 F2 lines obtained by crossing parent clones from diverse pond environments, allowed us to identify one major QTL responsible for differential male production. Genetic variance in sex ratio has been studied for many years and in many species such as fruit flies (Toro & Charles- worth 1982), turtles (Janzen 1992), aphids (Rispe et al.
1998) and pigs (Toro et al. 2006). Surprisingly, even though QTL analyses are now routinely performed, and the number of sequenced genomes is growing rapidly, only one other study, on the wasp Nasonia vitripennis, clearly identified a locus responsible for sex ratio varia- tion (Pannebakker et al. 2011). However, this QTL explained only a minor portion of the phenotypic vari- ance, suggesting that a complex mechanism triggered by many genes is involved in male production. Our study, on the other hand, showed that a relatively large portion of variance in male production (14.5%) is explained by the QTL on LG6, suggesting that we have identified a major genomic region involved in that trait.
The fact that we did not obtain a peak at the same posi- tion twice with the data from 2007 to 2011 (~150 genera- tions) could suggest that some mutations or unnoticed hatching occurred in our collection. Although we can- not rule out such a possibility as we do not have genetic data for both time points, it seems unlikely, however, that a large number of mutations could accu- mulate in such a small time frame. In addition, it is unlikely that there were unnoticed hatchings, because ephippia need either conditions of prolonged coldness in the dark for diapause or a period of complete drying, both of which were eliminated in the laboratory condi- tions of the F2 clones. Therefore, the difference observed between the QTL mapping from 2007 to 2011 is most likely due to the fact that we used two different setups for the experiments.
In addition, our study represents the first example of a QTL involved in resting egg production, even though other well-studied organisms such as aphids (Moran 1992), rotifers (Gilbert & Schreiber 1998), copepods (Carlisle & Pitman 1961; Hairston et al. 1995), insects (Mousseau & Roff 1989) or others Daphnia species (Stross 1971; Alekseev & Lampert 2001; Caceres &
Tessier 2004) exhibit resting egg stages. Twenty-three per cent of the variance in ephippia production among the F2 lines is explained by the QTL on LG10, implying a large role for that genomic region. We found that male and ephippia production are controlled by distinct geno- mic regions (LG6 for male production, LG10 for ephippia production). Together, these findings imply that induc- tion of these traits could have co-evolved to be synchro- nized in time and intensity at the population level.
Surprisingly, we observed an increase of ephippia production in the AA and AB F2 lines compared with their parental lines. This is contrary to our expectation based on the phenotypes of the two parents. However, at this locus, only three F2 lines carrying the genotype AA were found, while (180/4=) 45 were expected. This strongly suggests that our locus of interest is located close to a locus with a recessive deleterious allele.
Indeed, a locus of infertility carried by the German parental line Iinb1 has been described and is known to prevent asexual egg production (Routtu et al. 2010).
Homozygous F2 lines at that locus cannot, thus, be propagated. The German parental clone Iinb1 is hetero- zygous at that locus (and likely for a larger genomic area), because it does not show reduced fecundity. This corresponds with the fact the Inb1 could only be self- crossed once (while Ximb3 could be self-crossed three times) and is therefore most likely heterozygous at many loci. We propose a genetic model based on the idea that the German parent clone is heterozygous at the ephippia production locus to explain the unex- pected phenotypes of the AA F2 lines (Fig. 5). As one
http://doc.rero.ch
allele causes very low ephippia production in the parent clone (A ), and the other causes high ephippia produc- tion (A++), the end result is an average low ephippia production for this clone (the low production locus may even be dominant). The F1 clone inherited the sterility allele and the A++ allele (Fig. 5). Homozygotes for A++
are rare because of the closely linked sterility allele, and if they exist, they have a high ephippia production.
Heterozygosity at the ephippia production locus corre- sponds with our first experiment on natural popula- tions, where we observed variation in ephippia production within populations (Fig. S1, Supporting information).
Our analysis also revealed the importance of epistasis in both male and ephippia production. Epistasis, which can be defined as the dependence of a mutation effect on a trait at one locus on the genotype at another locus (Zwarts et al. 2011), has been extensively studied and found in various organisms (for review, see Lehner 2011). We identified several loci that interact with the main QTL both for male and ephippia production.
Together with the main QTL, these interactions explained 34% and 55.5% of the variance between F2 lines for male and ephippia production, respectively.
For example, homozygotes at the additional locus on LG1 (genotype BB at position 125 cM) exhibit a twofold increase in male production, while heterozygotes at the additional locus on LG6 (genotype AB at position 25 cM) exhibit a more than twofold reduction in ephip- pia production. This might reflect that, as with most quantitative traits, ephippia and male production are affected by the complex inheritance of various alleles at different loci (Bremet al.2005; Zwartset al.2011). How- ever, QTL mapping is believed to alter gene frequencies and artificially increase the chance of finding epistasis (Hall & Ebert, submitted). These interactions therefore need to be explored in the context of a single natural population before estimating the part of the variation they explain in the wild.
Conclusion
Our work demonstrates that the induction of males and resting eggs is locally adapted and genetically deter- mined in Daphnia. As some of the populations studied here are relatively young (since the last ice-age), local adaptation must have evolved only recently. As gene flow is common in EuropeanD. magna populations (De Gelas & De Meester 2005), selection for local adaptation must be strong. Given that our traits are mainly explained by major QTLs in two relatively small geno- mic regions, one might speculate that male and ephip- pia production adapted rapidly through the evolution of major gene factors rather than through many small effects. Furthermore, consistent with earlier reports (Yam- polsky 1992), we found strong within-population varia- tion for both traits, suggesting that selection can act rapidly on changing mean trait expression in a popula- tion. As a next step in this research project, conducting whole genome association studies on natural popula- tions should allow us to narrow the genomic regions of interest and to identify candidate genes.
Acknowledgements
This work was supported by the EUROCORES programme of the European Science Foundation (grant StressFlea) and Fig. 5Model of allele inheritance for ephippia production in
the F2.+and indicate the level of ephippia production, from low ( ) to high (++). The parental line Iinb1 is heterozygous at the ephippia production locus and harbours two alleles A++
(responsible for high ephippia production) and A (low ephip- pia production) resulting in a low production of ephippia in clone Iinb1. Only the allele A++is transmitted to the F1 and F2 lines. Next to the ephippia locus is a sterility locus, S, with two alleles in Iinb1. S is the dominant wildtype; s is a recessive allele causing complete sterility when homozygous. The haplo- type s_ A++was transmitted to the F1 clone, and one quarter of the F2 clones are sterile (Routtuet al. 2010). Only three of 200 F2 clones showed recombination between the sterility locus and the ephippia locus. The A++A++genotype produces many ephippia. The A++B+ genotype produces ephippia at a higher rate than the B+B+genotype. The B+B+F2 lines have the same level of production as the parental line Xinb3.
http://doc.rero.ch
the Swiss National Science Foundation. We thank Melanie Clerc and Tobias Sch€ar for their help in phenotyping and J€urgen Hottinger for laboratory support. We also thank the three anonymous reviewers for their comments on the manu- script.
References
Alekseev VR, Lajus DL (2009) Maternal and direct effects of natural-like changes of photoperiod and food condition manipulation on life history parameters inDaphnia. Aquatic Ecology,43, 415–421.
Alekseev V, Lampert W (2001) Maternal control of resting-egg production inDaphnia.Nature,414, 899–901.
Altermatt F, Ebert D (2008) The influence of pool volume and summer desiccation on the production of the resting and dis- persal stage in a Daphnia metapopulation. Oecologia, 157, 441–452.
Altermatt F, Pajunen V, Ebert D (2009) Desiccation of rock pool habitats and its influence on population persistence in a Daphnia metacommunity.PLoS One,4, e4703.
Altschul SF, Gish W, Miller W, Myers EW, Lipman DJ (1990) Basic local alignment search tool.Journal of Molecular Biology, 215, 403–410.
Baer KN, McCoole MD, Overturf MD (2009) Modulation of sex ratios in Daphnia magna following multigenerational expo- sure to sewage treatment plant effluents. Ecotoxicology and Environmental Safety,72, 1545–1550.
Barrett RD, Hoekstra HE (2011) Molecular spandrels: tests of adaptation at the genetic level. Nature Review Genetics, 12, 767–780.
Beldade P, Mateus AR, Keller RA (2011) Evolution and molec- ular mechanisms of adaptive developmental plasticity.
Molecular Ecology,20, 1347–1363.
Brem RB, Storey JD, Whittle J, Kruglyak L (2005) Genetic inter- actions between polymorphisms that affect gene expression in yeast.Nature,436, 701–703.
Broman KW, Wu H, Sen S, Churchill GA (2003) R/qtl: QTL mapping in experimental crosses.Bioinformatics,19, 889–890.
Caceres CE (1997) Dormancy in invertebrates.Invertebrate Biol- ogy,116, 371–383.
Caceres CE, Tessier AJ (2004) Incidence of diapause varies among populations of Daphnia pulicaria. Oecologia, 141, 425–431.
Campillo S, Garcıa-Roger EM, Carmona MJ, Serra M (2011) Local adaptation in rotifer populations.Evolutionary Ecology, 25, 933–947.
Carlisle DB, Pitman WJ (1961) Diapause, neurosecretion and hormones in Copepoda.Nature,190, 827–828.
De Gelas K, De Meester L (2005) Phylogeography ofDaphnia magnain Europe.Molecular Ecology,14, 753–764.
Decaestecker E, De Meester L, Ebert D (2002) In deep trouble:
habitat selection constrained by multiple enemies in zoo- plankton. Proceedings of the National Academy of Sciences, 99, 5481–5485.
DeMeester L, Vanoverbeke J (1999) An uncoupling of male and sexual egg production leads to reduced inbreeding in the cyclical parthenogenDaphnia.Proceedings of the Royal Society B: Biological Sciences,266, 2471–2477.
Deng HW (1996) Environmental and genetic control of sexual reproduction inDaphnia.Heredity,76, 449–458.
Denlinger DL (2002) Regulation od diapause.Annual Review of Entomology,47, 93–122.
Ebert D (2005) Ecology, Epidemiology, and Evolution of Para- sitism in Daphnia (internet), Bethesda (ed). Available from http://www.ncbi.nlm.nih.gov/entrez/query.fcgi?db=Books).
Emerson KJ, Bradshaw WE, Holzapfel CM (2009) Complica- tions of complexity: integrating environmental, genetic and hormonal control of insect diapause. Trends in Genetics, 25, 217–225.
Evans MEK, Dennehy JJ (2005) Germ banking: bet-hedging and variable release from egg and seed dormancy.The Quarterly Review of Biology,80, 431–451.
Fielenbach N, Antebi A (2008)C. elegans dauer formation and the molecular basis of plasticity.Genes and Development, 22, 2149–2165.
Galimov Y, Walser B, Haag CR (2011) Frequency and inheri- tance of non-male producing clones inDaphnia magna: evolu- tion towards sex specialization in a cyclical parthenogen?
Journal of Evolutionary Biology,24, 1572–1583.
Gilbert JJ, Schreiber DK (1998) Asexual diapause induced by food limitation in the rotiferSynchaeta pectinata. Ecology,79, 1371–1381.
Gilbert JJ, Schr€oder T (2004) Rotifers from diapausing, fertilized eggs : unique features and emergence. Limnology, 49, 1341–1354.
Haeba MH, Hilscherova K, Mazurova E, Blaha L (2008) Moni- toring and fate of persistent chemicals selected endocrine disrupting compounds (vinclozolin, flutamide, ketoconazole and dicofol): effects on survival, occurrence of males, growth, molting and reproduction of Daphnia magna. Envi- ronmental Chemistry,15, 222–227.
Hairston NG, Olds EJ (1984) Population differences in the tim- ing of diapause: adaptation in a spatially heterogeneous environment.Oecologia,61, 42–48.
Hairston NG, Van Brunt RA, Kearns CM, Engstrom DR (1995) Age and survivorship of diapausing eggs in a sediment egg bank.Ecology,76, 1706–1711.
Harvey SC, Shorto A, Viney ME (2008) Quantitative genetic analysis of life-history traits of Caenorhabditis elegans in stressful environments.BMC Evolutionary Biology,8, 15.
Hebert PDN (1974) Ecological differences between genotypes in a natural population of Daphnia magna. Heredity, 33, 327–337.
Hereford J (2009) A quantitative survey of local adaptation and fitness trade-offs.The American Naturalist,173, 579–588.
Janzen FJ (1992) Heritable variation for sex ratio under envi- ronmental sex determination in the common snapping turtle (Chelydra serpentina).Genetics,131, 155–161.
Kawakami T, Morgan TJ, Nippert JBet al.(2011) Natural selec- tion drives clinal life history patterns in the perennial sun- flower species,Helianthus maximiliani. Molecular Ecology, 20, 2318–2328.
Kawecki TJ, Ebert D (2004) Conceptual issues in local adapta- tion.Ecology Letters,7, 1225–1241.
Keller SR, Levsen N, Olson MS, Tiffin P (2012) Local adapta- tion in the flowering-time gene network of Balsam Poplar, Populus balsamifera L. Molecular Biology and Evolution, 29, 3143–3152.
Kluttgen B, Dulmer U, Engels M, Ratte HT (1994) ADaM, an artificial fresh-water for the culture of zooplankton. Water Research,28, 743–746.
http://doc.rero.ch
Koch U, Von Elert E, Straile D (2009) Food quality triggers the reproductive mode in the cyclical parthenogen Daphnia (Cladocera).Oecologia,159, 317–324.
Korol A, Rashkovetsky E, Iliadi K, Nevo E (2006) Drosophila flies in “Evolution Canyon” as a model for incipient sympat- ric speciation. Proceedings of the National Academy of Sciences of the United States of America,103, 18184–18189.
Le Corre V, Kremer A (2012) The genetic differentiation at quantitative trait loci under local adaptation.Molecular Ecol- ogy,21, 1548–1566.
Lehner B (2011) Molecular mechanisms of epistasis within and between genes.Trends in Genetics,27, 323–331.
Lowry DB, Willis JH (2010) A widespread chromosomal inver- sion polymorphism contributes to a major life-history transi- tion, local adaptation, and reproductive isolation. PLoS Biology,8, e1000500.
Manceau M, Domingues VS, Mallarino R, Hoekstra HE (2011) The developmental role of Agouti in color pattern evolution.
Science,331, 1062–1065.
Mathias D, Jacky L, Bradshaw WE, Holzapfel CM (2007) Quan- titative trait loci associated with photoperiodic response and stage of diapause in the pitcher-plant mosquito, Wyeomyia smithii.Genetics,176, 391–402.
Merila J, Crnokrak P (2001) Comparison of genetic differentia- tion at marker loci and quantitative traits. Science, 14, 892–903.
Michalak P, Minkov I, Helin A et al. (2001) Genetic evidence for adaptation-driven incipient speciation of Drosophila melanogaster along a microclimatic contrast in
“Evolution Canyon”, Israel. Proceedings of the National Academy of Sciences of the United States of America, 98, 13195–13200.
Moran NA (1992) The evolution of aphid life. Ecology, 37, 176–179.
Morjan CL, Rieseberg L (2004) How species evolve collectively:
implications of gene flow and selection for the spread of advantageous alleles. Molecular Biology of the Cell, 13, 1341–1356.
Mousseau TA, Roff DA (1989) Adaptation to seasonality in a cricket: patterns of phenotypic and genotypic variation in body size and diapause expression along a cline in season length.Evolution,43, 1483–1496.
Nachman MW, Hoekstra HE, D‘Agostino SL (2003) The genetic basis of adaptive melanism in pocket mice.Proceedings of the National Academy of Sciences of the United States of America, 100, 5268–5273.
Oda S, Tatarazako N, Watanabe H, Morita M, Iguchi T (2006) Genetic differences in the production of male neonates in Daphnia magnaexposed to juvenile hormone analogs.Chemo- sphere,63, 1477–1484.
Oleksyk TK, Smith MW, O’Brien SJ (2010) Genome-wide scans for footprints of natural selection.Philosophical Transactions of the Royal Society,365, 185–205.
Pannebakker BA, Watt R, Knott SA, West S, Shuker DM (2011) The quantitative genetic basis of sex ratio variation inNaso- nia vitripennis: a QTL study. Journal of Evolutionary Biology, 24, 12–22.
R Development Core Team (2005)R: A Language and Environ- ment for Statistical Computing, Reference Index Version 2.2.1. R Foundation for Statistical Computing, Vienna, Austria. ISBN 3-900051-07-0.
Rispe C, Hulle M, Gauthier JP, Pierre JS, Harrington R (1998) Effect of climate on the proportion of males in the autumn flight of the aphidRhopalosiphum padi L. (Hom., Aphididae).
Journal of Applied Entomology,122, 129–136.
Roth O, Ebert D, Vizoso DB, Bieger A, Lass S (2008) Male- biased sex-ratio distortion caused byOctosporea bayeri, a ver- tically and horizontally-transmitted parasite of Daphnia magna.International Journal for Parasitology,38, 969–979.
Routtu J, Jansen B, Colson I, De Meester L, Ebert D (2010) The first-generationDaphnia magnalinkage map. BMC Genomics, 11, 508.
Sandrock C, Razmjou J, Vorburger C (2011) Climate effects on life cycle variation and population genetic architecture of the black bean aphid, Aphis fabae. Molecular Ecology, 20, 4165–4181.
Sanford E, Kelly MW (2011) Local adaptation in marine inver- tebrates.Annual Review of Marine Science,3, 509–535.
Simon JC, Rispe C, Sunnucks P (2002) Ecology and evolution of sex in aphids.Trends in Ecology and Evolution,17, 34–39.
Smith HA, Snell T (2012) Rapid evolution of sex frequency and dormancy as hydroperiod adaptations.Journal of Evolutionary Biology,25, 2501–2510.
Stehlik J, Zavodska R, Shimada Ket al. (2008) Photoperiodic induction of diapause requires regulated transcription of timeless in the larval brain of Chymomyza costata. Journal of Biological Rhythms,23, 129–139.
Stelzer CP, Schmidt J, Wiedlroither A, Riss S (2010) Loss of sexual reproduction and dwarfing in a small metazoan.PLoS One,5, e12854.
St€ocklin J, Fischer M (1999) Plants with longer-lived seeds have lower local extinction rates in grassland remnants 1950–1985.
Oecologia,120, 539–543.
Stross RG (1971) Photoperiod control of diapause indaphnia.
Light and CO2 sensitive phases within the cycle of activa- tion.The Biological Bulletin,140, 137–155.
Stross RG, Hill JC (1965) Diapause induction in Daphnia requires two stimuli.Science,150, 1462–1464.
Syrova Z, Dolezel D, Saumann I, Hodkova M (2003) Photoperi- odic regulation of diapause in linden bugs: are period and Clock genes involved?Cellular and Molecular Life Sciences,60, 2510–2515.
Tapia H, Morano KA (2010) Hsp90 nuclear accumulation in quiescence is linked to chaperone function and spore devel- opment in yeast.Molecular Biology of the Cell,21, 63–72.
Toro MA, Charlesworth B (1982) An attempt to detect genetic variation in sex ratio inDrosophila melanogaster.Heredity,49, 199–209.
Toro MA, Fernandez A, Garcıa-Cortes LA, Rodriga~nez J, Silio L (2006) Sex ratio variation in Iberian pigs. Genetics, 173, 911–917.
Yampolsky LY (1992) Genetic variation in the sexual reproduc- tion rate within a population of a cyclic parthenogen,Daph- nia magna.Evolution,46, 833–837.
Zhang L, Baer KN (2000) The influence of feeding, photoperiod and selected solvents on the reproductive strategies of the water flea, Daphnia magna. Environmental Pollution, 110, 425–430.
Zwarts L, Magwire MM, Carbone MA (2011) Complex genetic architecture of Drosophila aggressive behavior.Proceedings of the National Academy of Sciences of the United States of America, 108, 17070–17075.
http://doc.rero.ch
A.R. designed the experiments, performed research, analysed the data and wrote the article; J.R. contributed analytical tools; M.H. performed the statistical analysis;
T.J. performed research; I.C. performed research (data 2007); C.H. designed the experiment and wrote the arti- cle; D.E. designed the experiment and wrote the article.
Data accessibility
Raw data for ephippia and male production have been uploaded as online supporting information (Table S1, Supporting information). Information about the sam-
pling locality can be found in the supporting informa- tion (Table S2, Supporting information). SNP data are archived on Dryad (doi:10.5061/dryad.s5p7j).
Supporting information
Additional supporting information may be found in the online version of this article.
Table S1Raw results of male/ephippia production in natural population per clone (final count).
Table S2Population information and coordinates.
Fig. S1 Ephippia production per clone weighted by the number of females