Publisher’s version / Version de l'éditeur:
Vous avez des questions? Nous pouvons vous aider. Pour communiquer directement avec un auteur, consultez la première page de la revue dans laquelle son article a été publié afin de trouver ses coordonnées. Si vous n’arrivez pas à les repérer, communiquez avec nous à PublicationsArchive-ArchivesPublications@nrc-cnrc.gc.ca.
Questions? Contact the NRC Publications Archive team at
PublicationsArchive-ArchivesPublications@nrc-cnrc.gc.ca. If you wish to email the authors directly, please see the first page of the publication for their contact information.
https://publications-cnrc.canada.ca/fra/droits
L’accès à ce site Web et l’utilisation de son contenu sont assujettis aux conditions présentées dans le site LISEZ CES CONDITIONS ATTENTIVEMENT AVANT D’UTILISER CE SITE WEB.
Client Report (National Research Council of Canada. Construction), 2016-01-08
READ THESE TERMS AND CONDITIONS CAREFULLY BEFORE USING THIS WEBSITE.
https://nrc-publications.canada.ca/eng/copyright
NRC Publications Archive Record / Notice des Archives des publications du CNRC :
https://nrc-publications.canada.ca/eng/view/object/?id=a5145de5-8eb1-425e-a793-abbd70ca2fb5 https://publications-cnrc.canada.ca/fra/voir/objet/?id=a5145de5-8eb1-425e-a793-abbd70ca2fb5
NRC Publications Archive
Archives des publications du CNRC
For the publisher’s version, please access the DOI link below./ Pour consulter la version de l’éditeur, utilisez le lien DOI ci-dessous.
https://doi.org/10.4224/23002860
Access and use of this website and the material on it are subject to the Terms and Conditions set forth at
Evaluation of thermal and moisture response of highly insulated
wood-frame wall assemblies, phase 1: Part II: numerical modelling
Construction
Evaluation of Thermal and Moisture
Response of Highly Insulated
Wood-Frame Wall Assemblies
― Phase 1
Part II: Numerical Modelling
Report A1-000444.4
Hamed H. Saber and G. Ganapathy
EVALUATION OF THERMAL AND MOISTURE RESPONSE OF HIGHLY INSULATED WOOD-FRAME WALL ASSEMBLIES ―
PHASE 1,PART II:NUMERICAL MODELLING
REPORT A1-000444.4 i
Table of Contents
1. Introduction ... 1 2. Project Overview ... 3 3. Model Benchmarking ... 3 3.1 Wall Specimens ... 43.2 Transient Numerical Simulations ... 5
3.2.1 Assumptions ... 5
3.2.2 Initial and Boundary Conditions ... 5
3.5 Comparison between Model Predictions and Measurements ...10
3.6 Wall Assembly Configurations and Simulation Parameters ...14
4. Simulation Conditions for Parametric Study ...18
4.1 Vapour Barrier Conditions ...18
4.2 Air Leakage Conditions ...18
4.3 Approach to Simulation of Air Leakage ...19
4.4 Climatic Conditions ...21 4.5 Weather Data ...21 4.7 Indoor Conditions ...21 4.8 Initial Conditions ...22 4.9 Material Properties ...23 5. Acceptable Performance ...23
6. Approach for Assessing the Overall Performance ...25
7. Results and Discussion ...29
7.1 Effect Air Leakage Rate ...29
7.2 Effect of Inboard and Outboard Insulations ...30
7.3 Effect of Geographical Locations ...34
8. Summary of Simulation Results for different Walls ...36
8.1 Edmonton, AB ...36
8.2 Ottawa, ON ...36
EVALUATION OF THERMAL AND MOISTURE RESPONSE OF HIGHLY INSULATED WOOD-FRAME WALL ASSEMBLIES ―
PHASE 1,PART II:NUMERICAL MODELLING
REPORT A1-000444.4 ii 8.4 Yellowknife, NT...36 8.5 St John’s, NL ...37 9. Concluding Remarks ...37 10. References...42 Appendix ...47
A1 Description of Numerical Simulation model – hygIRC-C ...47
A1.1 Record of Benchmarking hygIRC-C Model ...47
Appendix – A2: Air leakage rates of different geographical locations ...50
Appendix – A3: Mould index of different wall systems ...55
EVALUATION OF THERMAL AND MOISTURE RESPONSE OF HIGHLY INSULATED WOOD-FRAME WALL ASSEMBLIES ―
PHASE 1,PART II:NUMERICAL MODELLING
REPORT A1-000444.4 iii
List of Figures
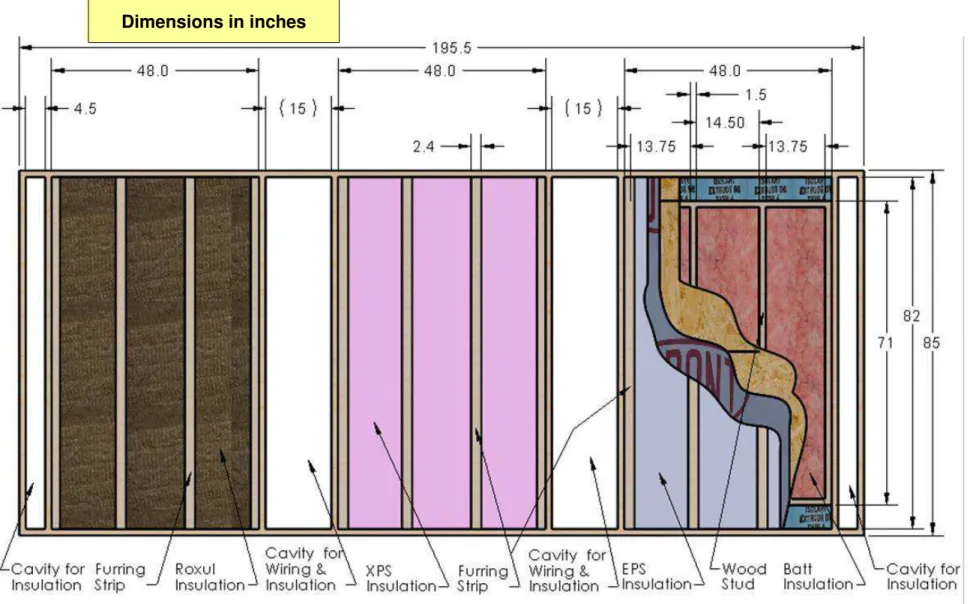
Figure 1. Schematic of three residential 38 mm x 140 mm (2 x 6 in.) wood-frame wall test specimens installed
side-by-side in the FEWF ... 6
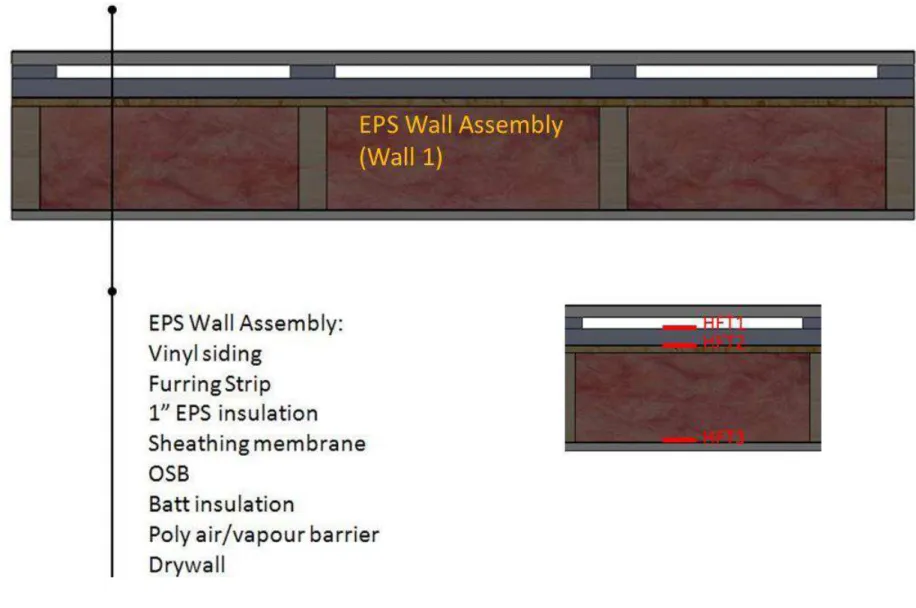
Figure 2. Horizontal cross-section through EPS wall assembly showing locations of Heat Flux Transducers, HFTs (Wall 1) ... 7
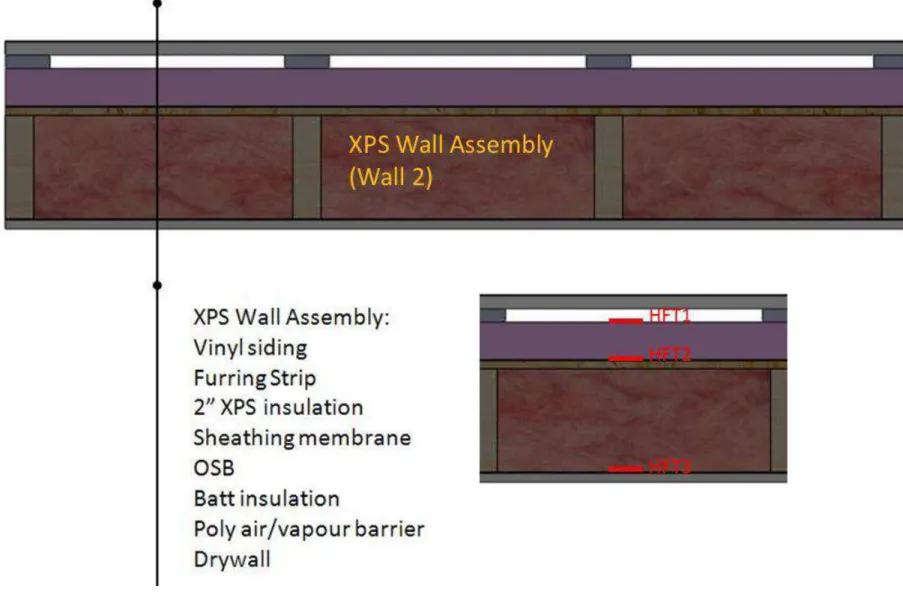
Figure 3. Horizontal cross-section through XPS wall assembly showing locations of Heat Flux Transducers, HFTs (Wall 2) ... 8
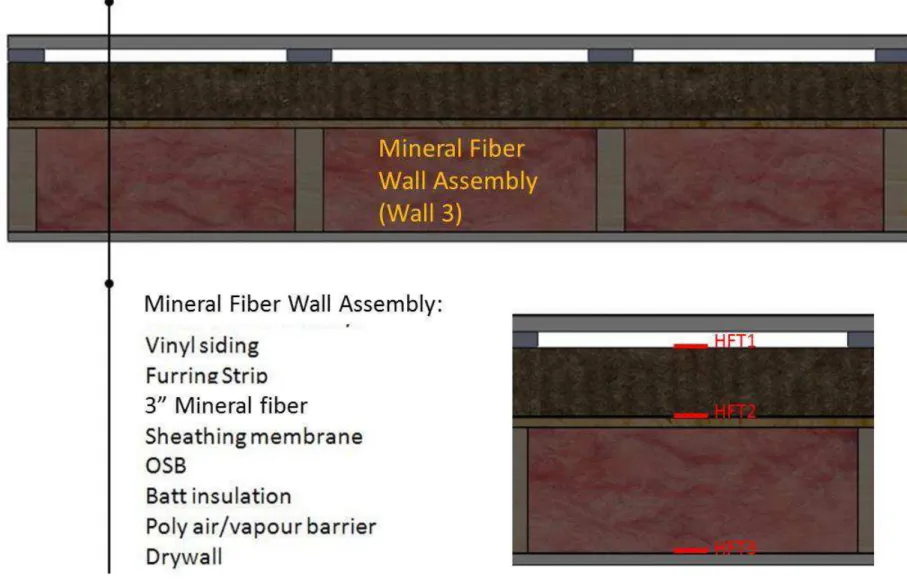
Figure 4. Horizontal cross-section through mineral fibre wall assembly showing locations of Heat Flux Transducers, HFTs (Wall 3) ... 9
Figure 5. EPS wall (Wall 1) ─ Comparison between predicted and measured heat fluxes at interface: (i) airspace – EPS; (ii) EPS – OSB; (iii) poly – gypsum ... 11
Figure 6. XPS wall (Wall 2) ─ Comparison between predicted and measured heat fluxes at interface: (i) airspace – XPS; (ii) XPS-OSB; (iii) poly-gypsum ... 12
Figure 7. Mineral fibre wall (Wall 3) ─ Comparison between predicted and measured heat fluxes at airspace interface: (i) airspace – mineral fibre; (ii) mineral fibre – OSB; (iii) poly-gypsum ... 13
Figure 8. Schematic of reference wall assembly/code compliant configuration showing different component layers and assumed path of air flow through assembly (no exterior insulation) ... 15
Figure 9. Schematic of wall assembly configurations with exterior insulations showing different component layers and assumed path of air flow through assembly ... 16
Figure 10. Exfiltration: Average yearly negative wind pressure in Pa (wet year of Ottawa weather) ... 20
Figure 11. Hourly wind pressure of wall facing south (wet year of Ottawa weather) ... 20
Figure 12. Different options for indoor relative humidity (Ottawa weather)... 22
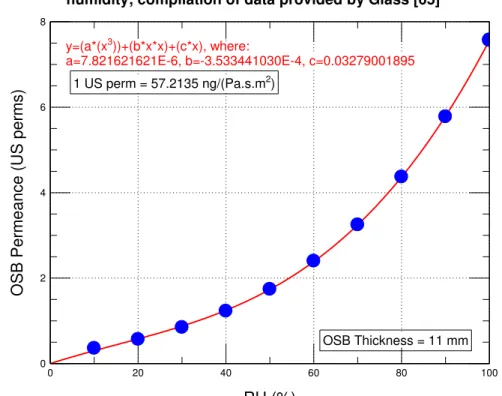
Figure 13. Dependence of water vapor permeance (WVP) of OSB of 11 mm thick on the relative humidity; compilation of data provided by Glass [65] ... 24
Figure 14. WVP of OSB of 11 mm thick that used in numerical simulations ... 24
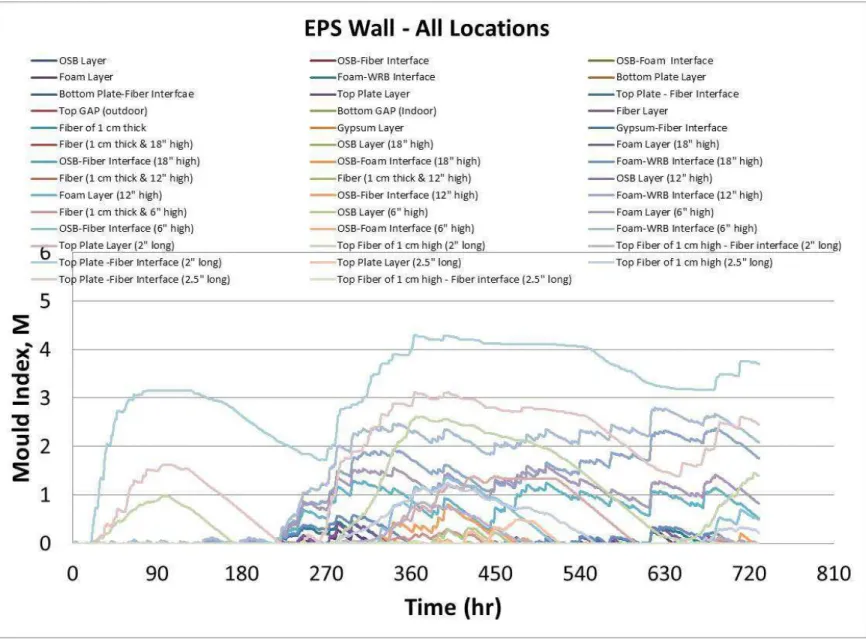
Figure 15. Mould index at different locations inside the EPS wall for the case of 100% air leakage rate (Ottawa weather) ... 27
Figure 16. Locations in wall assembly at risk of formation of condensation and mould growth: (a) Location at top plate and in the top plate, the insulation, and along interface between top plate and insulation layers; (b) at base plate of wall assembly in insulation and along interface between sheathing panel and insulation (see Table 9) ... 28
Figure 17. EPS wall - Effect of air leakage rate on overall maximum and average mould index ... 31
Figure 18. XPS wall - Effect of air leakage rate on overall maximum and average mould index ... 31
Figure 19. Mineral fibre wall - Effect of air leakage rate on overall maximum and average mould index ... 31
Figure 20. Effect of stud-cavity insulation on the overall maximum and average mould index at 100% air leakage rate (Edmonton weather) ... 33
Figure 21. Effect of stud-cavity insulation on the yearly heat loss at 100% air leakage rate (Edmonton weather) 33 Figure 22. Effect of stud-cavity insulation on the yearly heat gain at 100% air leakage rate (Edmonton weather) ... 33
Figure 23. Effect of geographical locations on the overall maximum and average mould index at 100% air leakage rate ... 35
EVALUATION OF THERMAL AND MOISTURE RESPONSE OF HIGHLY INSULATED WOOD-FRAME WALL ASSEMBLIES ―
PHASE 1,PART II:NUMERICAL MODELLING
REPORT A1-000444.4 iv
Figure 24. Effect of R-value and WVP on the overall maximum and average mould index at 100% air leakage rate (Edmonton weather) ... 38 Figure 25. Effect of R-value and WVP on the overall maximum and average mould index at 100% air leakage rate (Ottawa weather) ... 38 Figure 26. Effect of R-value and WVP on the overall maximum and average mould index at 100% air leakage rate (Vancouver weather) ... 39 Figure 27. Effect of R-value and WVP on the overall maximum and average mould index at 100% air leakage rate (Yellowknife weather) ... 39 Figure 28. Effect of R-value and WVP on the overall maximum and average mould index at 100% air leakage rate St John’s eather ... 40
EVALUATION OF THERMAL AND MOISTURE RESPONSE OF HIGHLY INSULATED WOOD-FRAME WALL ASSEMBLIES ―
PHASE 1,PART II:NUMERICAL MODELLING
REPORT A1-000444.4 v
List of Figures of Appendix – A
Figure A - 1 Air leakage rate due to exfiltration and infiltration of Ottawa weather ... 50
Figure A - 2. Air leakage rate due to exfiltration and infiltration of Edmonton weather... 51
Figure A - 3. Air leakage rate due to exfiltration and infiltration of Vancouver weather ... 52
Figure A - 4. Air leakage rate due to exfiltration and infiltration of St John’s eather ... 53
Figure A - 5. Air leakage rate due to exfiltration and infiltration of Yellowknife weather ... 54
Figure A - 6. Mould index at different locations inside the reference wall for the case of 100% air leakage rate (Ottawa weather) ... 55
Figure A - 7. Mould index at different locations inside the XPS wall for the case of 100% air leakage rate (Ottawa weather) ... 56
Figure A - 8. Mould index at different locations inside the mineral fibre wall for the case of 100% air leakage rate (Ottawa weather) ... 57
Figure A - 9. Effect of exterior insulation on the yearly heat loss and heat gain of wall systems with R-24 stud-cavity at 100% air leakage rate (Edmonton weather) ... 58
Figure A - 10. Effect of exterior insulation on the yearly heat loss and heat gain of wall systems with R-24 stud-cavity at 100% air leakage rate (Ottawa weather) ... 59
Figure A - 11. Effect of exterior insulation on the yearly heat loss and heat gain of wall systems with R-24 stud-cavity at 100% air leakage rate (Vancouver weather) ... 60
Figure A - 12. Effect of exterior insulation on the yearly heat loss and heat gain of wall systems with R-24 stud-ca ity at % air leakage rate St John’s eather ... 61
Figure A - 13. Effect of exterior insulation on the yearly heat loss and heat gain of wall systems with R-24 stud-cavity at 100% air leakage rate (Yellowknife weather) ... 62
EVALUATION OF THERMAL AND MOISTURE RESPONSE OF HIGHLY INSULATED WOOD-FRAME WALL ASSEMBLIES ―
PHASE 1,PART II:NUMERICAL MODELLING
EVALUATION OF THERMAL AND MOISTURE RESPONSE OF HIGHLY INSULATED WOOD-FRAME WALL ASSEMBLIES ―
PHASE 1,PART II:NUMERICAL MODELLING
REPORT A1-000444.4 vii
List of Tables
Table 1. Descriptions of walls for Phase-1 and Phase-2 (Yr 2013-2015)* ... 4
Table 2. Construction details common to all wall assemblies to be modelled ... 14
Table 3. Wood framed (2 x 6-in.) wall systems with exterior insulations ... 17
Table 4. Locations in wall assembly at risk of condensation and mould growth ... 17
Table 5. Summary of simulated conditions ... 23
Table 6. Description of Mould Index (M) levels [66, 67, 68] ... 25
Table 7. Mould growth sensitivity classes and some corresponding materials [68] ... 25
Table 8. Mould growth sensitivity classes for materials of wall assemblies listed in Table 3 ... 25
EVALUATION OF THERMAL AND MOISTURE RESPONSE OF HIGHLY INSULATED WOOD-FRAME WALL ASSEMBLIES ―
PHASE 1,PART II:NUMERICAL MODELLING
EVALUATION OF THERMAL AND MOISTURE RESPONSE OF HIGHLY INSULATED WOOD-FRAME WALL ASSEMBLIES ―
PHASE 1,PART II:NUMERICAL MODELLING
REPORT A1-000444.4 ix
Acknowledgements
The authors wish to thank Canada Mortgage and Housing Corporation (CMHC) and Natural Resources Canada (NRCan) for contributing funding for this project. The authors wish to thank the Project Advisory Committee that included: Constance Thivierge (formerly with FP
Innovations), Doug Tarry (Doug Tarry Homes), Rick Gratton (CHBA), Christopher McLellan (CHBA), Chris Mattock (Habitat Design and Consulting), Salvatore Ciarlo (Owens Corning Canada) and Robert Jonkman (Canadian Wood Council). Also, the authors wish to thank NRC-Construction for providing the funding to enable researchers to build, operate and maintain a state-of-the-art Field Exposure of Walls Facility (FEWF) that was used in this project.
EVALUATION OF THERMAL AND MOISTURE RESPONSE OF HIGHLY INSULATED WOOD-FRAME WALL ASSEMBLIES ―
PHASE 1,PART II:NUMERICAL MODELLING
EVALUATION OF THERMAL AND MOISTURE RESPONSE OF HIGHLY INSULATED WOOD-FRAME WALL ASSEMBLIES ―
PHASE 1,PART II:NUMERICAL MODELLING
REPORT A1-000444.4 xi
Executive Summary
The National Research Council of Canada (NRC) has undertaken field monitoring and computer modelling to investigate the risk of condensation in wall assemblies having different combinations of increased thermal resistance (R-value) of cavity insulation and of selected exterior insulation products. The field monitoring of residential 38 mm x 140 mm (2 x 6 in) wood-frame wall systems that had been constructed using different types of exterior insulation products were undertaken at the Field Exposure of Walls Facility (FEWF) of NRC-Construction, located in Ottawa; the primary intent was to investigate the risk of condensation and mould growth in three mid-scale (1219 mm x 1829 mm / 4 ft. x 6 ft.) wall specimens installed in the FEWF. The first specimen was constructed by installing 25 mm (1 in) thick EPS insulation panels; the second specimen was constructed with 51 mm (2 in) thick XPS insulation panels, whereas; the third specimen was constructed by installing 76 mm (3 in) thick mineral fibre batt insulation; all insulation products were installed outboard of the sheathing membrane. The three wall specimens were installed side-by-side in the FEWF and subjected to local climate conditions of Ottawa over a period of one year (August 11, 2013 – October 1, 2014).
The first stage of the work program included the experimental design, installation of test specimens, commissioning of instrumentation, operation of the test facility, collection and monitoring of data, and data analyses. The second stage of the work program included conducting: material characterization of the exterior insulation products (EPS, XPS and mineral fibre insulation), model benchmarking, and parametric model simulation study.
In this report, the hygrothermal model, hygIRC-C, was benchmarked against the measured data. Results showed that the model predictions were in good agreement with the experimental data obtained from the different wall specimens. Thereafter, the hygrothermal model was used to conduct parametric analyses to predict the risk of condensation and mould growth in full-scale wall assemblies that incorporated exterior insulation products when these walls were subjected to different Canadian climates.
Similar to a previous NRC project [69], the simulation parameters that were used in this project (indoor conditions, outdoor conditions, air leakage rate, and other simulation parameters) were the same as that recommended by the Task Group (TG) on Properties and Position of Materials in the Building Envelope*. The hygrothermal performance of walls with exterior insulations was compared to the National Building Code of Canada’s prescribed reference wall. The reference wall consists of interior drywall ( (12.7 mm / 0.5 in) thick), polyethylene membrane air and vapour barrier (6 mil thick), 38 mm x 140 mm (2 x 6 in) wood-frame with friction-fit glassfibre batt insulation of R-24, and oriented strand board (OSB) (11 mm / 7/16 in thick).
The performance was expressed using the mould index criteria, which allowed sufficient resolution to assess the risk of moisture condensation and related risk of mould growth in the wall assemblies. The development of the mould index has been on-going for several years with the most recent work, as was used in this project, having being provided by Ojanen et al. [68]. The mould index levels range in value from 0 to 6, with 0 being equivalent to no growth and 6 indicating 100% coverage of either heavy or tight mould growth. The visual identification of mould growth on surfaces is given an index level value of 3.
*
EVALUATION OF THERMAL AND MOISTURE RESPONSE OF HIGHLY INSULATED WOOD-FRAME WALL ASSEMBLIES ―
PHASE 1,PART II:NUMERICAL MODELLING
REPORT A1-000444.4 xii
The R-values of the outboard insulation were R-3.9 (RSI-0.69), R-10 (RSI-1.76) and R-12.5 (RSI-2.20), and the Water Vapour Permeance (WVP) for these insulation products had, respectively, values of 27, 114, and 2130 ng/(Pa•s•m²) (0.5, 2.0 and 37.2 US perm). All wall assemblies were subjected to different climatic conditions of Canada as represented by
selecting a set of cities that included: Vancouver (BC), St John’s (NL), Ottawa (ON), Edmonton (AB) and Yellowknife (NT).
For each climatic location, the weather data was analyzed to identify the orientation of the wall assembly with the highest exfiltration rate. Note that a higher exfiltration rate would result in a greater risk to the formation of condensation and mould growth within the wall. As such, for each climatic condition, all numerical simulations were conducted for the wall assemblies that faced the predominant direction that would provide the highest exfiltration rate. Furthermore, it was determined that walls of the third storey were subjected to higher exfiltration rates as compared to walls in lower stories. Thus, all wall assemblies investigated in this study were walls of the third storey of low-rise buildings; this was assumed to represent the worst case scenario. Also, a sensitivity analysis was conducted to investigate the effect of different air leakage rates on the hygrothermal performance of the wall assembly and to determine the locations within the wall that were most at risk due to air leakage.
After conducting the numerical simulations for all wall assemblies, and based on the air leakage paths considered in this study, the different wall locations at risk for the formation of
condensation and mould growth were identified and for which the corresponding value for mould index was calculated. It is important to point out that the wall locations at risk of mould growth would change by considering different air leakage paths within the wall assembly.
The simulation results were summarized in a simple form using the following two parameters: Overall average mould index, and
Overall maximum mould index.
The two above parameters were determined for a two year simulation period (i.e. average year followed by a wet year, selected from long-term meteorological data for each location).
The results showed that no risk of condensation occurred in the wall assemblies when it was assumed that no air leakage occurred. Whereas, for the instance when100% of a nominal air leakage rate of 0.1 L/(s•m²) (at 75 Pa) was assumed, a higher risk of condensation and mould growth was obtained as compared to that for a 50% air leakage rate (i.e. 0.05 L/(s•m²) at 75 Pa). Also, the results showed that the values for the overall average and maximum mould index in walls with different types of exterior insulations were lower than that of the reference, NBC-compliant wall. In regard to insulation in the stud-cavity, the values for the overall average and maximum mould index in walls having R-24 (RSI-4.23) stud-cavity insulation were higher than that of walls with R-19 (RSI-3.35) insulation. Regarding the effect of the climatic locations on the performance of the reference wall, EPS wall and XPS wall, St John’s appeared to have the most severe climate in comparison to the other four locations investigated (Vancouver, Ottawa, Edmonton, and Yellowknife); the greatest values of the overall average mould index of the wall configurations amongst the five locations occurred at this location. For the wall having mineral fibre insulation, however, the values of overall average mould index were approximately the same for St John’s and Vancouver.
EVALUATION OF THERMAL AND MOISTURE RESPONSE OF HIGHLY INSULATED WOOD-FRAME WALL ASSEMBLIES ―
PHASE 1,PART II:NUMERICAL MODELLING
REPORT A1-000444.4 xiii
Evaluation of Thermal and Moisture Response of Highly Insulated
Wood-Frame Wall Assemblies
─ Phase 1
Part II: Numerical Modelling
Authored by:
Hamed H. Saber and Gnanamurugan Ganapathy
A Report for the
Canada Mortgage and Housing Corporation (CMHC) and
Natural Resources Canada (NRCan)
National Research Council Canada Ottawa ON K1A 0R6 Canada
8 January, 2016
This report may not be reproduced in whole or in part without the written consent of both the client and the National Research Council of Canada
EVALUATION OF THERMAL AND MOISTURE RESPONSE OF HIGHLY INSULATED WOOD-FRAME WALL ASSEMBLIES ―
PHASE 1,PART II:NUMERICAL MODELLING
EVALUATION OF THERMAL AND MOISTURE RESPONSE OF HIGHLY INSULATED WOOD-FRAME WALL ASSEMBLIES ―
PHASE 1,PART II:NUMERICAL MODELLING
REPORT A1-000444.4 1
Evaluation of Thermal and Moisture Response of Highly Insulated
Wood-Frame Wall Assemblies
─ Phase 1
Part II: Numerical Modelling
Hamed H. Saber and Gnanamurugan Ganapathy
1. Introduction
A brief review of literature is provided on the moisture performance of the building envelope of housing and small buildings in cold climates [1-12]. Ojanen and Kumaran [1] studied the effect of over- pressurization of residential houses on the moisture performance of the building envelope for both uniform and non-uniform airflow through wall assemblies. A related question was whether a 10 Pa over-pressurization limit was acceptable for homes located across
Canada. The results showed that the amount of moisture accumulation depends on the rate of exfiltration of the climatic conditions. As well, the results showed that the uniform airflow condition through the walls produced an earlier onset of wetting and faster drying than the uniform airflow condition (i.e. entry at interior and top of wall, exit at base of wall). The non-uniform airflow condition, however, presented more risk of moisture related damage to wall components than the uniform airflow condition.
The modelling study that was carried out by Karagiozis and Kumaran [2] focused on moisture content of components and total moisture accumulation in walls of six different vapour retarders incorporated in a typical Canadian residential wall within three Canadian cities. No airflow was considered in that study. It was concluded that vapour control of the building envelope was important for buildings located in cold climates and in general, moisture accumulates in the wall during the heating season but dries out in the summer.
The study by Ojanen and Kumaran [3] looked at the effect of adding exterior insulation to the sheathing or using sheathing with an increased thermal resistance. In that study, the moisture accumulation due to different air leakage paths was examined as well as the effect of varying indoor relative humidity (RH) on the hygrothermal performance. The results of the simulation showed that increasing the temperature of the interior surface of the of exterior insulated sheathing significantly reduced the amount of moisture accumulation and this in turn lead to higher tolerances for indoor RH and air leakage within the wall assembly.
The study reported by Kumaran and Haysom [4] provided the basis for placement of low permeance materials within building envelopes in cold climates. The key assumption in that study was that diffuse air leakage occurred across the assembly up to the allowable code limit
CLIENT REPORT ─PHASE 1,PART II
REPORT A1-000444.4 2
of 0.1 L/(s•m2
). Another study by the same authors [5] showed that by adding 25 mm of mineral fiberboard sheathing on the outside of the studs, the stud-cavity was warm enough to prevent condensation on the interior face and water accumulation was reduced.
Chown and Mukhopadhyaya [6] provided a brief history of the development of air and vapour barrier provisions in the National Building Code of Canada (NBCC) since the first NBCC was published in 1941 to the most recent changes made in 2005 [13-15]. The key change in 1990 NBCC [13] was to separate the functions of air barrier and vapour retarder thus allowing for the possibility of placing low permeance materials exterior to the main thermal resistance of the wall. This change raised the possibility that someone using a low-permeance material as an air-barrier might choose to place it close to the outer surface of the wall where condensation could form on its interior face. To reduce the probability of incorrect placement, the 1990 NBCC [13] included a restriction on the location of low-permeance air barriers. These air barriers had to be placed so that the inner surface remained above the dew point of the interior air when the outside temperature was 10C above the January design temperature. Also, that study [6] further refined the basis for placement of low-permeance materials for mild and humid climates where the expectation is that indoor Relative Humidity (RH) would likely exceed 34%.
Straube [7] investigated the role of vapor barriers on hygrothermal performance with the aid of simple and transparent diffusion calculations supported by measurements from full-scale natural exposure monitoring. That study explored the phenomenon of summertime condensation, the drying of roofs and walls, and multiple vapor barrier layers as well as the importance of assessing both the interior and exterior climate. The results showed that the addition of
insulated sheathing increased the temperature of the back of the sheathing and this reduced the frequency and severity of condensation due to air leakage. It was recommended that the
preconceptions of many building codes, standards, and designers need to be modified to acknowledge the facts of low-permeance vapor barriers [7].
A design protocol for the application of insulating sheathing in low-rise buildings with high interior relative humidity (maximum 60%) for different locations across Canada was developed in a study by Brown et al. [8]. That study consisted of conducting parametric study using a HAM model to determine the hygrothermal performance of walls with a range of thermal insulation, air tightness and vapour permeance. For the air leakage investigated in that study, the results showed that moisture that accumulated during the heating season dried out in the non-heating season. The authors suggested that further investigations are required in order to set a
threshold air leakage so as to minimize the risk of condensation. In another study, the same authors [9] have undertaken modelling exercise to simulate uncontrolled indoor humidity of residential buildings. A moisture balance method was developed to estimate the indoor humidity in buildings which is an important input to the hygrothermal models.
Maref et al. [10-12] conducted a research field study at the NRC’s Field Exposure of Walls Facility (FEWF) that focused on the hygrothermal and energy performance of retrofitted wall systems by adding exterior insulations of different air and vapour permeance. For the purpose of comparison, a reference wall with no exterior insulation (i.e. non-retrofitted wall system) was tested. The objective was to assess the winter and summer condensation (i.e. inward moisture) within these wall systems. Results showed that the addition of an exterior insulating sheathing
EVALUATION OF THERMAL AND MOISTURE RESPONSE OF HIGHLY INSULATED WOOD-FRAME WALL ASSEMBLIES ―
PHASE 1,PART II:NUMERICAL MODELLING
REPORT A1-000444.4 3
raised the temperatures of the stud-cavity materials and maintained them above the dew point temperature of the interior air, thus reducing the likelihood and duration of interstitial
condensation, within limits, but condensation can still take place during the coldest period of winter. Also, the wall systems with exterior insulation were less prone to interstitial condensation than similar wall without such exterior thermal insulation.
The objective of this study was first to benchmark the hygIRC-C model against the test data, and then use it to investigate the risk of condensation and mould growth in 2 x 6 wood-frame wall assemblies with and without exterior insulation when these walls are subjected to different climatic conditions of Canada.
2. Project Overview
NRC has undertaken field monitoring and numerical modelling to investigate the risk of
condensation in wall assemblies having different combinations of increased thermal resistance (R-value) of cavity insulation and of selected insulation products. The field monitoring of
different wall assemblies was undertaken in the NRC’s Field Exposure of Walls Facility (FEWF). Three wall assemblies were tested in Phase 1 and another three wall assemblies were tested in Phase 2. Table 1 provides a description of the wall assemblies of Phase 1 and Phase 2. This report focuses on the three wall assemblies of Phase 1. In this phase, three mid-scale 1219 mm x 1829 mm (4 ft. x 6 ft.) having 38 mm x 140 mm (2 x 6-in.) wood-frame walls that were constructed using different types of exterior insulation products that included: 25 mm (1 in) EPS; 51 mm (2 in) XPS, and, 76 mm (3 in) mineral fibre insulation. The three specimens were
installed side-by-side in the FEWF and exposed to local climate conditions of Ottawa over a one year period; the test period started on August 11, 2013 and ended on October 1, 2014. The scope of work included the experimental design, installation of test specimens, commissioning of instrumentation, operation of the test facility, collection and monitoring of data, data analyses, material characterization of the exterior insulations (EPS, XPS and mineral fibre insulation) and numerical modelling.
This report focuses on the numerical modelling where the NRC’s hygrothermal model, hygIRC-C, was benchmarked against the FEWF test data of different wall specimens. Thereafter, the model was used to conduct parametric analyses in order to investigate the risk of condensation and mould growth in different wall assemblies, subjected to different climatic conditions of a select set of locations in Canada. The hygIRC model description and record of benchmarking are available in Appendix – A1.
3. Model Benchmarking
Having previously benchmarked the present model to several tests undertaken in controlled laboratory conditions as described previously, a subsequent and important step was to
benchmark the present model against the field measurements for three wall systems described below. This report provides a brief description of the constructed wall specimens (full details are available in [72]. Thereafter, information is provided regarding assumptions, and initial and boundary conditions that were used in conducting model benchmarking.
CLIENT REPORT ─PHASE 1,PART II
REPORT A1-000444.4 4
3.1 Wall Specimens
Three mid-scale (1219 mm x 1829 mm / 4 ft. x 6-ft.) residential 38 mm x 140 mm (2 x 6-in.) wood-frame wall test specimens were installed side-by-side in the Field Exposure of Walls Facility (FEWF). The different material layers and the dimensions of the wall specimens are described in Table 1 and shown in Figure 1 to Figure 4. The backup wall for all three design
Table 1. Descriptions of walls for Phase-1 and Phase-2 (Yr 2013-2015)*
* layers listed from exterior to interior
Phase
Wall-1
4 ft. x 6 ft.
Wall-2
4 ft. x 6 ft.
Wall-3
4 ft. x 6 ft.
Phase-1:
2 x 6-in. wood
framing with
exterior
insulation
Vinyl siding 1.5 in wide x 7/16”thick furring strip installed vertically 1 in EPS rigid foam
insulation (exterior insulation) Sheathing membrane 11 mm OSB wood-sheathing 2x6 nominal stud
cavity with R24 glass fiber insulation batts 6 mil poly air/vapour
barrier
½ in painted drywall
Vinyl siding 1.5 in wide x 7/16”
thick furring strip installed vertically 2 in XPS rigid foam insulation (exterior insulation) Sheathing membrane 11 mm OSB wood-sheathing 2x6 nominal stud
cavity with R24 glass fiber insulation batts 6 mil poly air/vapour
barrier
½ in painted drywall
Vinyl siding 1.5 in wide x 7/16”
thick furring strip installed vertically 3in semi-rigid mineral
fibre insulation (exterior insulation) Sheathing membrane 11 mm OSB wood-sheathing 2x6 nominal stud
cavity with R24 glass fiber insulation batts 6 mil poly air/vapour
barrier ½ in painted drywall
Wall-4
4 ft. x 6 ft.
Wall-5
4 ft. x 6 ft.
Wall-6
4 ft. x 6 ft.
Phase-2:
Different
wood framing
with interior
insulation
Vinyl siding Sheathing membrane 11 mm OSB wood-sheathing 2x6 nominal studcavity with R24 glass fiber insulation batts 2 in ( 2 layers of 1 in thick) XPS rigid foam insulation (interior insulation)
6 mil poly air/vapour barrier ½ in painted drywall Vinyl siding Sheathing membrane 11 mm OSB wood-sheathing 2x10 nominal stud cavity (2x6 and 2x4 studs together) with 2 in spray foam
insulation on interior side of the OSB + glass fiber filling the rest of the cavity 6 mil poly air/vapour
barrier ½ in painted drywall Vinyl siding Sheathing membrane 11 mm OSB wood-sheathing 2x12 nominal stud cavity (2x4 stud + 2x4 gap + 2x4 stud) with cellulose insulation filling in entire cavity 6 mil poly air/vapour
barrier
EVALUATION OF THERMAL AND MOISTURE RESPONSE OF HIGHLY INSULATED WOOD-FRAME WALL ASSEMBLIES ―
PHASE 1,PART II:NUMERICAL MODELLING
REPORT A1-000444.4 5
strategies consisted of interior drywall ((12.7 mm / 0.5 in) thick), polyethylene membrane air and vapour barrier (6 mil thick), 38 mm x 140 mm (2 x 6-in.) wood-frame with friction-fit glass fibre batt insulation of R-24, and oriented strand board (OSB) (11 mm / 7/16 in. thick). In this project, the backup wall was constructed by adding different types of exterior insulation products of different thicknesses. As shown in Figure 2, the first wall (Wall 1) was constructed by adding an expanded polystyrene (EPS) layer of 25 mm (1 in) thick on the OSB sheathing. The second wall (Wall 2) was constructed with a 51 mm (2 in) thick extruded polystyrene (XPS) panel (Figure 3). The final wall (Wall 3) was constructed with 76 mm (3 in) thick mineral fibre insulation (Figure 4).
As a part of the test protocol, fully described in [72], all Heat Flux Transducers (HFTs) used in the three test specimens were calibrated according to ASTM C-1130 “Standard Practice for Calibrating Thin Heat Flux Transducers” [69]. The uncertainty of heat flux measurements was ± 5%. The locations of the HFTs are shown in Figure 2 to Figure 4. Also, the uncertainty of the thermocouple measurements was ± 0.1oC.
3.2 Transient Numerical Simulations
This section presents the assumptions, and initial and boundary conditions that were used in conducting the numerical simulations for different wall specimens that were constructed using EPS, XPS and mineral fibre insulations. As indicated earlier, the hygrothermal properties of these insulations were measured in this project.
3.2.1 Assumptions
It was assumed that all material layers were in direct contact with one another (i.e. the interfacial thermal resistances between all material layers were neglected). The emissivity of all surfaces that bounded the airspaces (i.e. airspaces between exterior insulations, furring strips and vinyl siding) was taken equal to 0.9 [54]. The effects of heat transfer by conduction, convection and radiation within these airspaces on the thermal performance of wall assemblies were determined.
3.2.2 Initial and Boundary Conditions
The initial temperature in all material layers of the respective wall specimens (Wall 1, 2 and 3) was assumed uniform and equal to 10.0oC. Since this initial temperature was not the same as in the test, it was anticipated that the predicted dynamic response of the different wall
specimens in the first period of the test (e.g. the first 24 – 48 hr) would be different from that obtained in the test itself. The boundary conditions on the top and bottom surfaces of the wall systems were assumed to be adiabatic (i.e. no edge heat losses). The outdoor surface of the vinyl siding for all wall systems was subjected to a temperature boundary condition. Similarly, the indoor surface of the gypsum board for all wall systems was subjected to a temperature boundary condition. The temperatures on the outdoor and indoor surfaces of different wall specimens, and that changed over time, were taken equal to that measured on these surfaces.
Figure 1. Schematic of three residential 38 mm x 140 mm (2 x 6 in.) wood-frame wall test specimens installed side-by-side in the FEWF
CLIENT REPORT –PHASE 1,PART II
REPORT A1-000444.4 10
3.5 Comparison between Model Predictions and Measurements
To benchmark the present model, transient numerical simulations were conducted for the three wall specimens (Figure 1). The full description of all instrumentation (i.e. thermocouples, Heat Flux Transducers (HFTs), Pressure (P) sensors, and Relative Humidity (RH) sensors) and
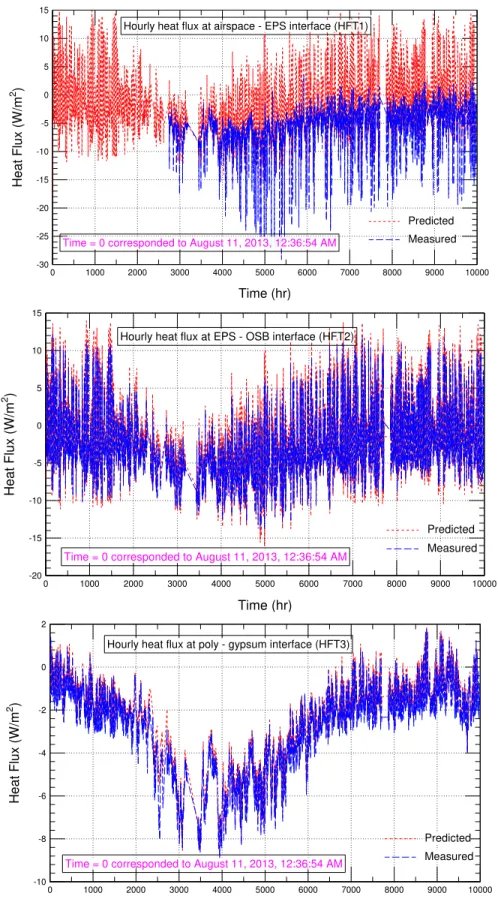
experimental data are available in [72]. In each wall system, three Heat Flux Transducers (HFTs) were used to measure the heat flux at the middle (mid-height and mid-width, see the inserts in Figure 2, Figure 3 and Figure 4) of each wall at three interfaces, namely:
(a) HFT1 at interface between airspace and exterior insulation; (b) HFT2 at interface between exterior insulation and OSB, and;
(c) HFT3 at interface between polyethylene air barrier membrane and gypsum interface. For the EPS wall specimen (Wall 1),
Figure 5. EPS wall (Wall 1) ─ Comparison between predicted and measured heat fluxes at interface: (i) airspace – EPS; (ii) EPS – OSB; (iii) poly – gypsum
-i,
Figure 5. EPS wall (Wall 1) ─ Comparison between predicted and measured heat fluxes at interface: (i) airspace – EPS; (ii) EPS – OSB; (iii) poly – gypsum
-ii and
Figure 5. EPS wall (Wall 1) ─ Comparison between predicted and measured heat fluxes at interface: (i) airspace – EPS; (ii) EPS – OSB; (iii) poly – gypsum
-iii show comparisons between the measured and the predicted values of heat flux during the test period. In these figures, time = 0 at which experimental data was collected corresponded to August 11, 2013 at 12:36:54 AM. Unlike the other wall specimens, the HFT1 located at the interface between the airspace and exterior insulation in Wall 1 was not functioning properly during the entire test period (
Figure 5. EPS wall (Wall 1) ─ Comparison between predicted and measured heat fluxes at interface: (i) airspace – EPS; (ii) EPS – OSB; (iii) poly – gypsum
EVALUATION OF THERMAL AND MOISTURE RESPONSE OF HIGHLY INSULATED WOOD-FRAME WALL ASSEMBLIES ―
PHASE 1,PART II:NUMERICAL MODELLING
REPORT A1-000444.4 11
-i). However, as shown in
Figure 5. EPS wall (Wall 1) ─ Comparison between predicted and measured heat fluxes at interface: (i) airspace – EPS; (ii) EPS – OSB; (iii) poly – gypsum
-ii, the predicted heat flux at the EPS – OSB interface is in good agreement with the measurements from the HFT2. Similarly,
Figure 5. EPS wall (Wall 1) ─ Comparison between predicted and measured heat fluxes at interface: (i) airspace – EPS; (ii) EPS – OSB; (iii) poly – gypsum
-iii shows that the predicted heat flux at the poly – gypsum interface is in good agreement with measurements from the HFT3.
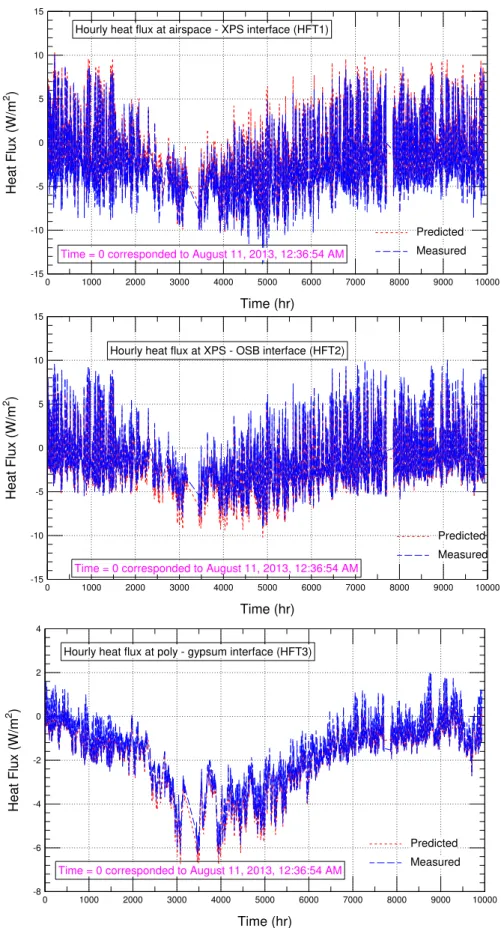
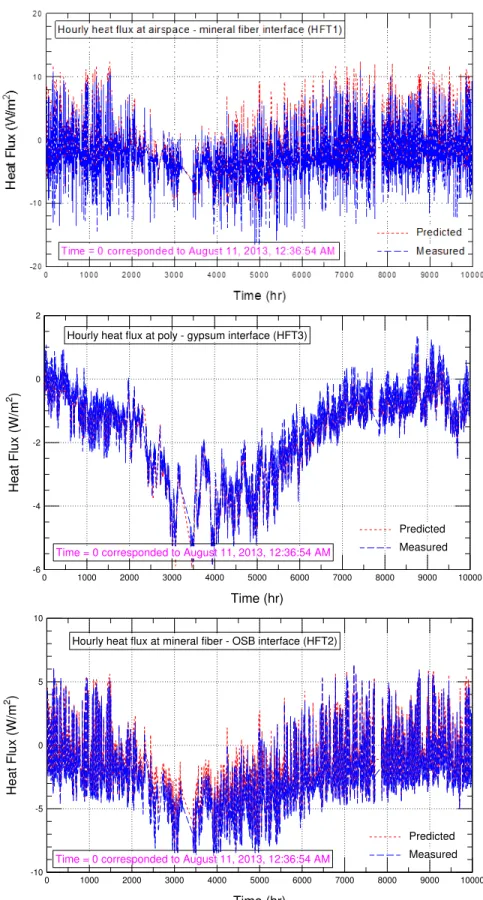
Figure 6-i, Figure 6-ii and Figure 6-iii show comparisons between the measured and predicted values of heat flux during the test period at different locations for the XPS wall specimen (Wall 2). As shown in these figures, the predicted values of heat flux were in good agreement with the measured values at each of the respective interfaces, specifically at the: airspace – XPS interface (Figure 6-i), XPS – OSB interface (Figure 6-ii), and the poly – gypsum interface (Figure 6-iii). Finally, for the wall specimen having mineral fibre insulation (Wall 3), comparisons are provided in Figure 7-i, Figure 7-ii and Figure 7-iii and in which are shown the predicted values of heat flux that were in good agreement with the measured values at each of the respective interfaces,
specifically at the: airspace – mineral fibre interface (Figure 7-i), the mineral fibre – OSB interface (Figure 7-ii), and the poly – gypsum interface (Figure 7-iii).
In summary, the results presented in this section show that the predicted values of heat flux at different locations in the wall assembly are in good agreement with the measured values of heat flux for the three wall systems, namely the : EPS wall specimen (
Figure 5. EPS wall (Wall 1) ─ Comparison between predicted and measured heat fluxes at interface: (i) airspace – EPS; (ii) EPS – OSB; (iii) poly – gypsum
), XPS wall specimen (Figure 6), and mineral fibre wall specimen (Figure 7).
It is not possible to complete the benchmarking of the model in respect to moisture transport on the basis of the field trials undertaken in the FEWF. This requires conducting experiments in a controlled environment after first conditioning the test specimens to known levels of moisture content. In fact the model has previously been benchmarked in controlled conditions as is described in some detail in Appendix A1.1.
CLIENT REPORT –PHASE 1,PART II REPORT A1-000444.4 12 -30 -25 -20 -15 -10 -5 0 5 10 15 0 1000 2000 3000 4000 5000 6000 7000 8000 9000 10000 Predicted Measured Hourly heat flux at airspace - EPS interface (HFT1)
Time = 0 corresponded to August 11, 2013, 12:36:54 AM
Time (hr) H e a t F lu x (W /m 2) -20 -15 -10 -5 0 5 10 15 0 1000 2000 3000 4000 5000 6000 7000 8000 9000 10000 Predicted Measured Hourly heat flux at EPS - OSB interface (HFT2)
Time = 0 corresponded to August 11, 2013, 12:36:54 AM
Time (hr) H e a t F lu x (W /m 2 ) -10 -8 -6 -4 -2 0 2 0 1000 2000 3000 4000 5000 6000 7000 8000 9000 10000 Predicted Measured Hourly heat flux at poly - gypsum interface (HFT3)
Time = 0 corresponded to August 11, 2013, 12:36:54 AM
Time (hr) H e a t F lu x (W /m 2 )
Figure 5. EPS wall (Wall 1) ─ Comparison between predicted and measured heat fluxes at interface: (i) airspace – EPS; (ii) EPS – OSB; (iii) poly – gypsum
EVALUATION OF THERMAL AND MOISTURE RESPONSE OF HIGHLY INSULATED WOOD-FRAME WALL ASSEMBLIES ―
PHASE 1,PART II:NUMERICAL MODELLING
REPORT A1-000444.4 13
Figure 6. XPS wall (Wall 2) ─ Comparison between predicted and measured heat fluxes at interface: (i) airspace – XPS; (ii) XPS-OSB; (iii) poly-gypsum
-15 -10 -5 0 5 10 15 0 1000 2000 3000 4000 5000 6000 7000 8000 9000 10000 Predicted Measured Hourly heat flux at XPS - OSB interface (HFT2)
Time = 0 corresponded to August 11, 2013, 12:36:54 AM
Time (hr) H e a t F lu x (W /m 2 ) -15 -10 -5 0 5 10 15 0 1000 2000 3000 4000 5000 6000 7000 8000 9000 10000 Predicted Measured Hourly heat flux at airspace - XPS interface (HFT1)
Time = 0 corresponded to August 11, 2013, 12:36:54 AM
Time (hr) H e a t F lu x (W /m 2 ) -8 -6 -4 -2 0 2 4 0 1000 2000 3000 4000 5000 6000 7000 8000 9000 10000 Predicted Measured Hourly heat flux at poly - gypsum interface (HFT3)
Time = 0 corresponded to August 11, 2013, 12:36:54 AM
Time (hr) H e a t F lu x (W /m 2 )
CLIENT REPORT –PHASE 1,PART II REPORT A1-000444.4 14 -6 -4 -2 0 2 0 1000 2000 3000 4000 5000 6000 7000 8000 9000 10000 Predicted Measured Hourly heat flux at poly - gypsum interface (HFT3)
Time = 0 corresponded to August 11, 2013, 12:36:54 AM
Time (hr) H e a t F lu x (W /m 2 ) -10 -5 0 5 10 0 1000 2000 3000 4000 5000 6000 7000 8000 9000 10000 Predicted Measured Hourly heat flux at mineral fiber - OSB interface (HFT2)
Time = 0 corresponded to August 11, 2013, 12:36:54 AM
Time (hr) H e a t F lu x (W /m 2 )
Figure 7. Mineral fibre wall (Wall 3) ─ Comparison between predicted and measured heat fluxes at airspace interface: (i) airspace – mineral fibre; (ii) mineral fibre – OSB; (iii) poly-gypsum
EVALUATION OF THERMAL AND MOISTURE RESPONSE OF HIGHLY INSULATED WOOD-FRAME WALL ASSEMBLIES ―
PHASE 1,PART II:NUMERICAL MODELLING
A1-000444.4 15
Thus, after benchmarking the present model in this project in respect to heat flux, and having previously benchmarked the model to several tests undertaken in field and controlled laboratory conditions as indicated in the Appendix A1.1, this model was used with confidence in this study to investigate the risk of condensation and mould growth in different wall assemblies with exterior insulations when these walls were subjected different Canadian climatic conditions.
3.6 Wall Assembly Configurations and Simulation Parameters
Hygrothermal simulations of all wall assemblies were conducted using the hygIRC-C model and using the construction details common to all wall assemblies to be modelled as listed in Table 2. For each of the materials or components specified, the rationale for the selection of specific materials is also given in this table.
Table 2. Construction details common to all wall assemblies to be modelled
Material selection Rationale
An exterior finish consisting of vinyl cladding installed on 19 mm strapping
To minimize the impact of exterior water ingress
A weather-resistive barrier (WRB) with a WVP of 1400 ng/(Pa•s•m²) (25 US perm) such as spun bonded polyolefin membrane
Common construction and highly
permeable so as not to limit the application of insulation materials for which the
selection of a more vapour tight material might otherwise affect the intent of the project
2 x 6 in wood-frame construction using framing members at 16 in on center
Currently, most common construction framing used in housing
A vapour barrier with a WVP of 60 ng/(Pa•s•m²) NBCC 2010 minimum requirement 9.25.4.2. (see reference [20]) An interior finish consisting of 12.5 mm gypsum
board
Currently the most common construction method for interior finish
Figure 8 shows a schematic of the code-compliant reference wall assembly. Also, Figure 9 shows a schematic of a wall assembly with different types of insulations. The different types of exterior insulation products used in this study are listed in Table 3. As will be explained later, the locations in these wall assemblies at risk of condensation and mould are listed in Table 4. Whereas the simulated results for moisture content and temperature are produced for every location within the wall system and at every time step (1 hr interval), an analysis of results was performed to establish which locations in the wall showed the greatest susceptibility to risk of condensation for the assemblies studied; this permitted rationalising the presentation of results. Post-processing of simulation results and reporting thus focussed on the locations reported in Table 4.
Figure 8. Schematic of reference wall assembly/code compliant configuration showing different component layers and assumed path of air flow through assembly (no exterior insulation)
Figure 9. Schematic of wall assembly configurations with exterior insulations showing different component layers and assumed path of air flow through assembly
CLIENT REPORT –PHASE 1,PART II
REPORT A1-000444.4 18
Table 3. Wood framed (2 x 6-in.) wall systems with exterior insulations
Parameter
Wall 1
Wall 2
Wall 3
2x6-in. Wood-Framing Cavity Insulation
Batt Insulation of R-24
(RSI-4.2)
Exterior Insulation Details
Type EPS XPS Mineral
fibre Thickness (in) 1 (25 mm) 2 (51 mm) 3 (76 mm)
Dry Density (kg/m3) 18 26 122
Dry Thermal Conductivity (W/(m•K)) 0.0369 0.0290 0.0347
Vapor Permeability (kg•m/(s•m2•Pa))
2.91E-12 1.39E-12 1.62E-10 Total Vapor Permeance (ng/(s•m2
•Pa)) 114.4 27.4 2129
Vapor Permeance ((ng/(s•m2
•Pa))/25 mm) 114.4 54.9 6390
Total RSI-value (m2•K/W) 0.69 1.75 2.20
Total R-value (ft2•hr•oF/BTU) 3.91 9.95 12.47
R-value ((m2•K/W)/25.4 mm) 0.69 0.88 0.73
R-value ((ft2•hr•oF/BTU)/in) 3.9 5.0 4.2
Table 4. Locations in wall assembly at risk of condensation and mould growth
Location (see Figure 16)
Depths and heights (mm; inches)
Top plate layer 51 and 63 mm (2 and 2.5 inches)
Insulation at top plate 10 mm by 51 and 63 mm (2 and 2.5 inches) Interface between top plate and
insulation 2.5 inches
Insulation at base of wall assembly 10 mm deep by heights of 152, 305, 457 mm (6, 12 and 18 inches)
Interface between sheathing panel and
EVALUATION OF THERMAL AND MOISTURE RESPONSE OF HIGHLY INSULATED WOOD-FRAME WALL ASSEMBLIES ―
PHASE 1,PART II:NUMERICAL MODELLING
REPORT A1-000444.4 19
4. Simulation Conditions for Parametric Study
In this section, the different simulation conditions are discussed that were used to conduct the numerical simulations for all wall assemblies shown in and Figure 8 and Figure 9 (see Table 3).
4.1 Vapour Barrier Conditions
As provided in Subsection 9.25.4 of the NBCC [20], the current maximum allowable WVP value for vapour barriers is 60 ng/(Pa•s•m²). This parametric study was conducted using a vapour barrier with a WVP of 60 ng/(Pa•s•m²) as provided in Table 2.
4.2 Air Leakage Conditions
All cases were modeled with some air flow introduced through openings into the assembly, as this is a likely scenario given the imperfections of the air barrier system of wall assemblies. Additionally, completing the investigation without considering the effects of air leakage would not create useful results in terms of assessing the risk to the formation of condensation in wall assemblies given that air leakage of indoor air to the wall assembly (i.e. exfiltration) is the primary cause for the formation of condensation in the assembly itself.
The modelling assumed that the path for air movement is initiated at the interior and is
introduced at the bottom of the wall and thereafter moisture is deposited along the interior face of the sheathing panel and exits through the top of the wall. This air leakage path was one of the scenarios used in the study by Ojanen and Kumaran [57] in which it was assumed that air would move through imperfections that existed at the wall top plate and the joint between the interior face of the exterior sheathing and the exterior of the top plate. For the code-compliant reference wall (i.e. no exterior insulation), this air leakage path is shown Figure 8, and that for walls with exterior insulation is shown Figure 9.
The air leakage rate for all cases in all locations was set to 0.1 L/(s•m²) at 75 Pa, which was an assumption used in at least one previous study (see [57, 69, 70]). These air leakage conditions are those assumed for the wall components of a home and would be roughly an order of
magnitude smaller than the whole house air leakage of an R-2000 qualified home as provided by NRCan2.
The impact of this assumption on the hygrothermal performance was investigated in a sensitivity analysis, by modelling a wall assembly with different air leakage rates ranging between 0 and 0.1 L/(s•m²) at 75 Pa. The results from such an analysis permitted deriving the least performing and most vulnerable wall assembly with respect to the formation of condensation and the risk to the formation of mould within the assembly. In this report, rates of air leakage referred to as 0%, 50% and 100% of air leakage relate, respectively, to 0.0, 0.05 and 0.1 L/(s•m²) at 75 Pa. As indicated later, the results of the sensitivity study supported the selection of 0.1 L/(s•m²) at 75 Pa as a means of challenging the wall system with moisture ingress from air leakage.
2
http://www.nrcan.gc.ca/energy/efficiency/housing/new-homes/5089: R-2000 Standard - 2012 Edition; Natural Resources Canada’s Office of Energy Efficiency; 16 p; § 4.3 Airtightness Requirements: The building envelope shall be constructed sufficiently airtight such that either the air change rate at 50 Pascals is no greater than 1.5 air changes per hour; 1.5 ACH @ 50 Pa is equivalent to 0.61 L/s-m2 @ 50 Pa and would necessarily be higher at 75 Pa.
CLIENT REPORT –PHASE 1,PART II
REPORT A1-000444.4 20
4.3 Approach to Simulation of Air Leakage
In the present study, the air leakage rate (Q) as a function of the total pressure differential across the wall assemblies (Ptot) is given as:
n tot
P
a
Q
(1)In a previous NRC project “Wall Energy Rating, WER” [22, 23, 24, 25 and 26], the air leakage rates were measured for a number of 2 x 6 in wood-frame wall systems having different types of thermal insulation in the wall cavities including open cell spray foam, closed cell spray foam, and glass fibre. For the full-scale wall systems with and without penetrations and having glass fibre insulation, the average value of the exponent ‘n’ in Eq. (1) was 0.7; this value was used in this study and other studies [69, 70]. The value of the coefficient ‘a’ in Eq. (1) was determined to satisfy the condition at which the air leakage rate is 0.1 L/(s•m²) at Ptot = 75 Pa when the
exponent n = 0.7. As such, the value of the coefficient ‘a’ is equal 0.00487 L/(s•m²•Pa0.7) where Q in L/(s•m²) and Ptot in Pa.
In Eq. (1), the total pressure across the building envelope can be calculated as:
ven st wind tot
P
P
P
P
(2) Where: windP
is the pressure differential due to wind;st
P
is the pressure differential due to the stack effect; andven
P
is the pressure differential due to mechanical ventilation system (i.e. pressurization or depressurization due to heating and cooling conditions). In this study,
P
ven was neglected and thus
P
ven
0
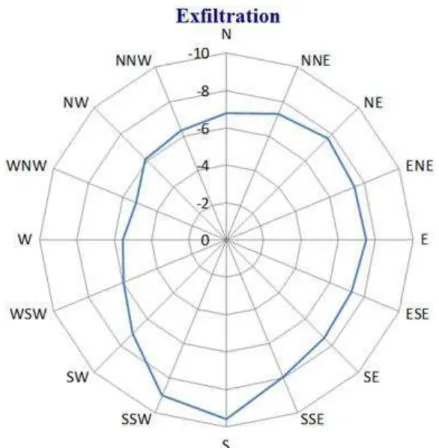
.The full details for calculating both the pressure differential due to the stack effect and wind pressure differential given different climatic conditions are available in reference [69]. As indicated in [69] and [70], the greater the exfiltration rate the higher the risk of formation of condensation and mould growth within the wall assembly; the wall is located, as previously noted, at the third storey and facing the direction of the highest exfiltration rate (e.g. see
Figure 10 and Figure 11 for Ottawa climate). This would thus represent the worst case scenario for the risk of formation of condensation and mould growth within the wall cavity. As such, all wall assemblies shown in Figure 8 and Figure 9 (see also Table 3) that were investigated in this study represent wall assemblies of the third storey of low-rise buildings.
EVALUATION OF THERMAL AND MOISTURE RESPONSE OF HIGHLY INSULATED WOOD-FRAME WALL ASSEMBLIES ―
PHASE 1,PART II:NUMERICAL MODELLING
REPORT A1-000444.4 21
Figure 10. Exfiltration: Average yearly negative wind pressure in Pa (wet year of Ottawa weather)
CLIENT REPORT –PHASE 1,PART II
REPORT A1-000444.4 22
4.4 Climatic Conditions
The wall assemblies (see Figure 8, Figure 9 and Table 3) were subjected to different climatic conditions of five different locations within Canada and having differing values of Heating Degree Days (HDD) and Moisture Index (MI), namely:
Vancouver, BC (mild, wet, HDD18 = from 2600 to 3100, MI = 1.44), St John’s, NL (cold, wet, HDD18 = 4800, MI = 1.41),
Ottawa, ON (cold, dry, HDD18 = 4440 - 4500, MI = 0.84), Edmonton, AB (cold, dry, HDD18 = 5120, MI = 0.48), and Yellowknife, NT (cold, dry, HDD18 = 8170, MI = 0.58).
The first four cities were recommended by the Task Group (TG) on Properties and Position of Materials in the Building Envelope‡. The last city (Yellowknife) was recommended by the client of this project.
As indicated earlier, the wall assemblies of the third storey of low-rise buildings were modeled in the orientation showing the highest average annual air exfiltration rate. The walls were assumed to be shaded to minimize the impact of solar-driven moisture ingress into the assembly and to minimize the solar drying effect on the wall. However, diffuse radiation was taken into
consideration.
4.5 Weather Data
Hygrothermal simulations were conducted for a period of two years. The first year
corresponded to an average year (conditioning year, where equal drying and wetting potential exists) and the second year corresponded to a wet year. Note that the wet year in each location was the worst-case situation given that the drying potential for a wall assembly is limited during a wet as compared to a drier year. The weather data of the different locations were obtained from the NRC’s weather database.
4.7 Indoor Conditions
Regarding to the indoor moisture load, the water vapour pressure differential across the wall assembly (from indoor to outdoor) corresponds to a moisture load of 5.2 g/m³, which is consistent with previous studies, in which a moisture load of 7.1 L/day was chosen for a
1 storey, 80 m² house, with indoor temperature of 21°C, water vapour pressure differential close to 700 Pa, and 0.3 ACH by mechanical ventilation, for which Pv = Pv,indoor – Pv,outdoor = 700 Pa,
which is referred to Option-A. Given the climatic conditions of Ottawa, as an example, the indoor relative humidity (RHind) of Option-A is shown in Figure 12. As shown in this figure,
Option-A resulted in a high value for RHind, which at times exceeded 100%. As such, four
additional different options for the indoor RH profile within a period of one year were compared as shown in Figure 12. Discussions to explore these options took place with the Task Group
‡
EVALUATION OF THERMAL AND MOISTURE RESPONSE OF HIGHLY INSULATED WOOD-FRAME WALL ASSEMBLIES ―
PHASE 1,PART II:NUMERICAL MODELLING
REPORT A1-000444.4 23
(TG) on Properties and Position of Materials in the Building Envelope§ [69]; to summarise the options considered:
Option A. Pv = 700 Pa
Option-B. This option was based on the method given in ASHRAE 160.
Option-C. This option was similar to Option-A (i.e. Pv = 700 Pa) but the value of RHind
was capped at 70%.
Option-D. This option was based on a modified ASHRAE 160 by reducing the interior RH with increasingly cold temperatures in the wintertime.
Option-C was the recommended** option to evaluate the indoor relative humidity [69] and was used in this study to conduct all numerical simulations of different wall assemblies that are listed in Table 3.
Other indoor conditions (i.e. indoor temperature) were set according to that provided in the ASHRAE Standard 160 [64] with respect to recommendations for conditioned space.
Figure 12. Different options for indoor relative humidity (Ottawa weather)
4.8 Initial Conditions
The initial temperature in all layers of the wall assemblies were taken equal to 21°C and the initial moisture content of all material layers corresponded to a relative humidity of 50%.
§
TG acting on behalf of the NBCC Standing Committee on Housing and Small Buildings (SCHSB). **
NBC TG on Low Permeance Materials [69]
20 25 30 35 40 45 50 55 60 65 70 75 80 85 90 95 100 105 -25 -20 -15 -10 -5 0 5 10 15 20 25 30
Option-A: Based on Pv = Pv, indoor - Pv, outdoor = 700 Pa
Option-B: Based on ASHRAE 160, Simple Method Option-C: Based on Pv = 700 Pa and Capped at 70% RH
Option-D: Based on modified ASHRAE 160
Ottawa Weather Toutdoor (oC) R Hin d ( % )
CLIENT REPORT –PHASE 1,PART II
REPORT A1-000444.4 24
4.9 Material Properties
In this study, the hygrothermal properties for the exterior insulations in Wall 1 (EPS), Wall 2 (XPS) and Wall 3 (Mineral fibre) were measured. A sheathing panel made of 7/16 in (11 mm) thick OSB was considered for all wall assemblies. Glass [65] compiled the available data for the WVP of OSB (11 mm thick), which is shown in Figure 13. The recommended values of WVP of OSB as a function of RH that were used in the numerical simulations are shown by the solid curve in this figure. A curve fit of these data is also provided in Figure 14. The hygrothermal properties of the other material layers shown in Figure 8 and Figure 9 were obtained from the NRC’s material database. A summary of the simulated conditions for all wall assemblies are provided in Table 5.
Table 5. Summary of simulated conditions
Criteria Assumptions/Conditions
Pressure exponent, n 0.7 (see Eq. (1)) Predominant wall
orientation Facing the highest exfiltration rate
P for stack effect Top storey of a 3-storey building to maximize the effect of exfiltration P for ventilation Assume depressurization/pressurization from ventilation source is
negligible
Air leakage rate, Q Corresponds to 0.0, 0.05 & 0.1 L/(s•m2) at 75 Pa††
Interior moisture load Constant water vapour pressure differential, Pv = 700 Pa and capped at
70% RH Water vapour permeance
of OSB
Function of the relative humidity ranging from 0-100% as recommended by Glass [65]
Modelling period Two years – Jan to Dec: one average year followed by one wet year Geographical locations Ottawa (ON), Edmonton (AB), Vancouver (BC) and St John’s (NL)
5. Acceptable Performance
The modelling results for each case were expressed using the mould index (M) criteria developed by Hukka and Viitanen [66], Viitanen and Ojanen [67], and Ojanen et al. [68]. The selected mould index criteria allowed sufficient resolution to assess the risk of moisture
condensation in the cases where the modeled assembly currently does not have to comply with the information provided in Table 9.25.5.2 of the NBCC 2010 [20] or where the modeled
assembly does not comply, but the requirements apply. The descriptions of the mould index levels are provided in Table 6.
The most recent mould model by Ojanen et al. [68] was used in this study to determine the mould index of different materials of the wall assemblies. In that model [68], the sensitivity of different construction materials for mould growth was classified in four sensitivity classes,
†† These rates of air leakage across the wall components are not unreasonable given that the whole
house air leakage for a R-2000 or an ENERGY STAR qualified home is roughly an order of magnitude greater than the wall.
EVALUATION OF THERMAL AND MOISTURE RESPONSE OF HIGHLY INSULATED WOOD-FRAME WALL ASSEMBLIES ―
PHASE 1,PART II:NUMERICAL MODELLING
REPORT A1-000444.4 25
namely, very sensitive, sensitive, medium resistant and resistant (see Table 7). Table 8 provides the assumed correspondence of sensitivity class for materials located within the wall assembly modelled in this study. More specifically, the sensitivity class for the top and bottom plates, OSB and foam was considered “Sensitive”, whereas the sensitivity class of the materials for cavity insulation (fiber-based), drywall and membranes was considered “Medium Resistant”.
Figure 13. Dependence of water vapor permeance (WVP) of OSB of 11 mm thick on the relative humidity; compilation of data provided by Glass [65]
Figure 14. WVP of OSB of 11 mm thick that used in numerical simulations
0 2 4 6 8 0 20 40 60 80 100 OSB Thickness = 11 mm 1 US perm = 57.2135 ng/(Pa.s.m2) y=(a*(x3))+(b*x*x)+(c*x), where: a=7.821621621E-6, b=-3.533441030E-4, c=0.03279001895 RH (%) OS B P e rm e a n ce ( US p e rm s)
CLIENT REPORT –PHASE 1,PART II
REPORT A1-000444.4 26
Table 6. Description of Mould Index (M) levels [66, 67, 68]
M
Mould Index (M) Description of Growth Rate
0
No growth1
Small amounts of mould on surface (microscope), initial stages of local growth2
Several local mould growth colonies on surface (microscope)3
Visual findings of mould on surface, < 10% coverage, or < 50% coverage of mould (microscope)4
Visual findings of mould on surface, 10%(microscope) –50% coverage, or > 50% coverage of mould5
Plenty of growth on surface, > 50% coverage (visual)6
Heavy and tight growth, coverage about 100%Table 7. Mould growth sensitivity classes and some corresponding materials [68]
Sensitivity Class Materials RHmin (%)
*
Very Sensitive Pine sapwood 80
Sensitive Glued wooden boards, PUR with paper surface, spruce 80
Medium Resistant Concrete, aerated and cellular concrete, glass wool, polyester wool 85
Resistant PUR with polished surface 85
* Minimum relative humidity needed for mould growth
Table 8. Mould growth sensitivity classes for materials of wall assemblies listed in Table 3 Sensitivity Class Material Layers of Wall Assemblies RHmin (%)
*
Very Sensitive 80
Sensitive Top plate, bottom plate, OSB, foam 80
Medium Resistant Fiberglass insulation, gypsum, membranes 85
Resistant 85
*Minimum relative humidity needed for mould to grow
Defining which level of mould index listed above is critical (i.e. the threshold of mould index) is not available at this time. However, the values of the mould index of client’s walls are compared against the value of the mould index of the reference wall/code compliant to determine whether or not the performances of client’s walls are as good as the reference wall. Currently, the TC of ASHRAE SSPC 160 is working to implement the mould index in ASHRAE 160. One of the tasks of the TC is consult with the researchers from Finland and Germany who developed the mould index criteria in order to define the threshold of the mould index.
6. Approach for Assessing the Overall Performance
As an example of the variation in values of mould index at different locations within a wall
assembly over the simulation period, results for the EPS (Wall 1) wall assembly subjected to the climatic conditions of Ottawa are provided in Figure 15; the results are for the case where the air leakage rate was assumed to be 0.1 L/(s•m²) at 75 Pa (i.e. 100%). The values for the mould index for all the different locations within the wall assembly are shown illustrating the broad variation in values of mould index that arose from the simulation results. The corresponding