EUROPEAN ORGANISATION FOR NUCLEAR RESEARCH (CERN)
CERN-PH-EP-2014-233
Submitted to: JHEP
Measurement of the charge asymmetry in dileptonic decays of
top quark pairs in
pp
collisions at
√
s = 7 TeV
using the ATLAS
detector
The ATLAS Collaboration
Abstract
A measurement of the top–antitop (t¯t) charge asymmetry is presented using data corresponding to an integrated luminosity of 4.6 fb−1of LHC pp collisions at a centre-of-mass energy of 7 TeV collected by the ATLAS detector. Events with two charged leptons, at least two jets and large missing transverse momentum are selected. Two observables are studied: A``
C based on the identified charged leptons, and At¯Ct, based on the reconstructed t¯tfinal state. The asymmetries are measured to be
A``C = 0.024 ± 0.015(stat.) ± 0.009 (syst.),
At¯Ct = 0.021 ± 0.025(stat.) ± 0.017 (syst.). The measured values are in agreement with the Standard Model predictions.
Prepared for submission to JHEP
Measurement of the charge asymmetry in
dileptonic decays of top quark pairs in pp collisions
at
√
s = 7 TeV using the ATLAS detector
The ATLAS collaboration
Abstract: A measurement of the top–antitop (t¯t) charge asymmetry is presented using data corresponding to an integrated luminosity of 4.6 fb−1 of LHC pp collisions at a centre-of-mass energy of 7 TeV collected by the ATLAS detector. Events with two charged leptons, at least two jets and large missing transverse momentum are selected. Two observables are studied: A``C based on the identified charged leptons, and At¯Ct, based on the reconstructed t¯t final state. The asymmetries are measured to be
A``C = 0.024 ± 0.015 (stat.) ± 0.009 (syst.),
At¯Ct = 0.021 ± 0.025 (stat.) ± 0.017 (syst.).
Contents
1 Introduction 1
2 The ATLAS detector 3
3 Simulated samples 4
4 Object and event selection 5
5 Kinematic reconstruction 7
6 Corrections 14
6.1 Correction of the lepton-based asymmetry 14
6.2 Unfolding of the t¯t asymmetry 15
7 Systematic uncertainties 17
8 Results 20
9 Conclusion 24
A Additional tables 32
1 Introduction
The top quark is the heaviest elementary particle known to date. It was discovered in 1995 at the Tevatron proton–antiproton (p¯p) collider by the CDF and D0 collaborations [1,2]. It is the only quark in the Standard Model (SM) that decays before hadronization occurs, and the only quark with Yukawa coupling to the Higgs boson close to unity. A precise study of top quark properties could shed light on possible physics models beyond the SM [3–9].
This analysis uses a data set corresponding to an integrated luminosity of 4.6 fb−1 of Large Hadron Collider (LHC) proton–proton (pp) collisions at a centre-of-mass energy of 7 TeV collected by the ATLAS detector. It is performed in the dilepton channel of the t¯t pair decay, realized when both W bosons decay to a charged lepton and a neutrino. The measured observables are the lepton-based charge asymmetry A``C and the t¯t charge asymmetry At¯Ct. The observable A``C is defined as an asymmetry between positively and negatively charged leptons (electrons and muons) in the dilepton decays of the t¯t pairs,
A``C = N (∆|η| > 0) − N (∆|η| < 0)
where
∆|η| = |η`+| − |η`−|, (1.2)
η`+ (η`−) is the pseudorapidity1 of the positively (negatively) charged lepton and N is
the number of events with positive or negative ∆|η|. While A``C is defined in eq. (1.1) as an asymmetry between positively and negatively charged lepton pseudorapidities, At¯Ct corresponds to the asymmetry in top quark and antitop quark rapidities2,
At¯Ct= N (∆|y| > 0) − N (∆|y| < 0)
N (∆|y| > 0) + N (∆|y| < 0), (1.3) where
∆|y| = |yt| − |yt¯|, (1.4)
yt(y¯t) is the rapidity of the top (antitop) quark, and N is the number of events with positive or negative ∆|y|.
In SM t¯t production, the asymmetry is absent at leading-order (LO) in Quantum Chromodynamics (QCD) and is introduced by the next-to-leading-order (NLO) QCD con-tributions to the t¯t differential cross-sections, which are odd with respect to the exchange of t and ¯t. At the LHC, the contributions to the asymmetries defined in eq. (1.1) and eq. (1.3) are predominantly from q ¯q-initiated t¯t production, and qg-initiated production also has a non-negligible contribution. The gg-initiated processes are symmetric [10]. The asymmetry predicted in the SM is slightly positive, implying that the top quark is preferentially emitted in the direction of the quark in the initial state. In q ¯q interactions at the LHC, the quark is in most cases a valence quark whereas the antiquark is from the sea. The asymmetry translates to a higher boost along the beam direction for the t-quark than for the ¯t-quark. The rapidity distribution of the t is thus slightly broader than the one of the ¯t.
The SM predictions of At¯t
Cand A``C computed at NLO in QCD and including electroweak corrections (NLO QCD+EW) are [10]
At¯Ct= 0.0123 ± 0.0005 (scale), (1.5)
A``C = 0.0070 ± 0.0003 (scale). (1.6)
These asymmetries are evaluated without acceptance cuts. The uncertainties are due to scale variations, estimated by simultaneous variation of the renormalization and factoriza-tion scale by a factor of half or two with respect to the reference scale value, which is set to the top quark mass. Recent next-to-next-to-leading order (NNLO) calculations of the forward-backward asymmetry for the Tevatron suggest that varying these scales signif-icantly underestimates the uncertainty due to higher order corrections [11], but no NNLO calculation has yet been published for pp interactions at the LHC energies. There is however a recent calculation obtained with the Principle of Maximum Conformality [12] which gives a consistent value of At¯Ct=0.0115+0.0001−0.0003 (scale). The predicted value of A``C is smaller than
1
The pseudorapidity is defined in terms of the polar angle θ as η = − ln tan(θ/2).
2The rapidity is defined as y =1 2ln
E+pz
E−pz where E is the energy of the particle and pz is the component
the prediction for At¯Ct, since the directions of the leptons do not fully follow the direction of the parent t and ¯t quarks. However, A``C can be measured more precisely, since it is determined without the need for a full reconstruction of t and ¯t kinematics, which involves the use of jets and missing transverse momentum that are reconstructed with less precision than the kinematic variables of the leptons. The values of A``C and At¯Ct as well as their correlation can be sensitive to new physics arising in top quark pair production [13–17].
The asymmetry At¯Ct has been measured in the single-lepton decay channel by the AT-LAS [18] and CMS [19] collaborations at√s = 7 TeV. The CMS collaboration has reported measurements of A``C and At¯Ct in the dilepton decay channel at √s = 7 TeV [20]. The mea-sured asymmetry values as well as those from a combination of ATLAS and CMS At¯Ctresults in the single-lepton decay channel [21] are consistent with the SM predictions.
At the Tevatron collider, t¯t production has a forward-backward asymmetry with respect to the direction of the proton and antiproton beams. The asymmetry based on t and ¯t quarks, At¯FBt , is defined as
At¯FBt = N (∆y > 0) − N (∆y < 0)
N (∆y > 0) + N (∆y < 0), (1.7)
where
∆y = yt− y¯t, (1.8)
yt (yt¯) is the rapidity of the t (¯t) quark and N is the number of events with positive or negative ∆y. An analogously defined lepton-based forward-backward asymmetry in t¯t pro-duction has been studied as well. At the Tevatron, t¯t events are predominantly produced by q ¯q annihilation, thus the predicted asymmetries are typically larger than at the LHC, where gg-initiated production dominates. The Tevatron experiments have reported deviations of forward-backward asymmetries from the SM predictions [22, 23], which have motivated a number of further asymmetry measurements. Comparing the results with the latest NNLO calculations available at the Tevatron [11], the deviations reported by the CDF collabora-tion [24–26] are reduced, while the latest measurements by the D0 collaboration [27, 28] are now in good agreement with the predictions.
This paper is organized as follows. In section 2 the main components of the ATLAS detector relevant for this measurement are summarized. In section3the simulated samples used for the analysis are presented. In section4the object and event selection are described. In section 5 the kinematic reconstruction used for the At¯Ct measurement is detailed. For comparison with theory prediction, the measurements are corrected for detector resolution and acceptance effects, as presented in section 6. Sections7 and8 describe the systematic uncertainties and the measurement results, respectively. Finally, the conclusions are given in section9.
2 The ATLAS detector
The ATLAS detector [29] at the LHC covers nearly the entire solid angle around the colli-sion point.3 It consists of an inner tracking detector surrounded by a thin superconducting
3ATLAS uses a right-handed coordinate system with its origin at the nominal interaction point (IP) in
solenoid, electromagnetic and hadronic calorimeters, and a muon spectrometer incorporat-ing three large superconductincorporat-ing toroid magnets. The inner-detector system is immersed in a 2 T axial magnetic field and provides charged-particle-tracking in the range |η| < 2.5.
A high-granularity silicon pixel detector covers the interaction region and typically provides three measurements per track. It is surrounded by a silicon microstrip tracker designed to provide four two-dimensional measurement points per track. These silicon de-tectors are complemented by a transition radiation tracker, which enables radially extended track reconstruction up to |η| = 2.0. The transition radiation tracker also provides electron identification information based on the fraction of hits (typically 30 in total) exceeding an energy-deposit threshold corresponding to transition radiation.
The calorimeter system covers the pseudorapidity range |η| < 4.9. Within the region |η| < 3.2, electromagnetic calorimetry is provided by barrel and end-cap high-granularity lead/liquid-argon (LAr) electromagnetic calorimeters, with an additional thin LAr presam-pler covering |η| < 1.8 to correct for energy loss in the material upstream of the calorimeters. Hadronic calorimetry is provided by a steel/scintillator-tile calorimeter, segmented into three barrel structures within |η| < 1.7, and two copper/LAr hadronic endcap calorime-ters. The solid angle coverage is completed with forward copper/LAr and tungsten/LAr calorimeters used for electromagnetic and hadronic measurements.
The muon spectrometer comprises separate trigger and high-precision tracking cham-bers measuring the deflection of muons in a magnetic field generated by superconducting air-core toroids. The precision chamber system covers the region |η| < 2.7 with three layers of monitored drift tube chambers, complemented by cathode strip chambers in the forward region. The muon trigger system covers the range |η| < 2.4 with resistive plate chambers in the barrel, and thin gap chambers in the endcap regions.
A three-level trigger system is used to select interesting events. The Level-1 trigger is implemented in hardware and uses a subset of detector information to reduce the event rate to a design value of at most 75 kHz. This is followed by two software-based trigger levels, which together reduce the event rate to about 300 Hz.
3 Simulated samples
Several Monte Carlo (MC) simulated samples are used in the analysis to model the signal and background processes. The total background, estimated partly from these simulated samples, is subtracted from the data at a later stage of the analysis. The signal sample is used to correct the background subtracted data for detector, resolution and acceptance effects. The MC samples are also used to evaluate the systematic uncertainties of the measurement.
The nominal simulated t¯t sample is generated using the Powheg-hvq [30–32] (patch4) generator with the CT10 [33] parton distribution function (PDF) set. The NLO QCD matrix element is used for the t¯t hard-scattering process. The parton showers (PS) and the underlying event are simulated using Pythia6 [34] (v6.425) with the CTEQ6L1 [35] PDF
of the LHC ring, and the y-axis points upward. Cylindrical coordinates (r, φ) are used in the transverse plane, φ being the azimuthal angle around the beam pipe.
and the corresponding Perugia 2011C set of tunable parameters (tune) [36] intended to be used with this PDF. The hard-scattering process renormalization and factorization scales are fixed at the generator default value Q that is defined by
Q = q
m2
t + p2T, (3.1)
where mtand pTare the top quark mass and the top quark transverse momentum, evaluated for the underlying Born configuration (i.e. before radiation). Additional t¯t samples used to evaluate signal modelling uncertainties are described in section 7. Signal samples are normalized to a reference value of σt¯t= 177+10−11pb for a top quark mass of mt= 172.5 GeV. The cross-section has been calculated at next-to-next-to-leading-order (NNLO) in QCD including resummation of next-to-next-to-leading logarithmic (NNLL) soft gluon terms [37–
42] with top++2.0 [43]. The PDF and strong coupling (αs) uncertainties were calculated using the PDF4LHC prescription [44] with the MSTW2008 68% CL NNLO [45,46], CT10 NNLO [33, 47] and NNPDF2.3 5f FFN [48] PDF sets, and added in quadrature to the scale uncertainty. The NNLO+NNLL cross-section value is about 3% larger than the exact NNLO prediction, as implemented in Hathor 1.5 [49].
The MC generators which are utilized to estimate the backgrounds are as follows. Single-top processes in the W t channel are generated with the MC@NLO event generator (v4.01) [50,51] with the CT10 PDF. The parton showers, hadronization and the underlying event are modelled using the Herwig (v6.520) [52,53] and Jimmy (v4.31) [54] generators. The CT10 PDF with the corresponding ATLAS AUET2 tune [55] is used for parton shower and hadronization settings. For Z/γ∗+jets and diboson events (W W , W Z and ZZ), Alp-gen (v2.13) [56] interfaced to Herwig and Jimmy is used. The CTEQ6L1 PDF and the cor-responding ATLAS AUET2 tune is used for the matrix element and parton shower settings. The W t background process is normalized to the reference NLO+NNLL QCD [57] predic-tion. Diboson production is normalized to the reference NLO QCD prediction obtained using MCFM [58] and MC@NLO generators with the MSTW2008 NLO PDF [45]. The Z/γ∗ → ee/µµ+jets cross-section is normalized using a control region in data as detailed in section4. The Z/γ∗ → τ τ +jets events are normalized to a NNLO reference cross-section using the FEWZ [59] and ZWPROD [60] programs with the MSTW2008 NNLO PDF.
To realistically model the data, the simulated samples are generated with an average of eight additional inelastic pp interactions from the same bunch crossing (referred to as pileup) overlaid on the hard-scatter event. Simulated samples are processed through AT-LAS detector simulation. For the majority of the samples, a full detector simulation [61] based on GEANT4 [62] is used. Some of the samples used for assessment of generator modelling uncertainties are obtained using a faster detector simulation program that relies on parameterized showers in the calorimeters [61,63]. Simulated events are then processed using the same reconstruction algorithms and analysis chain as the data.
4 Object and event selection
The data sample collected by the ATLAS detector in 2011 at a centre-of-mass energy of 7 TeV is used for the analysis. The integrated luminosity of the sample is 4.6 fb−1 with an
overall uncertainty of 1.8% [64]. The analysis makes use of reconstructed electrons, muons, jets and missing transverse momentum in the detector. Electrons are reconstructed as clus-ters of energy deposits in the electromagnetic calorimeter, matched to a track in the inner detector. They are required to pass a set of tight selection criteria [65]. The selected elec-trons have to satisfy a requirement on their transverse energy (ET) and the pseudorapidity of the associated calorimeter cluster (|ηcluster|): ET > 25 GeV and |ηcluster| < 2.47. The electrons in the region 1.37 < |ηcluster| < 1.52, which corresponds to a transition between the barrel and endcap electromagnetic calorimeters, are excluded. Electrons are required to be isolated, using the requirements described as follows (excluding calorimeter deposits and tracks from the electrons). The ETwithin a cone of size ∆R =p(∆η)2+ (∆φ)2 = 0.2 and the scalar sum of track pT within a cone of ∆R = 0.3 around the electron are required to be below ET- and η-dependent thresholds. The efficiency of this isolation requirement on electrons is 90%, and its goal is to reduce the contribution from hadrons mimicking lepton signatures, as well as leptons produced in heavy-hadron decays or photon conversion. These are referred to as fake and non-prompt leptons (NP) in the following.
Muons are reconstructed by matching a track in the inner detector to a track segment in the muon spectrometer. They are required to pass tight selections [66]. The selected muons are required to have pT > 20 GeV and |η| < 2.5. To reject fake and non-prompt muons, the following isolation requirements are imposed: the calorimeter transverse energy within a cone of ∆R = 0.2 around the muon is required to be less than 4 GeV and the scalar sum of track pT within a cone of ∆R = 0.3 is required to be less than 2.5 GeV (excluding the calorimeter deposits and tracks from the muons).
Jets are reconstructed from energy deposits in the calorimeter, using the anti-kt al-gorithm with a distance parameter R = 0.4 [67]. The energy of the input clusters [68] is corrected to the level of stable particles using calibration factors derived from simulation and data [69]. The jets are required to have a pT of at least 25 GeV and |η| < 2.5. To suppress the contribution from low-pT jets originating from pileup interactions, tracks as-sociated with the jet and emerging from the primary vertex are required to account for at least 75% of the scalar sum of the pT of all tracks associated with the jet. A primary ver-tex, originating from pp interactions, is a reconstructed vertex required to have at least five associated tracks with pT > 0.4 GeV. In the cases where more than one primary vertex is reconstructed, the vertex with the highest P
trkp2T is chosen and assumed to be associated with the hard-process, and the sum runs over all associated tracks.
The missing transverse momentum (EmissT ) is a measure of transverse momentum im-balance due to the presence of neutrinos. It is reconstructed from the transverse momenta of jets in the kinematic range of pT> 20 GeV and |η| < 4.5, electrons, muons, and calorimeter clusters not associated with any of the reconstructed objects, as detailed in ref. [70].
Using the objects reconstructed as above, an event selection optimized for signatures corresponding to t¯t events in which both W bosons from the t and ¯t quarks decay to leptons is performed. Events are required to have been selected by a single-electron trigger with a threshold of 20 or 22 GeV (depending on the data-taking period), or a single-muon trigger with a threshold of 18 GeV. They are required to have exactly two isolated, oppositely charged, leptons. Depending on the lepton flavours, the sample is divided into three analysis
channels referred to as ee, eµ and µµ. To reduce the Drell–Yan production of Z/γ∗+jets background, the invariant mass of the two leptons (m``) is required to be above a threshold used to suppress γ∗ → `` production background and outside a Z boson mass window in the ee and µµ channel events. The following requirements are used: m`` > 15 GeV and |m``−mZ| > 10 GeV. In the ee and µµ channels the Drell–Yan and diboson backgrounds are further reduced using a requirement on the missing transverse momentum, ETmiss> 60 GeV. In the eµ channel the Z/γ∗+jets background is smaller and suppressed by requiring the scalar sum of the pT of the two leading jets and leptons (HT) to be larger than 130 GeV.
The background contributions are estimated using a combination of techniques us-ing data and Monte Carlo events. In the case of sus-ingle-top and diboson processes, both the shape and normalization of the distributions are taken from the simulation. For Z/γ∗ → ee/µµ+jets events, simulated MC events are used to model the shape of the distributions, but a data control region is used for normalization. Drell–Yan events with ETmiss > 60 GeV are affected by energy mismeasurements, that are difficult to model in simulation. A control region with events with m`` in the Z-mass region is defined to study the effect of mismeasured ETmiss. The relative ETmiss, defined as the projection of the missing transverse momentum onto the direction of the jet or charged lepton with closest φ, is used to identify the events with mismeasured objects. Events with energy mismeasurements are characterized by high values of relative ETmiss. A cut is applied to the relative ETmiss, and data and simulation are then compared to derive a normalization correction factor which is applied to the simulated sample. The Z/γ∗ → τ τ contribution is estimated from MC simu-lation. The background stemming from events with at least one non-prompt or fake lepton is estimated from the data, since the lepton misidentification rates are difficult to model in MC simulation. A matrix method technique is used [71]. It consists of selecting data samples dominated either by real leptons or by fake leptons, and estimating the efficiencies for a real or fake lepton to satisfy the isolation criteria.
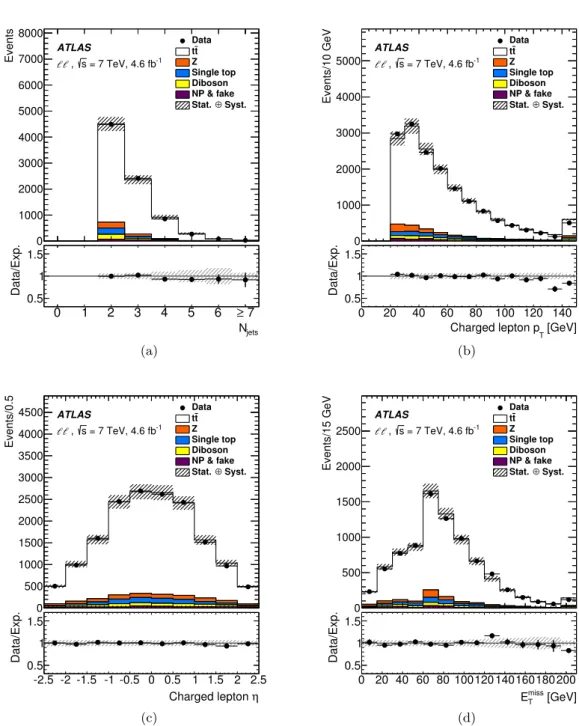
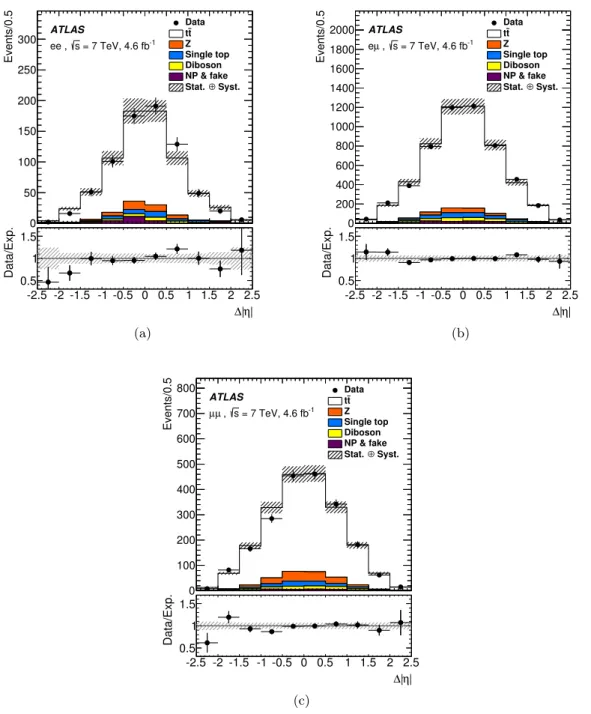
After the final selection, the data sample contains more than 8000 events, with an expected signal-to-background ratio of approximately six. The number of events in data and simulation, including statistical and systematic uncertainties, are compared in table1. After selection, the largest number of events is observed in the eµ channel, which has the highest branching ratio and the loosest background suppression cuts. The ee channel has the lowest number of events because of the stringent requirements on lepton kinematics. Figure1shows good agreement between the data and the SM predictions for the jet multiplicity, lepton pT and lepton pseudorapidity distributions. The ∆|η| distributions are shown in figure 2 for the three channels separately.
5 Kinematic reconstruction
For the measurement of the t¯t charge asymmetry, the direction of the top and antitop quarks needs to be determined. The four-momenta of top quarks in selected events are computed with a kinematic reconstruction using the objects observed in the detector. The reconstruc-tion is based on solving the kinematic equareconstruc-tions obtained when imposing energy–momentum conservation at each of the decay vertices of the process. In the dilepton channel, at least
Channel ee eµ µµ t¯t 621 ± 5 ± 59 4670 ± 10 ± 325 1780 ± 10 ± 120 Single top 31.6 ± 1.7 ± 3.8 230 ± 5 ± 21 83.9 ± 2.7 ± 8.3 Diboson 22.8 ± 0.9 ± 2.6 177 ± 3 ± 16 61.5 ± 1.5 ± 6.1 Z → ee (DD) 20.8 ± 1.7 ± 1.4 — — Z → µµ (DD) — 2.1 ± 0.5 ± 0.7 77 ± 4 ± 12 Z → τ τ 18.6 ± 1.8 ± 7.0 170 ± 6 ± 60 67 ± 4 ± 25 NP & fake (DD) 19 ± 4 ± 19 99 ± 10 ± 63 26.8 ± 5.1 ± 1.9 Total expected 734 ± 8 ± 63 5350 ± 20 ±340 2100 ± 10 ±130 Data 740 5328 2057
Table 1: Observed number of data events in comparison to the expected number of signal events and all relevant background contributions after the event selection. The backgrounds are estimated from the MC simulation or from the data-driven methods (DD) described in section 4. Events with one or more non-prompt or fake leptons are referred to as "NP & fake". The first uncertainty is statistical, the second corresponds to systematic uncertainties on background normalization and detector modelling described in section 7. The values labeled with "—" are estimated to be smaller than 0.5.
two neutrinos are produced and escape undetected. Consequently, the system is undercon-strained and its kinematics cannot be fully determined without further assumptions (for example on the W boson and top quark masses, and the pseudorapidities of the neutrinos from the W boson decays). Moreover, several ambiguities have to be resolved to find the correct solution. For example, the lepton and jet from the same decay chain have to be associated. In an event with two leptons and two jets, this leads to two possible associa-tions. In this analysis, the neutrino weighting technique [72] is used. This procedure steps through different hypotheses for the pseudorapidity of the two neutrinos in the final state. These hypotheses are made independently for the two neutrinos. For each hypothesis, the algorithm calculates the full event kinematics, assuming the W boson and the top quark masses. It then assigns a weight to the resulting solution based on the level of agreement between the calculated and measured missing transverse momentum. The weight is defined as w = Y d=x,y exp −(E miss,calc d − E miss,obs d )2 2(σEmiss T ) 2 ! , (5.1)
with Edmiss,obsbeing the projection of the measured missing transverse momentum along the axes defining the transverse plane (d = x, y) and Edmiss,calcthe projection calculated with the assumed η values of the neutrino pair. The resolution on the missing transverse momentum is denoted σEmiss
T , and defined as σETmiss = 0.5pP ET GeV [70]. The total transverse energy,
P ET is defined as P ET =Pi=1NcellEisin θi where Ei and θi are the energy and the polar angle of calorimeter cells associated with clusters. All possible lepton–jet associations are considered and jet energy mismeasurements are accounted for by random shifts of the jet energies within their resolutions. The solution corresponding to the maximum weight is
Events 0 1000 2000 3000 4000 5000 6000 7000 8000 Data t t Z Single top Diboson NP & fake Syst. ⊕ Stat. ATLAS ℓℓ, s = 7 TeV, 4.6 fb-1 jets N 0 1 2 3 4 5 6 ≥ 7 Data/Exp. 0.5 1 1.5 (a) Events/10 GeV 0 1000 2000 3000 4000 5000 Data t t Z Single top Diboson NP & fake Syst. ⊕ Stat. ATLAS ℓℓ, s = 7 TeV, 4.6 fb-1 [GeV] T Charged lepton p 0 20 40 60 80 100 120 140 Data/Exp. 0.5 1 1.5 (b) Events/0.5 0 500 1000 1500 2000 2500 3000 3500 4000 4500 Datatt Z Single top Diboson NP & fake Syst. ⊕ Stat. ATLAS ℓℓ, s = 7 TeV, 4.6 fb-1 η Charged lepton -2.5 -2 -1.5 -1 -0.5 0 0.5 1 1.5 2 2.5 Data/Exp. 0.5 1 1.5 (c) Events/15 GeV 0 500 1000 1500 2000 2500 Data t t Z Single top Diboson NP & fake Syst. ⊕ Stat. ATLAS ℓℓ, s = 7 TeV, 4.6 fb-1 [GeV] miss T E 0 20 40 60 80 100120 140160180 200 Data/Exp. 0.5 1 1.5 (d)
Figure 1: Comparison of the expected and observed distributions of (a) the jet multiplicity, (b) the lepton transverse momentum pT, (c) the lepton pseudorapidity η and (d) the missing transverse momentum ETmiss, shown for the combined ee, eµ and µµ channels. Events beyond the range of the horizontal axis of (a), (b) and (d) are included in the last bin. The hatched area corresponds to the combined statistical and systematic uncertainties. Events with one or more non-prompt or fake leptons are referred to as "NP & fake".
selected to represent the event.
recon-Events/0.5 0 50 100 150 200 250 300 Data t t Z Single top Diboson NP & fake Syst. ⊕ Stat. ATLAS ee, s = 7 TeV, 4.6 fb-1 | η | ∆ -2.5 -2 -1.5 -1 -0.5 0 0.5 1 1.5 2 2.5 Data/Exp. 0.5 1 1.5 (a) Events/0.5 0 200 400 600 800 1000 1200 1400 1600 1800 2000 Datatt Z Single top Diboson NP & fake Syst. ⊕ Stat. ATLAS µ e , s = 7 TeV, 4.6 fb-1 | η | ∆ -2.5 -2 -1.5 -1 -0.5 0 0.5 1 1.5 2 2.5 Data/Exp. 0.5 1 1.5 (b) Events/0.5 0 100 200 300 400 500 600 700 800 Data t t Z Single top Diboson NP & fake Syst. ⊕ Stat. ATLAS µ µ , s = 7 TeV, 4.6 fb-1 | η | ∆ -2.5 -2 -1.5 -1 -0.5 0 0.5 1 1.5 2 2.5 Data/Exp. 0.5 1 1.5 (c)
Figure 2: Comparison of the expected and observed distributions of the ∆|η| variable for the (a) ee, (b) eµ and (c) µµ channels. The hatched area corresponds to the combined sta-tistical and systematic uncertainties. Events with one or more non-prompt or fake leptons are referred to as "NP & fake".
struction efficiency, corresponding to the fraction of events in which solutions for t and ¯t four-momenta are found, is estimated to be about 80% in the data. In the other 20% of events, no solution to the system of the kinematic equations could be found, and the events are not used for the measurement of At¯Ct. The performance of the reconstruction algorithm
for key variables, such as the top quark rapidities and ∆|y|, is evaluated using the nominal t¯t simulated sample. The fraction of reconstructed MC events where the sign of ∆|y| is determined correctly is about 70%. In the simulated samples, the correct combination of the charged leptons and two jets from b(¯b)-quarks is found in approximately 80% of the events with exactly two reconstructed jets, both of which are matched to the b(¯b)-quarks. In case all events passing the event selection are considered, the correct combination is found in approximately 47% of the events.
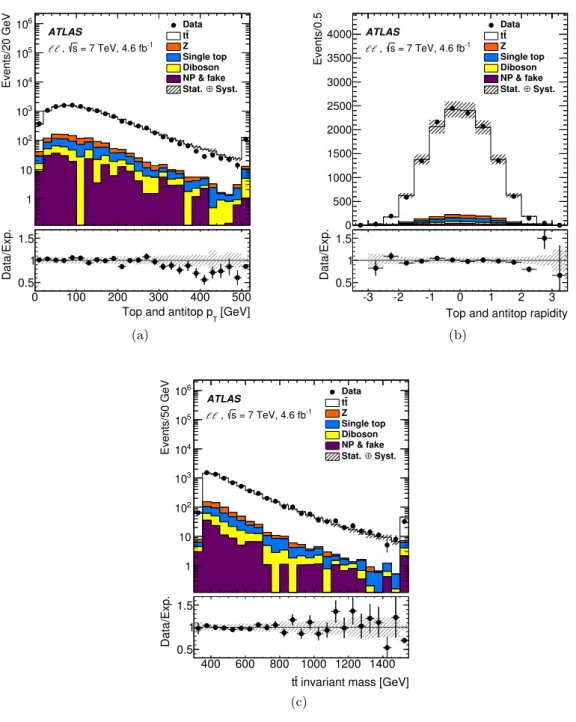
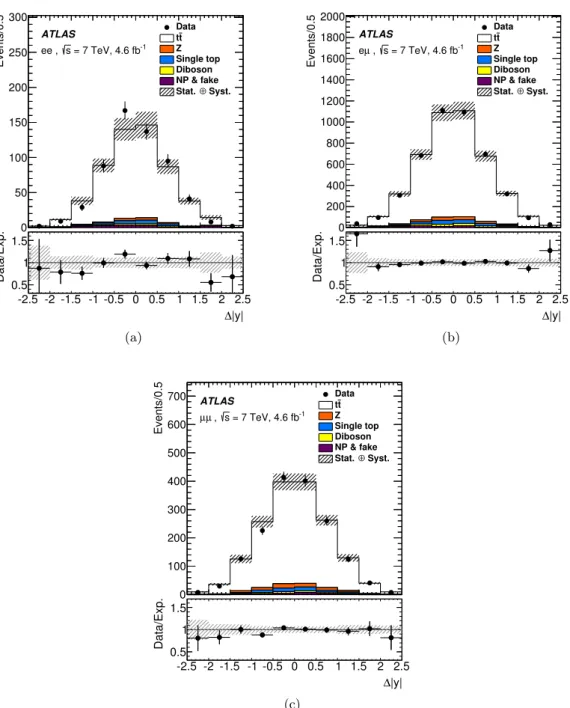
In figure 3the distributions of the top quark transverse momentum, top quark rapidity and the t¯t invariant mass are shown for the combined ee, eµ and µµ channels. In figure 4
the ∆|y| distribution is shown separately for each of the ee, eµ and µµ channels. Good agreement between the observed and expected distributions is found.
Events/20 GeV 1 10 2 10 3 10 4 10 5 10 6 10 Data t t Z Single top Diboson NP & fake Syst. ⊕ Stat. ATLAS ℓℓ, s = 7 TeV, 4.6 fb-1 [GeV] T
Top and antitop p
0 100 200 300 400 500 Data/Exp. 0.5 1 1.5 (a) Events/0.5 0 500 1000 1500 2000 2500 3000 3500 4000 Datatt Z Single top Diboson NP & fake Syst. ⊕ Stat. ATLAS ℓℓ, s = 7 TeV, 4.6 fb-1
Top and antitop rapidity
-3 -2 -1 0 1 2 3 Data/Exp. 0.5 1 1.5 (b) Events/50 GeV 1 10 2 10 3 10 4 10 5 10 6 10 Data t t Z Single top Diboson NP & fake Syst. ⊕ Stat. ATLAS ℓℓ, s = 7 TeV, 4.6 fb-1
invariant mass [GeV] t t 400 600 800 1000 1200 1400 Data/Exp. 0.5 1 1.5 (c)
Figure 3: Comparison of the expected and observed distributions of (a) the top and antitop quark transverse momentum pT, (b) top and antitop quark rapidity and (c) the t¯t invariant mass, shown for the combined ee, eµ and µµ channels. The hatched area corresponds to the combined statistical and systematic uncertainties. Events with one or more non-prompt or fake leptons are referred to as "NP & fake".
Events/0.5 0 50 100 150 200 250 300 Data t t Z Single top Diboson NP & fake Syst. ⊕ Stat. ATLAS ee, s = 7 TeV, 4.6 fb-1 |y| ∆ -2.5 -2 -1.5 -1 -0.5 0 0.5 1 1.5 2 2.5 Data/Exp. 0.5 1 1.5 (a) Events/0.5 0 200 400 600 800 1000 1200 1400 1600 1800 2000 Data t t Z Single top Diboson NP & fake Syst. ⊕ Stat. ATLAS µ e , s = 7 TeV, 4.6 fb-1 |y| ∆ -2.5 -2 -1.5 -1 -0.5 0 0.5 1 1.5 2 2.5 Data/Exp. 0.5 1 1.5 (b) Events/0.5 0 100 200 300 400 500 600 700 Data t t Z Single top Diboson NP & fake Syst. ⊕ Stat. ATLAS µ µ , s = 7 TeV, 4.6 fb-1 |y| ∆ -2.5 -2 -1.5 -1 -0.5 0 0.5 1 1.5 2 2.5 Data/Exp. 0.5 1 1.5 (c)
Figure 4: Comparison of the expected and observed distributions of the ∆|y| variable for the (a) ee, (b) eµ and (c) µµ channels. The hatched area corresponds to the combined sta-tistical and systematic uncertainties. Events with one or more non-prompt or fake leptons are referred to as "NP & fake".
95 2 0 0 0 0 0 0 0 0 0 0 0 0 5 92 2 0 0 0 0 0 0 0 0 0 0 0 0 6 93 3 0 0 0 0 0 0 0 0 0 0 0 0 4 93 3 0 0 0 0 0 0 0 0 0 0 0 0 4 93 3 0 0 0 0 0 0 0 0 0 0 0 0 4 93 3 0 0 0 0 0 0 0 0 0 0 0 0 4 94 3 0 0 0 0 0 0 0 0 0 0 0 0 3 94 4 0 0 0 0 0 0 0 0 0 0 0 0 3 93 4 0 0 0 0 0 0 0 0 0 0 0 0 3 93 4 0 0 0 0 0 0 0 0 0 0 0 0 3 93 4 0 0 0 0 0 0 0 0 0 0 0 0 3 93 5 0 0 0 0 0 0 0 0 0 0 0 0 3 92 6 0 0 0 0 0 0 0 0 0 0 0 0 3 94 | η | ∆ Generated -2 0 2 | η | ∆ Reconstructed -2 0 2 = 7 TeV s , µ Simulation, e ATLAS (a) 56 17 6 3 29 49 28 11 12 28 50 29 3 6 16 57 |y| ∆ Generated -4 -2 0 2 4 |y| ∆ Reconstructed -4 -2 0 2 4 = 7 TeV s , µ Simulation, e ATLAS (b)
Figure 5: Response matrices for (a) the lepton ∆|η| and (b) t¯t ∆|y| observables in the eµ channel. Each column of the matrices is normalized to unity and values are reported as percentage (%) units. Values smaller than 0.5% are rounded to 0%.
6 Corrections
For comparison with theoretical calculations, the measurements are corrected for detector resolution and acceptance effects. The corrections are applied to the observed ∆|η| and ∆|y| spectra. Apart from the corrected inclusive asymmetry values, particle- or parton-level ∆|η| and ∆|y| distributions are obtained and presented as normalized differential cross-sections in section 8. Acceptance corrections are included, thus all the results correspond to an extrapolation to the full phase-space for t¯t production.
In case of the A``C, the resolution of the measured lepton ∆|η| is very good. Figure5(a)
shows, for the eµ channel, the probability of an event with a generated value ∆|η| in the j-th bin to be reconstructed in the i-th bin of the corresponding distribution. This probability distribution is defined to be the response matrix for the observable ∆|η|. The diagonal bins of the response matrix account for more than 90% of the events. The acceptance and the small migrations are accounted for by the bin-by-bin correction described in subsection6.1. In case of the At¯Ct, the top quark direction, which is necessary to determine the t¯t asymmetry, is evaluated using the kinematic reconstruction of the events, described in section5. In addition to lepton directions and energies measured with very good resolution, jet four-momenta and ETmiss measured with worse resolution are used in reconstructing the t and ¯t four-momenta. The resolution of t¯t ∆|y| (figure5(b)) is thus much worse than that for the lepton ∆|η|. In order to correct for detector resolution and acceptance effects in At¯Ct, the fully Bayesian unfolding (FBU) technique [73] described in subsection6.2is used. 6.1 Correction of the lepton-based asymmetry
For A``C, bin-by-bin correction factors that also extrapolate to the full acceptance for the t¯t production are used. The goal of this procedure is to find an estimate of the true distribution, given an observed distribution and an expected background distribution. For
the lepton-based results, true distributions are obtained at particle level using leptons before Quantum Electrodynamics (QED) final-state radiation4. The following notation is used: µ and ˆµ are vectors of true distribution values and its estimate, respectively. An observed distribution is denoted by n and its expected value from simulation by νMC. An expected background distribution is denoted by β. For the i-th bin of the asymmetry distribution, the estimate of the true value is obtained by applying a correction factor Cito the difference between the observed number of events and the expected number of background events,
ˆ
µi= Ci(ni− βi) . (6.1)
The Ci are estimated using the t¯t MC simulated sample as
Ci = µMC i νMC i , (6.2)
where µMCi and νiMCare the predictions for the number of events in the i-th bin of the true and reconstruction-level distributions.
The bin-by-bin correction of A``C is tested on simulation samples reweighted such that different levels of asymmetry ∆|η| are introduced. Samples are reweighted according to a linear function of ∆|η| with a slope between −6% and 6% in steps of 2%. Corrected values obtained from reweighted distributions are found to be in good agreement with the input value, following a linear relationship. The choice of the binning is done by optimizing the linearity of the method and the expected statistical uncertainty of the asymmetry. The results in section 8 are obtained with ∆|η| distribution binned in 14 bins in the interval between −3 and 3.
The correction factors depend strongly on the channel and the bin, with the outer bins receiving larger fractional corrections. The ee channel has the lowest acceptance and thus the highest correction factors, reaching values of 500 in the outer bins, in which the events are mostly outside the detector fiducial acceptance. The eµ channel has a much higher acceptance, and the correction factors vary between 10 and 60. The dependence of the correction factors on the MC model and PDF is small, up to approximately 5%.
6.2 Unfolding of the t¯t asymmetry
In case of sizeable migrations across the bins of the considered distribution, the migrations need to be taken into account without introducing a significant bias during the correction procedure. Unfolding is better suited for the purpose than the bin-by-bin correction factors described in subsection 6.1. Using the response matrix (R), the true distribution (µ) is related to the expected reconstruction-level distribution (ν) and the expected background (β) by
ν = Rµ + β. (6.3)
4
The particle-level definition uses status-code 3 for Pythia6 for electrons and muons produced in W boson decays. In addition, electrons and muons produced from status-code 3 τ leptons are used. These particles are used both for the unfolding and for the predictions of the MC generators.
In the FBU technique, the maximum likelihood estimator of µ, L(µ), is given by log L(µ) = N X i=1 log P (ni; νi) − αS(µ) ; p(µ) ∝ L(µ) , (6.4) with P the Poisson distribution, n the observed distribution, S a regularization function and α a regularization parameter. The sum in i runs over all N bins of the distributions. The probability density of the unfolded spectra p(µ) is proportional to L(µ). The regularization function S is selected such that the spectra with a desired quality, such as smoothness, are preferred. The regularization parameter α controls the relative strength of the regularization when evaluating the likelihood. The unfolded spectrum and its associated uncertainty are extracted from the probability density p(µ). The statistical uncertainty corresponds to the width of the shortest interval covering 68% probability, and the unfolded spectrum corresponds to the middle of that interval.
The response matrix is obtained using information from the nominal t¯t simulated sam-ple and, in particular, using the top quarks before their decay (parton level) and after QCD radiation5.
As explained for the lepton-based asymmetry, the correction is done at the level of true dilepton events (where the two top quarks decay to electrons or muons, either from a direct W boson decay or through an intermediate τ lepton decay).
Using the vector of the true distribution’s estimated values ˆµ, the regularization func-tion is defined based on the curvature S(µ) = |C(µ) − C( ˆµ)|, with
C(µ) = N −1
X
i=2
(∆i+1,i− ∆i,i−1)2, and ∆i+1,i = µi+1− µi. (6.5)
As in the case of the lepton-based asymmetry, linearity tests are performed. A given asymmetry value is introduced by reweighting the samples according to a linear function of t¯t ∆|y| with a slope between -6% and 6% in steps of 2%. Unfolded values obtained from reweighted distributions are observed to be in good agreement with the injected values of At¯Ct, following a linear relationship. This linearity test is performed with and without regularization and yields similar performance. The binning used for the ∆|y| distribution as well as the regularization parameter are optimized simultaneously to minimise the expected statistical uncertainty while achieving good linearity. The results in section8are obtained with a regularization parameter α = 10−7. The ∆|y| distribution is binned in 4 bins in the interval between −5 and 5. For this binning choice, at least 50% of the events populate the response matrix diagonal bins for each of the ee, eµ and µµ channels (figure5(b)).
The overall correction which is applied to the distribution varies between factors of 10 and 100, depending on the channel and the bin. As shown in figure 5 the bins used for the t¯t ∆|y| distribution are wider than the bins used for the lepton ∆|η| distribution. The acceptance correction applied to the outer bins of ∆|y| is thus smaller than the correction obtained for the outer bins of ∆|η| distribution.
5
The parton-level definition uses status-code 155 for Herwig and 3 for Pythia6 for both the unfolding and for the predictions of the MC generators.
ee eµ µµ comb. Measured value 0.101 0.009 0.047 0.024 Statistical uncertainty ±0.052 ±0.019 ±0.030 ±0.015 Lepton reconstruction ±0.011 ±0.008 ±0.009 ±0.008 Jet reconstruction ±0.006 ±0.001 ±0.004 ±0.001 ETmiss ±0.001 <0.001 ±0.002 <0.001 Signal modelling ±0.004 ±0.003 ±0.003 ±0.003 PDF ±0.004 <0.001 <0.001 <0.001 NP & fake ±0.016 ±0.001 ±0.001 ±0.001 Background ±0.003 ±0.002 <0.001 ±0.001 Total sys. ±0.021 ±0.009 ±0.012 ±0.009
Table 2: Measured value and uncertainties for the lepton-based asymmetry A``C. Uncer-tainties with absolute value below 0.001 are considered negligible for the total uncertainty.
7 Systematic uncertainties
The uncertainties of the A``C corrections and At¯Ct unfolding method are estimated from the non-closure in the linearity test described in section6. For A``C the uncertainties are −0.002 in ee channel and negligible (< 0.001) in the eµ and µµ channels. For At¯Ctthe uncertainties are 0.002 in the ee channel and negligible (< 0.001) in the eµ and µµ channels. For both A``C and At¯Ctthe uncertainties have a negligible contribution to the measurement uncertainty and are not considered for the evaluation of the total systematic uncertainty of the results. The systematic uncertainties considered in this analysis are classified into three cate-gories: detector modelling uncertainties, signal modelling uncertainties and uncertainties related to the estimation of the backgrounds. The contributions of these sources of un-certainty are summarized in table 2 for the lepton-based asymmetry A``C and in table 3
for the t¯t asymmetry At¯Ct. The resulting variations are assumed to be of the same size in both directions and are therefore symmetrized. Apart from one-sided uncertainties, as in the case of the comparison of different MC models, the symmetrization does not notably modify the uncertainty values.
Detector modelling uncertainties are evaluated by performing corrections for detec-tor effects for A``C and At¯Ct, with the response matrices corresponding to the systematic variations. Effects of detector modelling uncertainties on the background are included by subtracting the background, varied accordingly, from the data. The following sources are considered.
• Lepton reconstruction
The uncertainty due to lepton reconstruction includes several sources. Lepton mo-mentum scale and resolution modelling correction factors and associated uncertainties are derived from comparisons of data and simulation in Z → `` events [65,66].
Uncer-ee eµ µµ comb. Measured value 0.025 0.007 0.043 0.021 Statistical uncertainty ±0.069 ±0.032 ±0.045 ±0.025 Lepton reconstruction ±0.008 ±0.008 ±0.004 ±0.007 Jet reconstruction ±0.015 ±0.009 ±0.006 ±0.009 ETmiss ±0.015 ±0.005 ±0.008 ±0.007 Signal modelling ±0.004 ±0.004 ±0.003 ±0.003 PDF ±0.004 ±0.005 ±0.004 ±0.005 NP & fake ±0.013 ±0.011 ±0.003 ±0.008 Background ±0.003 ±0.002 ±0.004 ±0.003 Total sys. ±0.027 ±0.018 ±0.013 ±0.017
Table 3: Measured value and uncertainties for the t¯t asymmetry At¯Ct.
tainties in the modelling of trigger, reconstruction and lepton identification efficiencies are also included. Data-to-simulation efficiency corrections, and their uncertainties, are derived from J/ψ → ``, Z → `` and W → eν events.
• Jet reconstruction
The effects include the jet energy scale and jet resolution uncertainties. Jet energy scale uncertainty is derived using information from test-beam data, LHC collision data and simulation [69]. It includes uncertainties in the flavour composition of the samples and mismeasurements due to close-by jets and pileup effects. Jet energy resolution and reconstruction efficiency uncertainties are obtained using minimum bias and QCD dijet events [69,74].
• Emiss T
The uncertainties from the energy scale and resolution corrections for leptons and jets are propagated to the Emiss
T . The category accounts for uncertainties in the energies of calorimeter cells not associated with the reconstructed objects and the uncertainties from cells associated with low-pT jets (7 GeV< pT < 20 GeV) [70] as well as the dependence of their energy on the number of pileup interactions.
The uncertainties due to the modelling of the signal t¯t distributions are evaluated by performing the linearity test for signal model samples generated with various assumptions. The following sources are quoted.
• Signal modelling
The uncertainty is evaluated by adding in quadrature the MC generator uncertainties, initial- and final-state radiation (ISR and FSR), underlying event (UE) and colour re-connection (CR) uncertainties described in the following. The systematic uncertainty related to the choice of a MC generator includes the difference between the nom-inal sample generated with Powheg-hvq + Pythia6 and samples generated with
MC@NLO + Herwig, Powheg-hvq + Herwig and Alpgen + Herwig. The ef-fects of renormalization and factorization scale choice are evaluated with a dedicated pair of samples generated with MC@NLO + Herwig. In these samples renormal-ization and factorrenormal-ization scales are varied simultaneously by a factor of two with respect to the reference scale. The reference scale is fixed at the MC@NLO gener-ator default, which is defined as the average of the t and the ¯t transverse masses, Q =
q
1/2(pT2t + pT2¯t) + m2t, where pTt(¯t) corresponds to the transverse momentum of the t or ¯t. Since the effects covered by generator comparisons and scale variations partially overlap, only the largest contribution from all comparisons is used. For the lepton-based asymmetry the dominant contribution was found to stem from the differ-ence between the nominal sample and the sample generated with Alpgen + Herwig. For the t¯t asymmetry the contributions of the comparison of the baseline sample re-sult to the rere-sults obtained with each of MC@NLO + Herwig, Powheg-hvq + Herwig and Alpgen + Herwig samples are of comparable size and significantly larger than the contribution of the renormalization and factorization scale uncertainty. The amount of ISR and FSR are treated as an additional source of signal modelling uncertainty. It is evaluated using samples generated with Alpgen + Pythia6 with variations of parameters controlling the renormalization scale used in Alpgen and in the Pythia6 parton shower. The renormalization scale is varied by factors of 0.5 and 2. The Pythia6 settings correspond to Perugia radLO and radHi tunes [36]. Apart from this, the UE and CR uncertainties are evaluated by comparing samples gen-erated with Powheg-hvq + Pythia6, using Perugia2011, Perugia2011 mpiHi and Perugia2011 noCR tunes [36]. For A``C, the contributions from the choice of MC gen-erator and from ISR and FSR exceed the non-perturbative UE and CR contributions. For At¯Ct, the contributions from the choice of MC generator and from radiation and non-perturbative modelling uncertainties are comparable.
• PDF uncertainty
The uncertainty due to the PDF is evaluated by performing linearity tests with sam-ples obtained from the nominal signal sample, generated with CT10 PDF, reweighted to other PDFs. The CT10 error set as well as MSTW2008 68% CL NLO [45] and NNPDF2.3 NLO (αs= 0.118) [48] central predictions are used. For each asymmetry value, the largest value of the three sources is quoted as uncertainty.
The uncertainties on the modelling of the SM backgrounds are divided into two cate-gories described below.
• NP & fake
This source corresponds to the uncertainty in the estimation of processes fulfilling the event selection due to non-prompt or misidentified leptons. The uncertainties are obtained by varying the efficiencies for a real or fake lepton to pass the tight selection, and are affecting both the normalization of the background and its shape.
• Background
quoted in the background category. They are evaluated by varying the normalization of each of these processes by the uncertainty on its cross-section. The uncertainty on the overall luminosity of 1.8% is also entering this category [64].
For both the lepton-based asymmetry A``C and the t¯t asymmetry At¯Ct, the statistical uncertainty is larger than the total systematic uncertainty. The A``C measurement has a combined statistical uncertainty of 1.5%, whereas the combined systematic uncertainty is 0.9%. The largest source of A``C systematic uncertainty is the lepton reconstruction un-certainty, which accounts for approximately 90% of the total systematic uncertainty. The uncertainty on the asymmetry A``C measured in the ee channel receives a sizeable contri-bution from the NP & fake leptons category (1.6%). This, however, does not significantly impact the combined systematic uncertainty since the ee channel receives a small weight in the combination, as detailed in section8. The t¯t asymmetry At¯Ct has a combined statistical uncertainty of 2.5% and a combined systematic uncertainty of 1.7%. The detector modelling uncertainties account for approximately 80% of the combined systematic uncertainty, with comparable large contributions from the lepton reconstruction, the ETmiss (0.7%) and the jet reconstruction uncertainty (0.9%). The NP & fake contribution to the At¯Ct systematic uncertainty is also sizeable (0.8%).
The uncertainties related to detector and background modelling are evaluated in each bin of the corrected distributions and presented in section8.
8 Results
After the event selection and reconstruction but before the correction described in section6
the inclusive lepton and t¯t asymmetries measured in the data are A``
C = 0.021 ± 0.011 (stat.) and At¯Ct = 0.003 ± 0.012 (stat.), respectively for the combination of the ee,eµ and µµ channels. After the subtraction of the background contribution, the measured data asymmetries are A``C = 0.029 ± 0.013 (stat.) and At¯Ct = 0.006 ± 0.014 (stat.). The corre-sponding asymmetry predictions in the nominal simulated t¯t sample are A``C = 0.005 ± 0.003 (stat.) and At¯Ct = 0.008 ± 0.003 (stat.). This sample is generated with the Powheg-hvq + Pythia6 generator with a particle-level lepton asymmetry of A``C = 0.0045 ± 0.0009 (stat.) and a parton-level t¯t asymmetry of At¯Ct = 0.0071 ± 0.0009 (stat.), evaluated in the full phase-space.
After the correction for detector, resolution and acceptance effects, the normalized differential cross-sections corrected to particle and parton level are obtained for ∆|η| and ∆|y| separately for the three channels. From these distributions, the inclusive asymmetry values can be extracted. The inclusive results obtained in the ee, eµ and µµ channels (see tables 2 and 3) are then combined using the best linear unbiased estimator (BLUE) method [75, 76]. All systematic uncertainties are assumed to be 100% correlated, except for the uncertainties on electrons and muons and on the NP & fake lepton background.
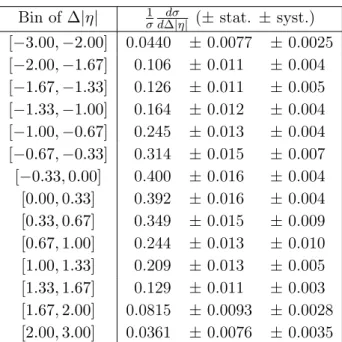
The normalized differential cross-sections for ∆|η| and ∆|y| are presented in figure 6
for the eµ channel. Good agreement is observed between the measured distributions and the ones predicted by Powheg-hvq + Pythia6. The normalized differential cross-sections
| η| ∆d σd σ 1 0.0 0.2 0.4 0.6 0.8 Particle level POWHEG-hvq+PYTHIA6 corrected data systematic unc. | η | ∆ -2 0 2 Data/Exp. 0.8 1.0 1.2 ATLAS , µ e s = 7 TeV, 4.6 fb-1 (a) |y| ∆ d σ d σ 1 0.0 0.2 0.4 0.6 0.8 Parton level POWHEG-hvq+PYTHIA6 corrected data systematic unc. |y| ∆ -4 -2 0 2 4 Data/Exp. 0.8 1.0 1.2 ATLAS , µ e s = 7 TeV, 4.6 fb-1 (b)
Figure 6: Normalized differential cross-sections for (a) lepton ∆|η| and (b) t¯t ∆|y| in the eµ channel after correcting for detector effects. The distributions predicted by Powheg-hvq + Pythia6 are compared to the data in the top panels. The bottom panels show the ratio of the corrected data to the predictions. The error bars correspond to the statistical uncertainties and the hatched area to the systematic uncertainties.
in that channel are also presented with statistical and systematic uncertainties in tables 4
and 5. The systematic uncertainties for the differential distributions do not include the signal modelling uncertainties, which could not be evaluated with sufficient precision due to the limited statistics of the simulated samples. For both distributions, the statistical uncertainty is somewhat larger than the systematic uncertainty. In appendix A the con-tributions from each source of systematic uncertainty, described in section 7, to the total systematic uncertainty in each bin of the ∆|η| and ∆|y| distributions are provided. The statistical correlations between the different bins of the distributions are also given.
The results for the inclusive lepton-based asymmetry A``C and the t¯t asymmetry At¯Ct after corrections for detector and resolution effects are shown in table 6. The values in the ee, eµ and µµ channels as well as for their combination are presented, together with statistical and systematic uncertainties.
Detailed information about the combination of the inclusive values is given in table 7. The combination probabilities are 21% and 81% for A``C and At¯Ctrespectively, demonstrating the compatibility of the measurements in the three channels (ee, eµ and µµ). The weight of each channel in the combination is also reported in table 7. The eµ channel dominates the combination, reflecting the larger data statistics compared to that of the ee and µµ channels.
The inclusive measurements after the detector and resolution effects corrections can be compared with the state-of-the-art theoretical predictions calculated at NLO QCD, includ-ing the electromagnetic and weak-interaction corrections [10]: A``C = 0.0070 ± 0.0003 (scale) and At¯Ct = 0.0123 ± 0.0005 (scale). In figure 7 the measured values of A``C and At¯Ct are compared to these predictions and Powheg-hvq + Pythia6 predictions. In the figure,
el-Bin of ∆|η| σ1d∆|η|dσ (± stat. ± syst.) [−3.00, −2.00] 0.0440 ± 0.0077 ± 0.0025 [−2.00, −1.67] 0.106 ± 0.011 ± 0.004 [−1.67, −1.33] 0.126 ± 0.011 ± 0.005 [−1.33, −1.00] 0.164 ± 0.012 ± 0.004 [−1.00, −0.67] 0.245 ± 0.013 ± 0.004 [−0.67, −0.33] 0.314 ± 0.015 ± 0.007 [−0.33, 0.00] 0.400 ± 0.016 ± 0.004 [0.00, 0.33] 0.392 ± 0.016 ± 0.004 [0.33, 0.67] 0.349 ± 0.015 ± 0.009 [0.67, 1.00] 0.244 ± 0.013 ± 0.010 [1.00, 1.33] 0.209 ± 0.013 ± 0.005 [1.33, 1.67] 0.129 ± 0.011 ± 0.003 [1.67, 2.00] 0.0815 ± 0.0093 ± 0.0028 [2.00, 3.00] 0.0361 ± 0.0076 ± 0.0035
Table 4: Normalized differential cross-sections for ∆|η| in the eµ channel presented with statistical and systematic uncertainties.
Bin of ∆|y| 1σd∆|y|dσ (± stat. ± syst.) [−5.00, −0.71] 0.0435 ± 0.0029 ± 0.0017
[−0.71, 0.00] 0.437 ± 0.016 ± 0.013 [0.00, 0.71] 0.420 ± 0.025 ± 0.015 [0.71, 5.00] 0.0470 ± 0.0032 ± 0.0024
Table 5: Normalized differential cross-sections for ∆|y| in the eµ channel presented with statistical and systematic uncertainties.
Channel A`` C At¯Ct ee 0.101 ± 0.052 ± 0.021 0.025 ± 0.069 ± 0.027 eµ 0.009 ± 0.019 ± 0.009 0.007 ± 0.032 ± 0.018 µµ 0.047 ± 0.030 ± 0.012 0.043 ± 0.045 ± 0.013 Combined 0.024 ± 0.015 ± 0.009 0.021 ± 0.025 ± 0.017
SM, NLO QCD+EW [10] 0.0070 ± 0.0003 (scale) 0.0123 ± 0.0005 (scale)
Table 6: Results for the lepton-based asymmetry A``C and the t¯t asymmetry At¯Ct after correcting for detector, resolution and acceptance effects. The values in the ee, eµ and µµ channels as well as the combined value are presented with their statistical and systematic uncertainties.
A``C At¯Ct
χ2 3.1 0.4
Probability (in %) 21 81
Weights (ee/eµ/µµ in %) 7 / 68 / 25 9 / 57 / 34
Table 7: Information about the combination of the three channels using the best linear unbiased estimator method: χ2 and probability of the combination, as well as the weight of each channel. [%] t t C A -5 0 5 10 [%] ll C A -5 0 5 10 ATLAS data σ ATLAS 1 σ ATLAS 2
SM, NLO QCD+EW, Bernreuther(2012) SM, POWHEG-hvq+PYTHIA6 ATLAS
ℓℓ, s = 7 TeV, 4.6 fb-1
Figure 7: Comparison of the inclusive A``C and At¯Ct measurement values to the theory predictions (SM NLO QCD+EW prediction [10] and the prediction of the Powheg-hvq
+ Pythia6 generator). Ellipses corresponding to 1σ and 2σ combined statistical and systematic uncertainties of the measurement, including the correlation between A``C and At¯Ct, are also shown.
measurement, including the correlation between A``C and At¯Ct, are also shown. The statis-tical correlation between A``C and At¯Ct is evaluated to be 37±5% using pseudo-experiments based on simulation. The systematic uncertainties are treated as 100% correlated. The resulting correlation between A``C and At¯Ct is about 55%. The measured values are both consistent with the theory predictions within the uncertainties. The measured At¯Ct values are consistent with but less precise than measurements in the single-lepton decay channel by the ATLAS [18] and CMS [19] collaborations. The measurements of A``C and At¯Ctare also consistent with the CMS collaboration measurements in the dilepton decay channel [20].
The inclusive measurement of A``C and At¯Ct is furthermore compared to two models of physics beyond the Standard Model (BSM) [9] that could be invoked to explain an anomalous forward-backward asymmetry at the Tevatron, such as reported by the CDF experiment [24]. Two models with a new colour octet particle exchanged in the s-channel are considered. In the model with the light octet, the new particle mass is below the t¯t production threshold. The model with the heavy octet uses the octet mass beyond the reach of the LHC. The new particles would not be visible as resonances in the mt¯tspectrum at the
[%] tt C A -5 0 5 10 [%] ll C A -5 0 5 10 ATLAS data σ ATLAS 1 σ ATLAS 2
light octet, AXIAL light octet, LEFT light octet, RIGHT
ATLAS ℓℓ, s = 7 TeV, 4.6 fb-1 (a) [%] tt C A -5 0 5 10 [%] ll C A -5 0 5 10 ATLAS data σ ATLAS 1 σ ATLAS 2
heavy octet, AXIAL heavy octet, LEFT heavy octet, RIGHT
ATLAS
ℓℓ, s = 7 TeV, 4.6 fb-1
(b)
Figure 8: Comparison of the measured inclusive A``C and At¯Ct values to two benchmark BSM models, one a light octet with mass below t¯t production threshold (left) and one with a heavy octet with mass beyond LHC reach (right), for various couplings as described in the legend.
Tevatron or at the LHC. The light octet is assumed to have a mass of m = 250 GeV and a width of Γ = 0.2m. For the heavy octet, the corrections to t¯t production are independent of the mass but instead depend on the ratio of coupling to mass, which is assumed to be 1/TeV. In figure 8 the measured A``C and At¯Ct values are compared to the light (figure 8(a)) and heavy (figure8(b)) colour octet model predictions in order to assess whether any of the BSM predictions can be excluded. Models with left-handed, right-handed and axial coupling to the up, down and top quarks are shown. The considered couplings to the quarks are such that the global fit to t¯t observables at the Tevatron and the LHC, including total cross-sections, various asymmetries, the top polarisation and spin correlations, is consistent with the measurements within two standard deviations [9]. The LHC asymmetry measurements in the dilepton decay channel are excluded from the fit. While the models span a sizeable range of values in the A``C and At¯Ctplane in figure8, their predictions are consistent with the measured value within the present uncertainties. Thus the potential BSM contributions cannot be excluded beyond the reach of the previous Tevatron and LHC measurements. Future A``C and At¯Ctmeasurements with a larger dataset could however further constrain the allowed couplings of the colour octet models if both statistical and systematic uncertainties can be reduced further.
9 Conclusion
Measurements of the t¯t charge asymmetry in the dilepton channel are presented. The mea-surements are performed using data corresponding to an integrated luminosity of 4.6 fb−1 of pp collisions at √s = 7 TeV collected by the ATLAS detector at the LHC. Selected events are required to have exactly two charged leptons (electron or muon), large
miss-ing transverse momentum and at least two jets. Both the lepton-based asymmetry A``C and the t¯t asymmetry At¯Ct are extracted in three channels: ee, eµ and µµ. The mea-surement of At¯Ct requires the kinematic reconstruction of the t¯t system, which is per-formed using the neutrino weighting technique. Agreement between predictions and data is checked after selection and kinematic reconstruction. Good agreement is obtained for all the kinematic observables studied. The `` ∆|η| and t¯t ∆|y| distributions and inclu-sive asymmetries are corrected for detector and acceptance effects. Corrections are ap-plied using bin-by-bin corrections for A``C and fully bayesian unfolding for At¯Ct. The dis-tributions of lepton ∆|η| and t¯t ∆|y| after the detector smearing corrections are provided for the eµ channel. Good agreement between the corrected values and predictions of the Monte Carlo generator models is observed in these distributions. The combined values of lepton-based inclusive asymmetry A``C and t¯t inclusive asymmetry At¯Ct are measured to be A``C = 0.024±0.015 (stat.)±0.009 (syst.) and At¯Ct= 0.021±0.025 (stat.)±0.017 (syst.). The measured values are in agreement with previous LHC measurements and with the Standard Model prediction [10]: A``C = 0.0070 ± 0.0003 (scale) and At¯Ct= 0.0123 ± 0.0005 (scale). The measurements are limited by statistical uncertainties. The predictions of benchmark light and heavy colour octet models with parameters selected such that the models are consistent with previous LHC and Tevatron data [9] are found to be consistent with the measured asymmetries.
Acknowledgements
We thank CERN for the very successful operation of the LHC, as well as the support staff from our institutions without whom ATLAS could not be operated efficiently.
We acknowledge the support of ANPCyT, Argentina; YerPhI, Armenia; ARC, Aus-tralia; BMWFW and FWF, Austria; ANAS, Azerbaijan; SSTC, Belarus; CNPq and FAPESP, Brazil; NSERC, NRC and CFI, Canada; CERN; CONICYT, Chile; CAS, MOST and NSFC, China; COLCIENCIAS, Colombia; MSMT CR, MPO CR and VSC CR, Czech Republic; DNRF, DNSRC and Lundbeck Foundation, Denmark; EPLANET, ERC and NSRF, Euro-pean Union; IN2P3-CNRS, CEA-DSM/IRFU, France; GNSF, Georgia; BMBF, DFG, HGF, MPG and AvH Foundation, Germany; GSRT and NSRF, Greece; RGC, Hong Kong SAR, China; ISF, MINERVA, GIF, I-CORE and Benoziyo Center, Israel; INFN, Italy; MEXT and JSPS, Japan; CNRST, Morocco; FOM and NWO, Netherlands; BRF and RCN, Nor-way; MNiSW and NCN, Poland; GRICES and FCT, Portugal; MNE/IFA, Romania; MES of Russia and NRC KI, Russian Federation; JINR; MSTD, Serbia; MSSR, Slovakia; ARRS and MIZŠ, Slovenia; DST/NRF, South Africa; MINECO, Spain; SRC and Wallenberg Foun-dation, Sweden; SER, SNSF and Cantons of Bern and Geneva, Switzerland; NSC, Taiwan; TAEK, Turkey; STFC, the Royal Society and Leverhulme Trust, United Kingdom; DOE and NSF, United States of America.
The crucial computing support from all WLCG partners is acknowledged gratefully, in particular from CERN and the ATLAS Tier-1 facilities at TRIUMF (Canada), NDGF (Denmark, Norway, Sweden), CC-IN2P3 (France), KIT/GridKA (Germany), INFN-CNAF
(Italy), NL-T1 (Netherlands), PIC (Spain), ASGC (Taiwan), RAL (UK) and BNL (USA) and in the Tier-2 facilities worldwide.
References
[1] F. Abe et al., CDF Collaboration, Observation of top quark production in p¯p collisions, Phys. Rev. Lett. 74 (1995) 2626 [arXiv:hep-ex/9503002].
[2] A. Abachi et al., D0 Collaboration, Observation of the top quark, Phys. Rev. Lett. 74 (1995) 2632 [arXiv:hep-ex/9503003].
[3] R. Frederix and F. Maltoni, Top pair invariant mass distribution: A Window on new physics, JHEP 01 (2009) 047 [arXiv:0712.2355].
[4] V. Barger, T. Han and D. G. E. Walker, Top Quark Pairs at High Invariant Mass: A Model-Independent Discriminator of New Physics at the LHC, Phys. Rev. Lett. 100 (2008) 031801 [arXiv:hep-ph/0612016].
[5] J. A. Aguilar-Saavedra, Effective four-fermion operators in top physics: A Roadmap, Nucl. Phys. B 843 (2011) 638 [arXiv:1008.3562].
[6] C. Zhang and S. Willenbrock, Effective-Field-Theory Approach to Top-Quark Production and Decay, Phys. Rev. D 83 (2011) 034006 [arXiv:1008.3869].
[7] C. T. Hill, Topcolor assisted technicolor, Phys. Lett. B 345 (1995) 483 [arXiv:hep-ph/9411426].
[8] J. Cao, G. Liu and J. M. Yang, Probing topcolor-assisted technicolor from like-sign top pair production at CERN LHC, Phys. Rev. D 70 (2004) 114035 [arXiv:hep-ph/0409334]. [9] J. A. Aguilar-Saavedra, Portrait of a colour octet, JHEP 08 (2014) 172 [arXiv:1405.5826]. [10] W. Bernreuther and Z.-G. Si, Top quark and leptonic charge asymmetries for the Tevatron
and LHC, Phys. Rev. D 86 (2012) 034026 [arXiv:1205.6580].
[11] M. Czakon, P. Fiedler, and A. Mitov, Resolving the Tevatron top quark forward-backward asymmetry puzzle [arXiv:1411.3007].
[12] J. S. Brodsky et al., Application of the Principle of Maximum Conformality to the Top-Quark Charge Asymmetry at the LHC, Phys. Rev. D 90 (2014) 114034 [arXiv:1410.1607].
[13] P. H. Frampton and S. L. Glashow, Chiral Color: An Alternative to the Standard Model, Phys. Lett. B 190 (1987) 157.
[14] P. Ferrario and G. Rodrigo, Massive color-octet bosons and the charge asymmetries of top quarks at hadron colliders, Phys. Rev. D 78 (2008) 094018 [arXiv:0809.3354].
[15] J. A. Aguilar-Saavedra and M. Perez-Victoria, Probing the Tevatron t¯t asymmetry at LHC, JHEP 05 (2011) 034 [arXiv:1103.2765].
[16] A. Falkowski et al., Data driving the top quark forward-backward asymmetry with a lepton-based handle, Phys. Rev. D 87 (2013) 034039 [arXiv:1212.4003].
[17] J. A. Aguilar-Saavedra et al., Asymmetries in top quark pair production, (2014) [arXiv:1406.1798].
[18] ATLAS Collaboration, Measurement of the top quark pair production charge asymmetry in proton-proton collisions at√s = 7 TeV using the ATLAS detector, JHEP 02 (2014) 107 [arXiv:1311.6724].
[19] CMS Collaboration, Inclusive and differential measurements of the t¯t charge asymmetry in proton-proton collisions at 7 TeV, Phys. Lett. B 717 (2012) 129 [arXiv:1207.0065].
[20] CMS Collaboration, Measurements of the t¯t charge asymmetry using the dilepton decay channel in pp collisions at√s = 7 TeV, JHEP 04 (2014) 191 [arXiv:1402.3803].
[21] ATLAS and CMS Collaborations, Combination of ATLAS and CMS t¯t charge asymmetry measurements using LHC proton-proton collisions at√s = 7 TeV,
ATLAS-CONF-2014-012, CMS-PAS-TOP-14-006,https://cds.cern.ch/record/1670535
(2014).
[22] T. Aaltonen et al., CDF Collaboration, Evidence for a Mass Dependent Forward-Backward Asymmetry in Top Quark Pair Production, Phys. Rev. D 83 (2011) 112003
[arXiv:1101.0034].
[23] V. M. Abazov et al., D0 Collaboration, Forward-backward asymmetry in top quark-antiquark production, Phys. Rev. D 84 (2011) 112005 [arXiv:1107.4995].
[24] T. Aaltonen et al., CDF Collaboration, Measurement of the top quark forward-backward production asymmetry and its dependence on event kinematic properties, Phys. Rev. D 87 (2013) 092002 [arXiv:1211.1003].
[25] T. Aaltonen et al., CDF Collaboration, Measurement of the leptonic asymmetry in t¯t events produced in p¯p collisions at √s = 1.96 TeV, Phys. Rev. 88 (2013) 072003 [arXiv:1308.1120]. [26] T. Aaltonen et al., CDF Collaboration, Measurement of the inclusive leptonic asymmetry in
top-quark pairs that decay to two charged leptons at CDF, Phys. Rev. Lett. 113 (2014) 042001 [arXiv:1404.3698].
[27] V. M. Abazov et al., D0 Collaboration, Measurement of the forward-backward asymmetry in the distribution of leptons in t¯t events in the lepton+jets channel, Phys. Rev. D 90
(2014) 072001 [arXiv:1403.1294].
[28] V. M. Abazov et al., D0 Collaboration, Measurement of the forward-backward asymmetry in top quark-antiquark production in p¯p collisions using the lepton+jets channel, Phys. Rev. D 90 (2014) 072011 [arXiv:1405.0421].
[29] ATLAS Collaboration, The ATLAS Experiment at the CERN Large Hadron Collider, JINST 3 (2008) S08003.
[30] S. Frixione, P. Nason and C. Oleari, Matching NLO QCD computations with Parton Shower simulations: the POWHEG method, JHEP 11 (2007) 070 [arXiv:0709.2092].
[31] P. Nason, A New method for combining NLO QCD with shower Monte Carlo algorithms, JHEP 11 (2004) 040.
[32] S. Frixione, G. Ridolfi and P. Nason, A Positive-weight next-to-leading-order Monte Carlo for heavy flavour hadroproduction, JHEP 09 (2007) 126 [arXiv:0707.3088].
[33] H. L. Lai et al., New parton distributions for collider physics, Phys. Rev. D 82 (2010) 074024 [arXiv:1007.2241].
[34] T. Sjöstrand, S. Mrenna and P. Z. Skands, PYTHIA 6.4 Physics and Manual, JHEP 05 (2006) 026 [arXiv:hep-ph/0603175].
[35] J. Pumplin et al., New generation of parton distributions with uncertainties from global QCD analysis, JHEP 07 (2002) 012 [arXiv:hep-ph/0201195].
[36] P. Z. Skands, Tuning Monte Carlo Generators: The Perugia Tunes, Phys. Rev. D 82 (2010) 074018 [arXiv:1005.3457].