Automatic Detection and Verification of Rumors on
by
Soroush Vosoughi
S.B., Massachusetts Institute of Technology (2008)
M.S., Massachusetts Institute of Technology (2010)
Submitted to the Program in Media Arts and Sciences,
in partial fulfillment of the requirements for the degree of
Doctor of Philosophy
at the
MASSACHUSETTS INSTITUTE OF TECHNOLOGY
June 2015
c
Massachusetts Institute of Technology 2015. All rights reserved.
Author
Program in Media Arts and Sciences,
May 7, 2015
Certified by
Deb K. Roy
Associate Professor
Program in Media Arts and Sciences
Thesis Supervisor
Accepted by
Pattie Maes
Academic Head
Automatic Detection and Verification of Rumors on Twitter
by
Soroush Vosoughi
Submitted to the Program in Media Arts and Sciences, on May 7, 2015, in partial fulfillment of the
requirements for the degree of Doctor of Philosophy
Abstract
The spread of malicious or accidental misinformation in social media, especially in time-sensitive situations such as real-world emergencies can have harmful effects on individuals and society. This thesis develops models for automated detection and verification of rumors (unverified information) that propagate through Twitter. Detection of rumors about an event is achieved through classifying and clustering assertions made about that event. Assertions are classified through a speech-act classifier for Twitter developed for this thesis. The clas-sifier utilizes a combination of semantic and syntactic features to identify assertions with 91% accuracy. To predict the veracity of rumors, we identify salient features of rumors by examining three aspects of information spread: linguistic style used to express rumors, characteristics of people involved in propagating information, and network propagation dy-namics. The predicted veracity of a time series of these features extracted from a rumor (a collection of tweets) is generated using Hidden Markov Models. The verification al-gorithm was tested on 209 rumors representing 938,806 tweets collected from real-world events including the 2013 Boston Marathon bombings, the 2014 Ferguson unrest and the 2014 Ebola epidemic, and many other rumors reported on popular websites that document public rumors. The algorithm is able to predict the veracity of rumors with an accuracy of 75%. The ability to track rumors and predict their outcomes may have practical applica-tions for news consumers, financial markets, journalists, and emergency services, and more generally to help minimize the impact of false information on Twitter.
Thesis Supervisor: Deb K. Roy
Automatic Detection and Verification of Rumors on Twitter
by
Soroush Vosoughi
The following people served as readers for this thesis:
Thesis Reader
Dr. Allen Gorin
Research Associate
Center of Excellence for Human Language Technology
Johns Hopkins University
Visiting Scholar
Laboratory for Social Machines
MIT Media Lab
Thesis Reader
Aral Sinan
David Austin Professor of Management
Associate Professor of Information Technology and Marketing
MIT
Acknowledgments
This thesis is dedicated to the memory of Officer Sean A. Collier of the MIT Police, who gave his life defending the MIT community.
Soroush Vosoughi
I have never been good with words, which is why I find myself in such a delicate conundrum, to give everyone the thanks they deserve for helping me with such a Sisyphean undertaking, the completion of a PhD at MIT.
First and foremost, I would like to thank my advisor, Prof. Deb Roy. I have been doing research in Deb’s group since spring of 2005, as a freshman at MIT. Throughout the years, Deb has provided opportunities for me to work on a vast array of interesting projects; from robots to models of language acquisition, and most recently social networks and complex systems.
I also wish to express my gratitude to my committee, Prof. Sinan Aral and Dr. Allen Gorin, for their support, guidance and feedback throughout this whole process.
Next, I would like to give very special thanks to Kai-yuh Hsiao, who as a Ph.D. student in Deb’s group hired me as a young and inexperienced freshman to work on a very awesome robotics platform called Trisk. Kai-yuh has been a great mentor and friend throughout my more than ten years at MIT and has been a continuing source of inspiration to me. Without Kai-yuh taking a chance with me those many years ago, I would most likely not be where I am today.
Through out my years at MIT, I have met many great friends and worked with amaz-ing colleagues. I would like to thank all the members of the Cognitive Machines group and the Laboratory for Social Machines for making my years at MIT, without a doubt, the best years of my life. Here is a list of my colleagues in random order: Brandon Roy, Jeff Orkin, Philip DeCamp, Karina Lundahl, Hilke Reckman,Rony Kubat, Matt Miller, George Shaw, Joe Wood, Tynan Smith, Kaname Tomite, Stefanie Tellex, Aithne Sheng-Ying Pao, Kleovoulos ”Leo” Tsourides, Sophia Yuditskaya, Thananat Jitapunkul, Mutsumi Sullivan, Yuko Barnaby, Angela Brewster, Michael Fleischman, Tanya Schalchlin, Jethran Guin-ness, Kai-yuh Hsiao, Philipp Robbel, Nick Mavridis, Peter Gorniak, David Wang, Peter Lao, Preeta Bansal, Sophie Chou, James Kondo, Perng-hwa ”Pau” Kung, Prashanth Vija-yaraghavan, Neo Mohsenvand, Heather Pierce, William Powers, Martin Saveski, Russell Stevens and Ivan Sysoev.
Very special thanks go to Dr. Brandon Roy from the Cognitive Machine group and Mostafa ”Neo” Mohsenvand from the Laboratory for Social Machines. Brandon has been a great friend and colleague whose friendship and advise I value very much. Neo, who in addition to having a great technical mind is a great expert in visualization, helped with most of the visualizations in my thesis defense, allowing my work to shine.
My greatest love goes to my girlfriend Julia who is working on her Ph.D. at the white-head Institute for Biomedical Researchat MIT. She has been a source of support, happiness and love in the last year since we met.
Last, but certainly not least, I would like to thank my dad, mom, brother and sister, whose continued support and encouragement saw me through more than ten years at MIT.
Contents
1 Introduction 19 1.1 Terminology . . . 21 1.1.1 Twitter . . . 21 1.1.2 Retweet . . . 21 1.1.3 Favorite . . . 21 1.1.4 Verified User . . . 21 1.1.5 Followers . . . 22 1.1.6 Followees . . . 22 1.1.7 Follower Graph . . . 22 1.2 What is a Rumor? . . . 221.3 Approach and Contributions . . . 23
1.3.1 System Overview . . . 24
1.4 Overview of Chapters . . . 25
2 Related Work 27 2.1 Role of Twitter in Real-World Emergencies . . . 27
2.2 Natural Language Processing . . . 28
2.3 Modelling Cascades in Networks . . . 30
2.4 Predicting the Veracity of Information . . . 30
3 Rumor Detection 33 3.1 Assertion Detection . . . 33
3.1.1 Tweet Acts: A Speech Act Classifier for Twitter . . . 35
3.1.2 Problem Statement . . . 37
3.1.3 Data Collection and Datasets . . . 40
3.1.4 Features . . . 42
3.1.5 Supervised Speech Act Classifier . . . 51
3.1.6 Analysis . . . 53
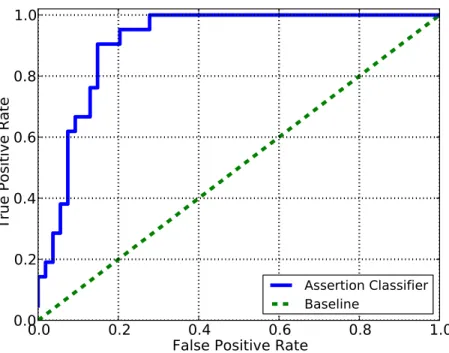
3.1.7 Detecting Assertions . . . 55
3.2 Clustering of Assertions . . . 57
4 Rumor Verification 63
4.1 Methodology . . . 64
4.2 Data Collection and Datasets . . . 65
4.3 Features . . . 70
4.3.1 Linguistic . . . 72
4.3.2 User Identities . . . 76
4.3.3 Propagation Dynamics . . . 79
4.4 Models . . . 90
4.4.1 Dynamic Time Warping . . . 91
4.4.2 Hidden Markov Model . . . 93
4.5 Evaluation . . . 95
4.5.1 Model Performance . . . 97
4.5.2 Contribution of Features . . . 99
4.5.3 Accuracy vs Latency . . . 101
4.6 A Tale of Two Rumors . . . 103
4.7 Anatomy of Rumors in Twitter . . . 107
5 Real-World Applications of the System 109 5.1 Bandwidth Reduction . . . 109
5.2 Priority Queue . . . 110
5.3 Rumor Analytics Dashboard . . . 111
6 Conclusions 113 6.1 Future Directions . . . 113
6.2 Contributions . . . 115
6.3 Concluding Remarks . . . 116
A Enhanced Twitter Sentiment Classification Using Contextual Information 117 A.1 Introduction . . . 117
A.2 Approach . . . 119
A.3 Data Collection and Datasets . . . 121
A.3.1 Emoticon-based Labelled Dataset . . . 121
A.3.2 Human Labelled Dataset . . . 121
A.3.3 Data Preparation . . . 122
A.4 Baseline Model . . . 123
A.5 Contextual Model . . . 125
A.6 Sentiment in Context . . . 126
A.6.1 Spatial . . . 127
A.6.2 Temporal . . . 129
A.6.3 Authorial . . . 130
List of Figures
1-1 The pipeline of the rumor detection and verification system. The inputs and outputs are shown in yellow and the detection and verification subsystems in green. The rumor detection subsystem is named Hearsift and the the rumor verification subsystem is named Rumor Gauge. . . 25 3-1 The pipeline of Hearsift, the rumor detection subsystem. The input to the
subsystem is a collection of tweets about an event specified by the user through a boolean query (Boston AND Bombing in this illustration). Hear-sift consists of two major parts, an assertion detector and a hierarchical clustering module. Raw tweets about an event feed directly into the asser-tion detector, which filters the tweets for only those containing asserasser-tions. The output of the assertion detector feeds directly into the hierarchical clus-tering module, the output of which is a collection of rumors. . . 34 3-2 Two example tweets. Tweet (a) contains an assertion, while tweet (b) does
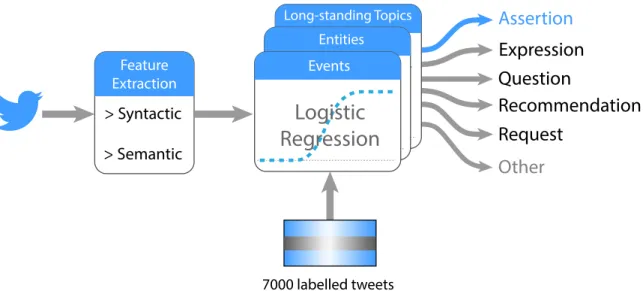
not. . . 35 3-3 The pipeline of the Twitter speech-act classifier which can classify six
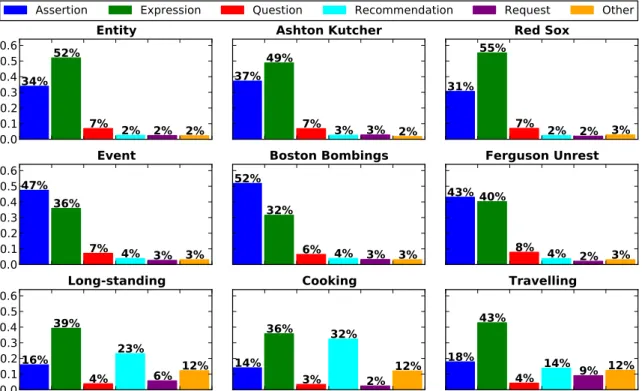
cat-egories of speech-acts, including assertions which are used for rumor de-tection. . . 36 3-4 Distribution of speech acts for all six topics and three types. . . 41 3-5 Example tweets, each containing an example of the semantic features used
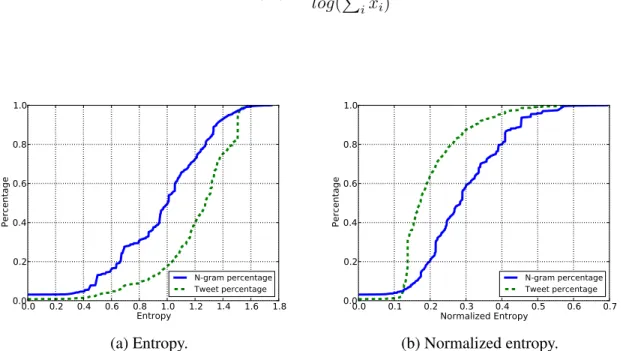
in the Twitter speech-act classifier. . . 42 3-6 Speech act distribution of two example bigrams and their entropies. . . 45 3-7 Percentage of tweets and n-grams for different (a) entropy and (b)
normal-ized entropy cut-off values. . . 46 3-8 Example tweets, each containing an example of the syntactic features used
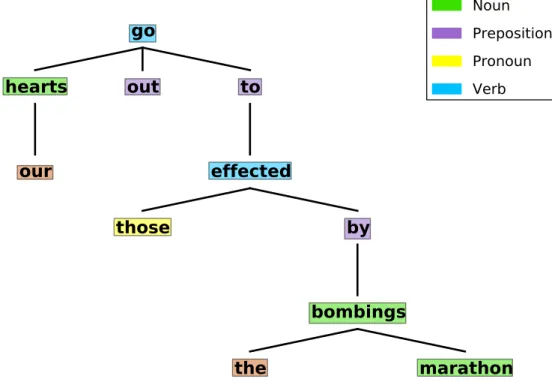
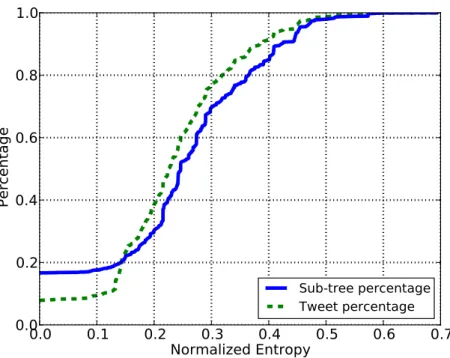
in the Twitter speech-act classifier. . . 47 3-9 The dependency tree and the part of speech tags of a sample tweet. . . 49 3-10 Percentage of tweets and sub-trees for different normalized entropy cut-off
values. . . 50 3-11 The receiver operating characteristic (ROC) curve of the event-specific
3-12 A sample dendrogram depicting hierarchical agglomerative clustering. The algorithm starts by assign each tweet its own cluster. At every step, the most similar clusters are merged (two clusters at a time). At the very root of the tree is a single cluster, containing all the tweets. The user has to pick the level at which the clusters are to be used (called the best partition in the picture). These clusters are what we call rumors. . . 60 4-1 The pipeline of Rumor Gauge, the rumor verification subsystem. The input
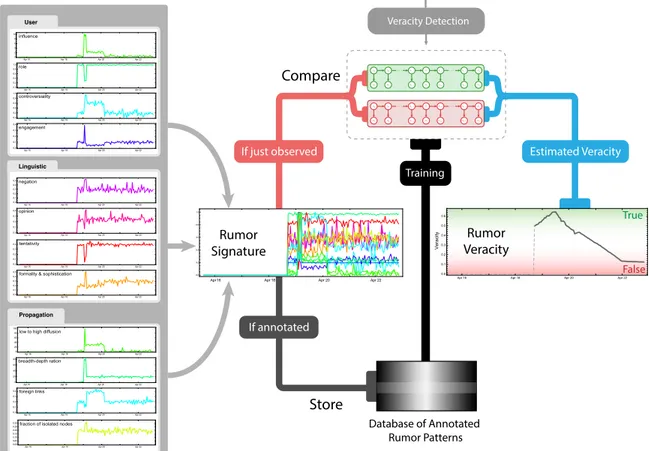
to this subsystem is rumors on Twitter about an event (rumor is defined as a collection of tweets containing similar assertions that have spread over Twitter). Rumor Gauge extracts time-series features about the linguistic content of the rumors, the identity of the users involved in the propagation of the rumors and the propagation dynamics of the rumors. These features are then passed to a Hidden Markov Model (HMM) trained on 209 anno-tated rumors which predicts the veracity of the rumors. . . 64 4-2 An overview of the approach used for predicting the veracity of rumors.
As a rumor spreads, at every time-step several time-series features are ex-tracted from the rumor and passed to HMMs trained on false and true ru-mors. Each HMM measures the fitness of the data to its model and returns a probability score. These probability scores are then compared to predict the veracity of the rumor for each time step. Over time the system generates a veracity curve. . . 66 4-3 The count distribution of the 209 rumors used for training and evaluating
Rumor Gauge. The x-axis corresponds to the number of tweets (binned) and the y-axis is the number of rumors that fall in the bins. Note that none of the rumors have less than 1000 tweets. . . 69 4-4 The duration distribution of the 209 rumors used for training and evaluating
Rumor Gauge. The x-axis corresponds to the duration in hours (binned) and the y-axis is the number of rumors that fall in the bins. Note that false rumors have on average a longer duration than true rumors. . . 71 4-5 Two example tweets from the same rumor, both containing assertions. Tweet
(b) however contains a negation, while tweet (a) does not. . . 73 4-6 Controversiality values for different number of positive and negative replies.
This is an example to illustrate the distribution of controversiality scores as a function of positive and negative replies. Note that this is an example il-lustration so the number of positive and negative replies don’t exceed 100, which is not necessarily the case for the users in our dataset. . . 77 4-7 The retweet tree of a tweet as provided by the Twitter API. Each node
represents a user and the x-axis is time. The bird on the top right represents an original tweet and the arrows represent retweets. . . 80
4-8 Using Twitter’s follower graph to infer the correct retweet path of a tweet. The top panel shows the retweet path provided by the Twitter’s API. The middle panel shows that the bottom user is a follower of the middle user but not that of the top user (the user who tweeted the original tweet). The third panel shows that using this information, and the fact that the bottom user retweeted after the middle user, we can infer that the bottom person retweeted the middle person and not the top person. . . 81 4-9 The time-inferred retweet tree of the tree shown in Figure 4-7. Same as in
that figure, each node represents a user and the x-axis is time. The bird on the top right represents an original tweet and the arrows represent retweets. 82 4-10 A rumor is composed of many retweet trees. This figure is a simplified
illustration of what the diffusion of a rumor might look like. Note that the diffusion is composed of several time-inferred diffusion trees. . . 82 4-11 This figure illustrates an enhanced version of the diffusion tree shown in
Figure 4-9 where the size of the nodes correspond to the influence of the users. Here we can more clearly see the concept of low-to-high diffusion. For example, the diffusion between the second and third nodes (from left). As with Figure 4-9, the x-axis represents time. . . 84 4-12 This figure shows a real example of a low-to-high diffusion from the Boston
Marathon bombings. As you can see, the user on the left, with 19.8K followers, was retweeted by the person on the right, with 178K followers (roughly one order of magnitude more influential than the other user). . . . 85 4-13 Two example diffusion trees with same number of nodes, one with a large
fraction of nodes in LCC and one with a relatively lower fraction of nodes in LCC. The blue nodes represent the nodes in the LCC. . . 86 4-14 Two example diffusion trees with same number of nodes, one with deep
chains and one with shallow chains. The blue nodes represent the nodes in the deepest chain. . . 87 4-15 A a sample tweet about the Boston Marathon bombings with a link to an
outside source (CNN). . . 89 4-16 Two example diffusion trees with same number of nodes, one with a large
fraction of isolated nodes and one with a relatively lower fraction of iso-lated nodes. The blue nodes represent the isoiso-lated nodes. . . 90 4-17 An example sketch of dynamic time warping applied to two curves. The
non-linear alignment aspect of DTW can clearly be seen. . . 91 4-18 The evaluation paradigm for rumor verification. This figure illustrates a
sample rumor diffusion in Twitter. The purple vertical lines correspond to the times at which the rumor was verified by trusted sources. We want to evaluate how accurately our models can predict the veracity of a rumor before the first trusted verification (i.e., using the pre-verification signal). . . 96
4-19 An illustration of how jackknife evaluation works. In this example, there are four data points. At each step, a data point is held-out for testing while the other three points are used for training. This process is repeated for all the data points (four times in this example). . . 97 4-20 ROC curves for the HMM model trained on different sets of features. . . 100 4-21 An illustration of the relative contribution of the 17 features used in our
model. These features are in the same order as in Table 4.6. Blue corre-sponds to propagation features, purple to user features and orange to lin-guistic features. . . 102 4-22 Accuracy of the model as a function of latency. All 209 rumors have been
aligned by using the percentage of duration instead of hours. The dashed red line represents trusted verification of the rumors. . . 103 4-23 The prediction of the model as a function of time, for a true rumor about
Ebola. You can see the performance of the model when trained on all the features, the propagation features, the user features and the linguis-tic features. The y-axis shows the veracity prediction of the model. Any value above 0 means the model is predicting the veracity to be true and vice-versa. The background color also corresponds to the prediction of the model, with green corresponding to true and red to false. The saturation of the background colors correspond to confidence, with higher saturation meaning higher confidence. . . 105 4-24 The prediction of the model as a function of time, for a false rumor about
the Ferguson unrest. You can see the performance of the model when trained on all the features, the propagation features, the user features and the linguistic features. The y-axis shows the veracity prediction of the model. Any value below 0 means the model is predicting the veracity to be false and vice-versa. The background color also corresponds to the predic-tion of the model, with green corresponding to true and red to false. The saturation of the background colors correspond to confidence, with higher saturation meaning higher confidence. . . 106 5-1 Logarithmically scaled plot of the bandwidth reduction afforded by the
ru-mor detection and verification system for the Boston Marathon bombings dataset. . . 110 A-1 Percentage of tweets per state in the USA, sorted from lowest to highest. . . 128 A-2 Average sentiment of states in the USA, averaged across three years, from
2012 to 2014. . . 128 A-3 Ranking of US states based on Twitter sentiment vs. ranking of states based
on their well-being index. r = 0.44, p < 0.005. . . 129 A-4 Average sentiment of different days of the week in the USA, averaged
A-5 Average sentiment of different hours of the day in the USA, averaged across three years, from 2012 to 2014. . . 131 A-6 Average sentiment of different months in the USA, averaged across three
years, from 2012 to 2014. . . 131 A-7 Number of users (logarithmic) in bins of 50 tweets. The first bin
corre-sponds to number of users that have less than 50 tweets throughout the three years and so on. . . 132 A-8 Number of users (with at least 50 tweets) per sentiment bins of 0.05,
List of Tables
3.1 Example tweets for each speech act type. . . 39 3.2 Number of agreed-upon annotated tweets per topic. . . 40 3.3 F1 scores for each speech act category. The best scores for each category
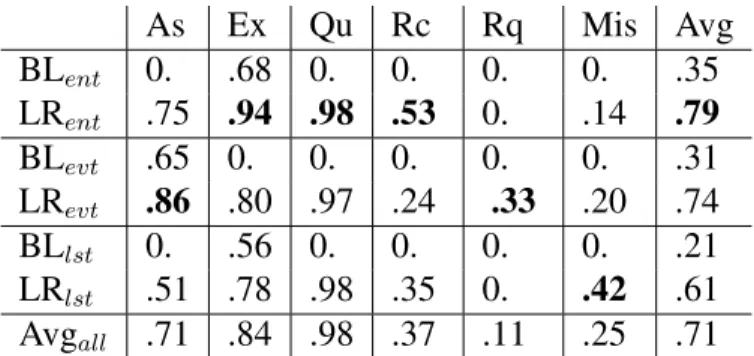
are highlighted. . . 52 3.4 F1 scores for each speech act category for all three topic types and their
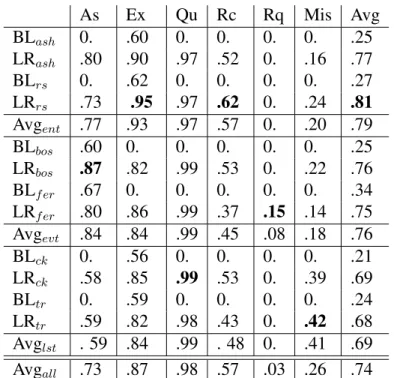
average. (ent=entity, evt=event, lst=long-standing.) . . . 53 3.5 F1 scores for each speech act category for all six topics and their
aver-age. (ash=Ashton Kutcher, rs=Red Sox, bos=Boston Marathon bombings, fer=Ferguson riots, ck=cooking, tr=travelling.) . . . 54 3.6 F1 scores for each speech act category for semantic and syntactic features. . 55 4.1 Distribution of manually annotated rumors used for training and evaluating
the rumor verification system. . . 68 4.2 The rounded average number of tweets for each class of rumors, for each
event. . . 68 4.3 The average duration of rumors (in hours) for each class of rumors, for each
event. . . 70 4.4 Accuracy of Rumor Gauge models and a few baselines. . . 98 4.5 Accuracy of Rumor Gauge using each of the three feature categories
inde-pendently. . . 99 4.6 The contribution of each of the 17 features to out model. Blue corresponds
to propagation features, purple to user features and orange to linguistic features. . . 101 A.1 List of emoticons. . . 120 A.2 Confusion matrix between human-labelled and emoticon-labelled tweets. . 122 A.3 Classifier accuracy, sorted from worst to best. . . 134
Chapter 1
Introduction
The reports of my death have been greatly exaggerated.
Mark Twain
In the last decade the Internet has become a major player as a source for news. A study by the Pew Research Center has identified the Internet as the most important resource for the news for people under the age of 30 in the US and the second most important overall after television [11]. More recently, the emergence and rise in popularity of social media and networking services such as Twitter, Facebook and Reddit have greatly affected the news reporting and journalism landscapes. While social media is mostly used for everyday chatter, it is also used to share news and other important information [38, 66]. Now more than ever, people turn to social media as their source of news [54, 96, 52]; this is especially true for breaking-news situations, where people crave rapid updates on developing events in real time. As Kwak et al. (2010) have shown, over 85% of all trending topics1on Twitter
are news [52]. Moreover, the ubiquity, accessibility, speed and ease-of-use of social media have made them invaluable sources of first-hand information. Twitter for example has proven to be very useful in emergency and disaster situations, particularly for response and recovery [100]. However, the same factors that make social media a great resource
for dissemination of breaking-news, combined with the relative lack of oversight of such services, make social media fertile ground for the creation and spread of unsubstantiated and unverified information about events happening in the world.
This unprecedented shift from traditional news media, where there is a clear distinction between journalists and news consumers, to social media, where news is crowd-sourced and anyone can be a reporter, has presented many challenges for various sectors of society, such as journalists, emergency services and news consumers. Journalists now have to compete with millions of people online for breaking-news. Often time this leads journalists to fail to strike a balance between the need to be first and the need to be correct, resulting in an increasing number of traditional news sources reporting unsubstantiated information in the rush to be first [12, 13]. Emergency services have to deal with the consequences and the fallout of rumors and witch-hunts on social media, and finally, news consumers have the incredibly hard task of sifting through posts in order to separate substantiated and trust-worthy posts from rumors and unjustified assumptions. A case in point of this phenomenon is the social media’s response to the Boston Marathon bombings. As the events of the bombings unfolded, people turned to social media services like Twitter and Reddit to learn about the situation on the ground as it was happening. Many people tuned into police scanners and posted transcripts of police conversations on these sites. As much as this was a great resource for the people living in the greater Boston, enabling them to stay up-to-date on the situation as it was unfolding, it led to several unfortunate instances of false rumors being spread, and innocent people being implicated in witch-hunts [51, 56, 99]. Another example of such phenomenon is the 2010 earthquake in Chile where rumors propagated in social media created chaos and confusion amongst the news consumers [64].
What if there was a tool that could not only detect rumors as they spread on Twitter but also predict the veracity of these rumors? This was the genesis of Hearsift and Rumor Gauge, tools for detection and verification of rumors respectively and the focus of this thesis.
1.1
Terminology
This thesis focuses on rumors that spread on Twitter. As such, we need to define several Twitter specific terms before we proceed any further. These terms will be used through out this thesis.
1.1.1
Twitter is a micro-blogging platform has become a major social media platform with hun-dreds of millions of users. Twitter is a social network where users can publish and exchange short messages of up to 140 characters long, also known as tweets. The ubiquity, acces-sibility, speed and ease-of-use of Twitter have made it an invaluable communication tool. People turn to Twitter for a variety of purposes, from everyday chatter to reading about breaking news [38].
1.1.2
Retweet
A retweet is a repost or forward of a tweet by another user. It is indicated by the characters RT.
1.1.3
Favorite
Favorites are used by users when they like a tweet. By favoriting a tweet a user can let the original poster know that you liked their tweet. The total number of times a tweet has been favorited is visible to everyone.
1.1.4
Verified User
A verified Twitter user is a user that Twitter has confirmed to be the real. Verification is done by Twitter to establish authenticity of identities of key individuals and brands. The verified status of a user is visible to everyone.
1.1.5
Followers
The followers of a user are other people who receive the user’s tweets and updates. When a user is followed by someone, it will show up in their followers list. The total number of followers a user has is visible to everyone.
1.1.6
Followees
The followees of a user are other people who the user followers. The total number of followees a user has is also visible to everyone.
1.1.7
Follower Graph
The graph of users on Twitter and their follower relationship. The nodes in the graph are users and the directional edges represent follower relationship between users.
1.2
What is a Rumor?
Before we proceed with the explanation of our algorithms for rumor detection and verifi-cation, we need to provide a clear definition of rumors. We define a rumor to an unverified assertion that starts from one or more sources and spreads over time from node to node in a network. On Twitter, a rumor is a collection of tweets, all asserting the same unverified statement (however the tweets could be, and almost assuredly, are worded differently from each other), propagating through the communications network (in this case Twitter), in a multitude of cascades.
A rumor can end in three ways: it can be resolved as either true (factual), false (non-factual) or remain unresolved. There are usually several rumors about the same topic, any number of which can be true or false. The resolution of one or more rumors automatically resolves all other rumors about the same topic. For example, take the number of perpetra-tors in the Boston Marathon bombings; there could be several rumors about this topic:
1. Only one person was responsible for this act.
2. This was the work of at least 2 or more people.
3. There are only 2 perpetrators.
4. It was at least a team of 5 that did this.
Once rumor number 3 was confirmed as true, it automatically resolved the other rumors as well. (In this case, rumors 1 and 4 resolved to be false and rumor 2 resolved to be true.) For the purposes of this thesis, we only consider rumors that spread on Twitter.
1.3
Approach and Contributions
This thesis develops models for detection and verification of rumors (i.e. unverified in-formation) that propagate on Twitter. Detection of rumors about an event is achieved through classifying and clustering assertions made about that event. Assertions are clas-sified through a state-of-the-art speech-act classifier for Twitter developed for this thesis. The classifier is a logistic regression that utilizes a combination of semantic and syntac-tic features and can identify assertions with 91% accuracy. For verification, we identified salient characteristics of rumors by examining three aspects of diffusion: linguistics, the users involved, and the temporal propagation dynamics. We then identified key differences in each of the three characteristics in the spread of true and false rumors. A time series of these features extracted for a rumor can be classified as predictive of the veracity of that rumor using Hidden Markov Models. The verification algorithm was trained and evaluated on 209 rumors collected from real-world events: the 2013 Boston Marathon bombings, the 2014 Ferguson unrest and the 2014 Ebola pandemic, plus many other rumors reported on Snopes.com and FactCheck.org (websites documenting rumors). The system can predict the veracity of rumors with an accuracy of 75% before verification by trusted channels (trustworthy major governmental or news organizations). The ability to track rumors and
predict their outcomes can have immediate real-world relevance for news consumers, fi-nancial markets, journalists, and emergency services, and help minimize the impact of false information on Twitter.
Automatic detection and verification of rumors in Twitter are very difficult tasks. Anal-ogous in many ways to speech recognition, they both require extracting weak signals from very noisy environments. Additionally, it is near impossible to get perfect accuracy in both domains. So in addition to accuracy, an insightful way of measuring the performance of our system is to measure the bandwidth reduction of information afforded by our system. This is a theme that we will come back to throughout this thesis. Bandwidth reduction is an important measurement because it can help demonstrate the usefulness and utility of our system in real-world situations. For example, a journalist trying to sort out false and true information from millions of tweets about a real-world event (as was the case with the Boston Marathon bombings), has a Sisyphean task. However, as will be shown in great detail later in this thesis, our system can make the task much less daunting and more man-ageable for our hypothetical journalist by greatly reducing the amount of information he or she has to sort through.
1.3.1
System Overview
Figure 1-1 shows the general pipeline of our system. As can be seen, the system has two major parts, Hearsift (rumor detection) and Rumor Gauge (rumor verification). The input to Hearsift is the raw tweets about an event of interest, with the output being clusters of tweets with each cluster containing tweets that have propagated through Twitter and that make similar assertions about the event in question (e.g., in the case of the Boston Marathon bombings, the tweets making the assertion that there is a third bomb at Harvard square would all be clustered together). From here on these clusters will be called rumors. These rumors are the input to the Rumor Gauge algorithm, the output of which are a veracity curve for each rumor indicating the likelihood that the rumor is false or true over time (the algorithm generated a veracity score at every time-step). It should be noted that the system
presented here is modular, meaning that each of the two parts can be replaced by other similar systems. For example, Hearsift can be replaced by other rumor detection systems, without effecting the internal workings of Rumor Gauge and vice-versa.
Rumor Verification Rumor
Detection Raw
Tweets Rumors PredictionVeracity
Figure 1-1: The pipeline of the rumor detection and verification system. The inputs and outputs are shown in yellow and the detection and verification subsystems in green. The rumor detection subsystem is named Hearsift and the the rumor verification subsystem is named Rumor Gauge.
1.4
Overview of Chapters
The rest of this document is organized as follows: • Chapter 2 review related work.
• Chapter 3 describes the rumor detection subsystem and its evaluation in detail. • Chapter 4 describes the rumor verification subsystem and its evaluation in detail. • Chapter 5 discusses hypothetical real-world applications for the systems presented in
this thesis.
Chapter 2
Related Work
This thesis develops a system for detection and verification of rumors about real-world events that propagate on Twitter. Related work includes work on the role of Twitter in real-world emergencies, work from the field of natural language processing about capturing the syntactic and semantic structure of language, work from the field of network science about the diffusion and propagation of information in social networks, and the relatively new work on veracity prediction on Twitter and other domains.
2.1
Role of Twitter in Real-World Emergencies
In addition to being a medium for conversation and idle chatter, Twitter is also used as a source of new for many people [38, 1, 66]. A study by Kwak et al. [52] shows that the majority of trending topics on Twitter are news related. Several bodies of work have shown that Twitter can be used to detect and locate breaking news [86, 88], and to track epidemics [55]. Moreover, the use of Twitter during real-world emergencies has also been studied. These studies have shown the effectiveness of Twitter for reporting breaking news and response and recovery efforts during floods [100, 101, 95], earthquake [47, 26], forest fires [22], and hurricanes [37]. One particular study about wildfires in California [78] outlines the great value Twitter has as a medium to report breaking news more rapidly than
mainstream media outlets. Inspired by the close correlation between Twitter activity and real-world events (especially in the case of earthquakes) a new term, Twicalli scale1, was
created by researchers for measuring the Twitter impact of real-world events.
2.2
Natural Language Processing
Since this thesis works with Twitter data, we will limit our literature review to relevant nat-ural language processing techniques developed for the Twitter domain. There has been ex-tensive work done on computational methods for analysing the linguistic content of tweets. These works have almost entirely focused on the semantics (e.g., sentiment classification [73]) and the syntactic (e.g., part-of-speech tagging [71]) aspects of tweets. Particularly, sentiment analysis and classification of text has been well studied for Twitter. Most of the work on Twitter sentiment classification either focus on different machine learning tech-niques (e.g., [104] [104], [40] [40]), novel features (e.g., [21] [21], [49] [49], [85] [85]), new data collection and labelling techniques (e.g., [34] [34]) or the application of senti-ment classification to analyse the attitude of people about certain topics on Twitter (e.g., [24] [24], [7] [7]). These are just some examples of the extensive research already done on Twitter sentiment classification and analysis.
Sentiment classification is one of the many language processing techniques that are developed in this thesis, however, more sophisticated techniques such as speech-act clas-sification and the quantification of formality and sophistication of the language used in tweets are also developed in this thesis.
There has been extensive research done on speech act (also known as dialogue act) classification in computational linguistics, e.g., [97, 31, 2, 39]. There are two major an-notated corpora used for speech act annotation which all of the research listed use. The Switchboard-DAMSL [42] or SWBD, and the Meeting Recorder Dialog Act [23] or MRDA. SWBD provides an annotation scheme for labelling dialog or speech acts from phone
versations. It also contains labelled speech act data collected from telephone conversations. Similarly, the MRDA corpus provides an annotation scheme and labelled speech act data for face-to-face meetings with multiple parties.
Unfortunately, these annotation schemes and annotated datasets (and some of the method-ologies used to analyse them) do not map well to Twitter, given the noisy and unconven-tional nature of the language used on the platform. As far as we know, there is no publicly available dataset of labelled speech acts for Twitter. Moreover, the only published work on Twitter speech act classification that we are aware of is the work of Zhang et al. on super-vised [108] and semi-supersuper-vised [109] speech act classification. Our work in this paper is closely related to their supervised speech act classifier. However, Zhang et al. limit their features to a set of words, n-gram phrases and symbols. They do not take into account the rich syntactic structure of the tweets in their classification as their use of syntax is limited to punctuation and a few Twitter specific characters. In their paper, they claim that the noisy nature of Twitter makes the use of syntactic sub-trees, as was done by Jeong et al. [39] in their work on speech act recognition in Emails, impractical.
However, recent advances in Twitter parsers [48] and part-of-speech taggers [71] have made it possible to extract the syntactic structure of tweets with relative ease, without having to normalize the texts as was suggested by Kaufmann and Kalita [46]. In this thesis, we utilized these new tools to create a set of novel syntactic and semantic features. These features are used to train a supervised speech act classifier, using a manually annotated dataset of a few thousand tweets. This combined set of semantic and syntactic features help us achieve state-of-the-art performance for Twitter speech-act classification. This Twitter speech-act classifier is the basis for the rumor detection system presented in this thesis.
As far as we know, there has been very work on measuring the sophistication and for-mality of language used on Twitter. The most relevant research is work that attempt to detect non-literal text (text that is not supposed to be taken at face value) such as sarcasm [50], satire [9] and hostility (flames) [93] through a combination of semantic and sentiment analytic techniques.
2.3
Modelling Cascades in Networks
There has been extensive work done on modelling the spread of information in networks. The research in this area has mainly focused on modelling various diffusion and cascade structures [17, 35], the spread of “epidemics” [74, 68, 33, 55, 44], knowledge [17], behavior [14] and propaganda [82]. Work has also been done on identifying influential players in spreading information through a network [105, 4, 110, 3] and identifying sources of information [91].
In a work more directly related to our research direction, Mendoza et al, have looked at the difference in propagation behaviour of false rumors and true news on Twitter [64]. Additionally, Friggeri et al. [30] and Jin et al. [41] have analysed the cascade and propa-gation structures of rumors on social networks. Specifically, Jin et al. analyzed the spread of rumors surrounding the Ebola pandemic and found that rumors can spread just like true news. In all of these cases the properties of the actual entity that is being spread–be it a message, knowledge, or a virus– is never analysed or taken into consideration in the mod-els. In contrast, our work will be looking at the content of the messages being spread in addition to the propagation behaviour of these messages and any information that might be available about the agents involved in the propagation.
2.4
Predicting the Veracity of Information
The field of veracity prediction on social media is a relatively new one. There have so far been only a handful of works that address this problem. Most relevant are the works of Castillo et al. [10] and Kwon et al. [53]. These works deal with propagation of ru-mors and misinformation on Twitter. Castillo et al. study the propagation of ruru-mors during real-world emergencies while Kwon et al. study the propagation of urban legends (such as bigfoot) on Twitter. The works of Castillo et al. and Kwon et al. propose a combination of linguistics and propagation features that can be used to approximate credibility of in-formation on Twitter. However, Kwon et al.’s work does not deal with rumors surrounding
real-world events and Castillo et al.’s work only approximates users’ subjective perceptions of credibility on Twitter (i.e. whether users believe the tweets they are reading); they do not focus on objective credibility of messages.
There has also been research done on verification of information on domains other than Twitter. Yang et al. [107] have done work similar to Castillo’s work on Sina Weibo, China’s leading micro-blogging service. The Washington Post’s TruthTeller2which attempts to fact
check political speech in real time utilizes various natural language processing techniques to retrieve relevant information from text (or transcribed speech) and compares the infor-mation against a database of known-fact.
Chapter 3
Rumor Detection
The general pipeline of the rumor detection and verification system is shown in 1-1. As can be seen in that figure, the system is composed of two main subsystems for rumor detection and rumor verification. This chapter will describe in detail the rumor detection subsystem. An overview of the rumor detection subsystem, henceforth referred to as Hearsift can be seen in Figure 3-1. The input to Hearsift is a collection of tweets about an event specified by the user through a boolean query (Boston AND Bombing in this illustration). Hearsift consists of two major parts, an assertion detector and a hierarchical clustering module. Raw tweets about an event feed directly into the assertion detector, which filters the tweets for only those containing assertions. The output of the assertion detector feeds directly into the hierarchical clustering module, the output of which is a collection of clusters. These clusters contain messages that have propagated through Twitter in a multitude of cascades, which we call a rumor. The first part of this chapter describes the assertion detection module and the second part describes the hierarchical clustering module.
3.1
Assertion Detection
An assertion is an utterance that commits the speaker to the truth of the expressed proposi-tion. Figure 3-2 shows two tweets about the Boston Marathon bombings. The tweet shown
e.g. Boston AND Bombing
Query
All the matching tweets
Filtered Tweets that contain assertions
Assertion Detection Hierarchical Clustering Best Partition Rumors Rumors 1 Rumors 2 Rumors 3 Time
Figure 3-1: The pipeline of Hearsift, the rumor detection subsystem. The input to the subsystem is a collection of tweets about an event specified by the user through a boolean query (Boston AND Bombing in this illustration). Hearsift consists of two major parts, an assertion detector and a hierarchical clustering module. Raw tweets about an event feed directly into the assertion detector, which filters the tweets for only those containing assertions. The output of the assertion detector feeds directly into the hierarchical clustering module, the output of which is a collection of rumors.
in Figure 3-2a contains an assertion while the tweet shown in Figure 3-2b does not. More generally, assertions are a class of speech-acts. Speech-acts have performative function in language and communication. For instance, we perform speech acts when we offer an apology, greeting, request, complaint, invitation, compliment, or refusal (to name a few). In order to detect assertions in tweets, we require a speech-act classifier for Twitter. Un-fortunately, although there has been extensive work done on computational methods for analysing the linguistic content of tweets, these works have almost entirely focused on the semantics (e.g., sentiment classification [73]) and the syntactic (e.g., part-of-speech tagging [71]) aspects of tweets. There has been very little work done on classifying the pragmat-ics of tweets. Pragmatpragmat-ics looks beyond the literal meaning of an utterance and considers how context and intention contribute to meaning. Speech-acts fall under the definition of pragmatics.
Given the absence of a suitable speech-act classifier for Twitter, a general purpose speech-act classifier for Twitter was developed for this thesis [102]. This classifier can identify several different speech-acts in tweets, including assertions.
(a) An assertion. (b) Not an assertion.
Figure 3-2: Two example tweets. Tweet (a) contains an assertion, while tweet (b) does not.
3.1.1
Tweet Acts: A Speech Act Classifier for Twitter
Speech acts are a way to conceptualize speech as action. This holds true for communi-cation on any platform, including social media platforms such as Twitter. In this section of the thesis, we explore speech act recognition on Twitter by treating it as a multi-class
classification problem. We created a taxonomy of six speech acts for Twitter and propose a set of semantic and syntactic features. We trained and tested a logistic regression clas-sifier using a data set of manually labelled tweets. Our method achieved a state-of-the-art performance with an average F1 score of more than 0.70. We also explored classifiers with three different granularities (Twitter-wide, type-specific and topic-specific) in order to find the right balance between generalization and over-fitting for our task. Figure 3-3 shows an overview of the Twitter speech-act classifier.
Feature Extraction > Syntactic > Semantic
Assertion
Expression
Question
Recommendation
Request
Other
7000 labelled tweets Events Entities Long-standing TopicsLogistic
Regression
Figure 3-3: The pipeline of the Twitter speech-act classifier which can classify six cate-gories of speech-acts, including assertions which are used for rumor detection.
Note that in addition to allowing us to detect assertions for the purposes of rumor detec-tion, this classifier can be used in other tasks to better understand the meaning and intention behind tweets and uncover the rich interactions between the users of Twitter. Knowing the speech acts behind a tweet can help improve analysis of tweets and give us a better un-derstanding of the state of mind of the users. Additionally, speech acts can help improve various language processing algorithms such as sentiment classification, topic modelling and assertion tracking. For example, knowing that a tweet is ”expressing a feeling” can help in sentiment analysis. Similarly, knowing that a tweet is ”making a statement” can help in tracking the assertions being made about events and people. Finally, knowing the distribution of speech acts of tweets about a particular topic can reveal a lot about the
general attitude of users about that topic (e.g., are they confused and are asking a lot of questions? Are they outraged and demanding action? Etc).
3.1.2
Problem Statement
Speech act recognition is a multi-class classification problem. As with any other supervised classification problem, we need a large labelled dataset. In order to create such a dataset first we need to create a taxonomy of speech acts for Twitter by identifying and defining a set of commonly occurring speech acts. Next, we need to manually annotate a large collection of tweets using our taxonomy. For our Twitter speech act classifier we assume that there is only one speech act associated with each tweet. This is a valid assumption to make as a starting point given the short nature of communications on Twitter (limited to 140 characters), though we recognize that tweets may sometimes contain multiple acts.
Our primary task is to use the expertly annotated dataset to analyse and select various syntactic and semantic features derived from tweets that are predictive of their correspond-ing speech acts. Uscorrespond-ing our labelled dataset and robust features we can train standard, off-the-shelf classifiers (such as SVMs, Naive Bayes, etc) for our speech act recognition task.
A Taxonomy of Twitter Speech Acts
Using Searle’s speech act taxonomy [89] as the basis and taking into account the taxonomy used by Zhang et al. [108] for their supervised Twitter speech act classifier, we established a list of six speech act categories that are commonly seen on Twitter. Below we provide the definition and examples (Table 3.1) for each of these speech acts:
• Assertion: Similar to Searle’s assertive type, an assertion is a tweet that commits the speaker to the truth of the expressed proposition. So an assertion can be assessed by the ”truth value” of its proposition. As Searle puts it, ”The simplest test of an assertive is this: you can literally characterize it (inter alia) as true or false.” [90].
Examples of assertions include: insisting, stating, hypothesizing, etc.
• Recommendation: Based on Searle’s definition of advise which falls under his di-rectivespeech act category (directives are acts with the point of getting the hearer to do something). Tweets that recommend (or condemn) things (such as links) or give advise about a situation fall under this category.
• Expression: Based on Searle’s expressive type, expressions are tweets that express the speaker’s attitudes and emotions towards something. Examples include: cele-brating, deploring, liking, thanking, etc.
• Question: As with recommendation, question falls under the directive type of Searle’s speech acts. Tweets that are asking for information or confirmation lie under this cat-egory.
• Request: Also a directive type, requests are tweets that attempt to get the hearer to do or stop doing something.
• Miscellaneous: There are several speech act types from Searle’s taxonomy that we did not include in our taxonomy. These types include commissives that commit the speaker to some future action (such as promising, pledging, taking an oath, etc) and declaratives that change the world according to the proposition that was declared (such as firing, declaring war, baptising, etc). As with Zhang et al. [108], we could find relatively few examples of these speech acts on Twitter, not enough to warrant a separate category. Therefore we grouped all remaining speech act types into one miscellaneouscategory.
Type and Topic Specific Classification
Given the diversity of topics talked about on Twitter [57, 111], we wanted to explore topic and type dependent speech act classifiers. Previous research on various natural language
Speech Act Example Tweet
Assertion authorities say that the 2 boston bomb suspects are brothers are legal permanent residents of chechen origin - @nbcnews
Recommendation If you follow this man for updates and his opinions on #Ferguson I recommend you unfollow him immediately.
Expression Mila Kunis and Ashton Kutcher are so adorable
Question Anybody hear if @gehrig38 is well enough to attend tonight? #red-sox
Request rt @craigyh999: 3 days until i run the london marathon in aid of the childrens hopsice @sschospices . please please sponsor me here Miscellaneous We’ll continue to post information from #Ferguson throughout the
day on our live-blog
Table 3.1: Example tweets for each speech act type.
processing algorithms (such as sentiment classification), has shown topic, type and category specific approaches to be superior to more general, one-size-fits-all methods [72, 69, 108]. We used Zhao et al.’s [111] definitions for topic and type. A topic is a subject discussed in one or more tweets (e.g., Boston Marathon bombings, Red Sox, global warming, etc). The type characterizes the nature of the topic. Zhao et al. have identified three topic types on Twitter, these are:
• Entity-oriented topics: topics about entities such as celebrities (e.g., Ashton Kutcher), brand names (e.g., Pepsi), sports teams (e.g., Red sox), etc.
• Event-oriented topics: topics about events in the world, most commonly about breaking-news (e.g., Boston Marathon bombings).
• Long-standing topics: topics about subjects that are commonly discussed in every-day talk, such as music, global warming, cooking, travelling, etc.
Although several different categorization schemes for topics types on Twitter have been proposed by others [20, 94, 57], we decided to use Zhao et al.’s scheme because it included
fewer types (only three) whilst still maintaining a logical division of topics on Twitter. It was important for us to not have too fine-grained division of topics since for a supervised classification task we need a sizeable amount of data per category.
3.1.3
Data Collection and Datasets
We selected two topics for each of the three topic types described in the last section for a total of six topics (see Table 3.2 for list of topics). We collected a few thousand tweets from the Twitter public API for each of these topics using topic-specific queries (e.g., #fer-gusonriots, #redsox, etc). We then asked three undergraduate annotators to independently annotate each of the tweets with one of the speech act categories described earlier.
We measured the inter-annotator agreement using Fleiss’ kappa, which calculates the degree of agreement in classification over that which would be expected by chance [28]. The kappa score for the three annotators was 0.68, which means that there were disagree-ments in classification for a good number of the tweets. This is to be expected since our annotators were not expert linguists and because of the noisy and unconventional language used on Twitter. Since the quality of annotation for a supervised classifier is of utmost im-portance, we decided to only use tweets that were labelled the same by all three annotators, which was around 62% of all tweets. Table 3.2 shows the numbers of tweets per topic that all annotators agreed on.
Type Topic # Tweets
Entity Red Sox 1418
Ashton Kutcher 1223
Event Boston bombings 1517
Ferguson unrest 1306
Long-standing Cooking 1098
Travelling 1001
Total 7563
Table 3.2: Number of agreed-upon annotated tweets per topic.
Figure 3-4: Distribution of speech acts for all six topics and three types.
Figure 3-4. There is much greater similarity between the distribution of speech acts of topics of the same type (e.g, Ashton Kutcher and Red Sox) compared to topics of different types. Though each topic type seems to have its own distinct distribution, Entity and Event types have much closer resemblance to each other than Long-standing. Assertions and expressions dominate in Entity and Event types with questions beings a distant third, while in Long-standing, recommendations are much more dominant with assertions being less so. This agrees with Zhao et al.’s [111] findings that tweets about Long-standings topics tend to be more opinionated which would result in more recommendations and expressions and fewer assertions.
The great variance across types and the small variance within types suggests that a type-specific classifier might be the correct granularity for Twitter speech act classification (with topic-specific being too narrow and Twitter-wide being too general). We will explore this in greater detail in the next sections of this paper.
3.1.4
Features
We studied many features before settling on the features below. Our features can be divided into two general categories: Semantic and Syntactic. Some of these features were motivated by various works on speech act classification [39, 108, 109]. Overall we selected 3313 binary features, composed of 1647 semantic and 1666 syntactic features.
Semantic Features
Below we explain the semantic features in great detail. Examples of each semantic feature can be seen in Figure 3-5.
(a) An example of an opinion word be-ing used in a tweet (the word hate).
(b) An example of vulgarity used in a tweet (the word f**k).
(c) An example of an emoticon used in a tweet ((:()).
(d) An example of a speech act verb used in a tweet (the word claim).
(e) An example of an informative n-gram used in a tweet (the phrase I don’t think).
Figure 3-5: Example tweets, each containing an example of the semantic features used in the Twitter speech-act classifier.
Opinion Words
We used the ”Harvard General Inquirer” lexicon1[98], which is a dataset used commonly in sentiment classification tasks, to identify 2442 strong, negative and positive opinion words (such as robust, terrible, untrustworthy, etc). The intuition here is that these opinion words tend to signal certain speech acts such as expressions and recommendations. One binary feature indicates whether any of these words appear in a tweet.
Vulgar Words
Similar to opinion words, vulgar words can either signal great emotions or an informality mostly seen in expressions than any other kind of speech act (least seen in assertions). We used an online collection of vulgar words2to collect a total of 349 vulgar words. A binary
feature indicates the appearance or lack thereof of any of these words.
Emoticons
Emoticons have become ubiquitous in online communication and so cannot be ignored. Like vulgar words, emoticons can also signal emotions or informality. We used an online collection of text-based emoticons3 to collect a total of 362 emoticons. A binary feature indicates the appearance or lack thereof of any of these emoticons.
Speech Act Verbs
There are certain verbs (such as ask, demand, promise, report, etc) that typically signal certain speech acts. Wierzbicka [106] has compiled a total of 229 English speech act verbs divided into 37 groups. Since this is a collection of verbs, it is crucially important to only consider the verbs in a tweet and not any other word class (since some of these words can appear in multiple part-of-speech categories). In order to do this, we used Owoputi et
1http://www.wjh.harvard.edu/ inquirer/ 2http://www.noswearing.com/dictionary 3http://pc.net/emoticons/
al.’s4[71] Twitter part-of-speech tagger to identify all the verbs in a tweet, which were then stemmed using Porter Stemming [77]. The stemmed verbs were then compared to the 229 speech act verbs (which were also stemmed using Porter Stemming). Thus, we have 229 binary features coding the appearance or lack thereof of each of these verbs.
N-grams
In addition to the verbs mentioned, there are certain phrases and non-verb words that can signal certain speech acts. For example, the phrase ”I think” signals an expression, the phrase ”could you please” signals a request and the phrase ”is it true” signals a question. Similarly, the non-verb word ”should” can signal a recommendation and ”why” can signal a question.
These words and phrases are called n-grams (an n-gram is a contiguous sequence of n words). Given the relatively short sentences on Twitter, we decided to only consider unigram, bigram and trigram phrases. We generated a list of all of the unigrams, bigrams and trigrams that appear at least five times in our tweets for a total of 6738 n-grams (4068 unigrams, 1878 bigrams and 792 trigrams). Instead of manually examining and selecting n-grams from the list, we decided to create an automatic process for the selection of n-n-grams so that future extensions of this work can be implemented with greater ease.
The selection starts by removing all n-grams that contained topic-specific terms (such as Boston, Red Sox, etc). Next we removed all n-grams which contained proper nouns (using Owoputi et al.’s [71] part-of-speech tagger). This was an important step since we did not want words or phrases that refer to specific named-entities (such as people, events, places, etc). The next step in the process was the selection of n-grams that are most predictive of the speech act of their corresponding tweets. This was achieved by the calculation of the entropy of each n-gram with respect to the speech act distribution of the tweets that contained them. Entropy is a measure of uncertainty; the more random a source the larger the entropy. So if an n-gram is used evenly in tweets with different speech acts then it will
have a very high entropy and vice versa. Figure 3-6 shows the speech act distribution of two example n-grams with high and low entropies. As can be seen in the figure, n-grams with lower entropies are more predictive of speech acts. For example, if we knew that a tweet contained the phrase ”affected by”, we could guess with high confidence that the phrase is an expression. On the other hand, we would not have a confident guess if the phrase was ”will be”.
Asrt Exp Que Rec Req Misc
0.000 0.001 0.002 0.003 0.004 0.005 0.006 0.007 0.008 0.009
% Tweets Per Speech Act
Entropy=1.48
"will be"
Asrt Exp Que Rec Req Misc
0.000 0.002 0.004 0.006 0.008 0.010 0.012 0.014 0.016
% Tweets Per Speech Act
Entropy=0.16
"affected by"
Figure 3-6: Speech act distribution of two example bigrams and their entropies.
We calculated the entropy of each n-gram using Equation (3.1). Here H(X) is the entropy of the speech act distribution, X, of an n-gram. P (xi) is the probability that the
tweets containing that n-gram are labelled with the speech act xi, with i looping over all
speech acts.
H(X) = − X
i∈speech−acts
P (xi)logP (xi) (3.1)
We wanted to pick the n-grams with the lowest entropy. In order to find a logical cut-off point we sorted the n-grams by their entropy and plotted them (Figure 3-7a). The blue (solid) line in Figure 3-7a corresponds to the percentage of n-grams that would be selected for different entropy cut-off values. However, what we found is that many n-grams with low entropies are used very rarely. The green (dashed) line in Figure 3-7a shows the percentage
of total tweets that would contain one of the n-grams for each entropy cut-off value. This made it very difficult to find a good cut-off value for entropy since a high cut-off point would result in too many n-gram features and a low cut-off point would result in too few commonly seen n-grams.
In order to account for this, we normalized the entropy of each n-gram by the log of the count of the tweets that contained that n-grams (see Equation (3.2)). This means that the more an n-gram is used the lower its normalized entropy or HN would be. Figure 3-7b
shows the plot of HN. We decided that a good cut-off value for normalized entropy would
be 0.2 which would select 21% of the best (lowest HN) n-grams that are collectively seen
in 64% of our tweets. The top 21% of n-grams is made up of 849 unigrams, 453 bigrams and 113 trigrams for a total of 1415 n-grams. There is a binary feature for each of these n-grams indicating their presence or lack thereof.
HN(X) = H(X) log(P ixi) (3.2) 0.0 0.2 0.4 0.6 0.8 1.0 1.2 1.4 1.6 1.8Entropy 0.0 0.2 0.4 0.6 0.8 1.0 Percentage N-gram percentage Tweet percentage (a) Entropy. 0.0 0.1 0.2Normalized Entropy0.3 0.4 0.5 0.6 0.7 0.0 0.2 0.4 0.6 0.8 1.0 Percentage N-gram percentage Tweet percentage (b) Normalized entropy.
Figure 3-7: Percentage of tweets and n-grams for different (a) entropy and (b) normalized entropy cut-off values.
Syntactic Features
Below we explain the syntactic features in great detail. Examples of each syntactic feature can be seen in Figure 3-8.
(a) An example of punctuation being used in a tweet (the symbol !).
(b) An example of Twitter specific char-acters used in a tweet (the symbols RT and @).
(c) An example of abbreviation being used in a tweet (thanx, b4, r).
Figure 3-8: Example tweets, each containing an example of the syntactic features used in the Twitter speech-act classifier.
Punctuations
Certain punctuations can be predictive of the speech act in a tweet. Specifically, the punc-tuation ? can signal a question or request while ! can signal an expression or recommen-dation. We have two binary features indicating the appearance or lack thereof of these symbols.
Twitter-specific Characters
There are certain Twitter-specific characters that can signal speech acts. These characters are #, @, and RT. #, also known as a hashtag marker, is usually used to tag a tweet with a specific topic. (For example, #redsox tags tweets about the Red Sox baseball team.) Hashtags tend to be used more in expressions and recommendations and less in assertions.
@ is followed by a Twitter user-name and is usually used to reply to someone. It is often used with questions, recommendations, and requests (targeted towards someone). Finally, RT is used to indicate a retweet (which is reposting a message). Assertions tend to be retweeted more heavily than other speech acts. (For example a statement by authorities about a breaking news usually is an assertion that gets retweeted a lot.) There are three binary features indicating the presence of these symbols.
As Zhang et al. [108] found, the position of these characters is also important to con-sider since Twitter-specific characters used in the initial position of a tweet is more predic-tive than in other positions. This is the case since these characters have different semantics depending on their position. Therefore, we have three additional binary features indicating whether these symbols appear in the initial position.
Abbreviations
Abbreviations are seen with great frequency in online communication. The use of abbrevi-ations (such as b4 for before, jk for just kidding and irl for in real life) can signal informal speech which in turn can signal certain speech acts such as expression. We collected 944 such abbreviations from an online dictionary5 and Crystal’s book on language used on the
internet [18]. We have a binary future indicating the presence of any of the 944 abbrevia-tions.
Dependency Sub-trees
As discussed earlier, we believe that much can be gained from the inclusion of sophisticated syntactic features such as dependency sub-trees in our speech act classifier. The use of such features has shown great promise in related tasks such as speech act classification in emails [39] and document sentiment classification [63, 67]. We used Kong et al.’s [48] Twitter dependency parser for English (called the TweeboParser) to generate dependency trees for our tweets. Dependency trees capture the relationship between words in a sentence. Each
node in a dependency tree is a word with edges between words capturing the relationship between the words (a word either modifies or is modified by other words). In contrast to other syntactic trees such as constituency trees, there is a one-to-one correspondence between words in a sentence and the nodes in the tree (so there are only as many nodes as there are words). Figure 3-9 shows the dependency tree of an example tweet.
effected
to
bombings
marathon
our
go
hearts
the
by
those
out
our hearts go out to those effected by the marathon bombings
Determiner
Noun
Preposition
Pronoun
Verb
Figure 3-9: The dependency tree and the part of speech tags of a sample tweet.
We extracted sub-trees of length one and two (the length refers to the number of edges) from each dependency tree. In our example tree in Figure 3-9, there are ten sub-trees of length-one (such as go–hearts, effected–those, etc) and 12 sub-trees of length-two (such as by–effected–those, bombings–the–marathon). Overall we collected 5484 sub-trees that appeared at least five times (4250 length-one sub-trees and 1234 length-two sub-trees). We then used a selection process identical to the one used for n-grams: removing sub-trees that
contain proper nouns or topic-specific words (like the bombings–the–marathon sub-tree) and calculating the normalized entropy for each sub-tree. As with n-grams, we sorted the sub-trees by their normalized entropy and plotted them with respect to how much data they capture. This was done in order to pick a good cut-off for the normalized entropy that selects predictive sub-trees but does not over-fit the data by selecting too many sub-trees. Figure 3-10 shows this plot. Through examining the plot we decided that a good cut-off value for normalized entropy would be 0.2 which would select 30% of the best sub-trees that are collectively seen in 38% of our tweets. The top 30% of the sub-trees is made up of 1109 length-one sub-trees and 546 length-two sub-trees for a total of 1655 sub-trees. There is a binary feature for each of these sub-trees indicating their appearance.
0.0
0.1
0.2
0.3
0.4
0.5
0.6
0.7
Normalized Entropy
0.0
0.2
0.4
0.6
0.8
1.0
Percentage
Sub-tree percentage
Tweet percentage
Figure 3-10: Percentage of tweets and sub-trees for different normalized entropy cut-off values.
Part-of-speech
Finally, we used the part-of-speech tags generated by the dependency tree parser to identify the use of adjectives and interjections (such as yikes, dang, etc). Interjections are mostly used to convey emotion and thus can signal expressions. Similarly adjectives can signal expressions or recommendations. We have two binary features indicating the usage of these two parts-of-speech.
3.1.5
Supervised Speech Act Classifier
We used the Python Scikit-learn toolkit [75] to train four different classifiers on our 3313 binary features using the following methods: naive bayes (NB), decision tree (DT), logistic regression (LR. Also known as max entropy)and linear support vector machine (SVM). Ad-ditionally, given the highly uneven distribution of speech acts, it was particularly important to compare the performance of our classifiers against a baseline (BL) classifier to assess relative performance gains with our features. The baseline classifier always selects the most likely speech act from the prior speech act distribution. We trained classifiers across three granularities: Twitter-wide, Type-specific, and Topic-specific. All of our classifiers are evaluated using 20-fold cross validation. We used a high number of folds since we have limited training data, especially when training fine-grained topic-specific classifiers.
Twitter-wide classifier
Table 3.3 shows the performance of our five classifiers trained and evaluated on all of the data. We report the F1 score for each class, which is the harmonic mean of recall and precision for that class (see Equation (3.3)). The average F1 score we report is the weighted average according to the size of each class. As shown in Table 3.3, all of the classifiers significantly outperform the baseline classifier with logistic regression being the overall best performing classifier with a weighted average F1 score of .70. With the exception of the recommendation class, logistic regression beat the other classifiers across all other