HAL Id: hal-01696669
https://hal-univ-rennes1.archives-ouvertes.fr/hal-01696669
Submitted on 31 Jan 2018HAL is a multi-disciplinary open access
archive for the deposit and dissemination of sci-entific research documents, whether they are pub-lished or not. The documents may come from teaching and research institutions in France or abroad, or from public or private research centers.
L’archive ouverte pluridisciplinaire HAL, est destinée au dépôt et à la diffusion de documents scientifiques de niveau recherche, publiés ou non, émanant des établissements d’enseignement et de recherche français ou étrangers, des laboratoires publics ou privés.
A dynamic mathematical model of bile acid clearance in
HepaRG cells
D. Kaschek, A. Sharanek, A. Guillouzo, J. Timmer, R.J. Weaver
To cite this version:
D. Kaschek, A. Sharanek, A. Guillouzo, J. Timmer, R.J. Weaver. A dynamic mathematical model of bile acid clearance in HepaRG cells. Toxicological Sciences, Oxford University Press (OUP), 2018, 161 (1), pp.48-57. �10.1093/toxsci/kfx199�. �hal-01696669�
1
A dynamic mathematical model of bile acid clearance in HepaRG cells
Daniel Kaschek, Ahmad Sharanek, André Guillouzo, Jens Timmer, Richard J. WeaverInstitute of Physics, Freiburg University, Germany (D.K., J.T.); BIOSS Centre for Biological
Signalling Studies, Freiburg (J.T); Freiburg Center for Systems Biology (J.T.); Inserm UMR
991 Foie, métabolismes et Cancer, Rennes, France (A.S., A.G.); Université Rennes 1,
Rennes, France (A.S., A.G.);Institute de Recherches Internationales Servier, Suresnes,
France (R.J.W.)
Running Title: A model of bile acid clearance in HepaRG cells
2
Abstract
A dynamic model based on ordinary differential equations that describes uptake, basolateral
and canalicular export of taurocholic acid in human HepaRG cells is presented. The highly
reproducible inter-assay experimental data were used to reliably estimate model parameters.
Primary human hepatocytes were similarly evaluated to establish a mathematical model, but
with notably higher inter-assay differences in taurocholic acid clearance and bile canaliculi
dynamics. By use of the HepaRG cell line, the simultaneous taurocholic acid clearance
associated to basolateral uptake, canalicular and sinusoidal efflux, was predicted. The
mathematical model accurately reproduced the dose-dependent inhibition of taurocholic acid
clearance in the presence and absence of the prototypical cholestatic drugs cyclosporine A
and chlorpromazine. Rapid inhibition of taurocholic acid clearance and recovery were found
to be major characteristics of cyclosporine A. Conversely, the action of chlorpromazine was
described by slow onset of inhibition relative to inhibition of taurocholic acid clearance by
cyclosporine A. The established mathematical model, validated by the use of these two
prototypical cholestatic drugs and the integration of bile canalicular dynamics, provides an
important development for the further study of human hepatobiliary function, through
simultaneous temporal and vectorial membrane transport of bile acids in drug-induced
cholestasis.
Key Words: human hepatocytes, HepaRG cells, mathematical model, taurocholic acid,
chlorpromazine, cyclosporine A
Non-standard abbreviations: BSEP, bile salt transport pump; MRP, multidrug
resistance-associated protein; NTCP, sodium-taurocholate co-transporting polypeptide; OATP,
organic-anion transport protein; CPZ, chlorpromazine; CsA, cyclosporine A; TCA, taurocholic acid;
PHH, primary human hepatocytes; BC, bile canaliculi; SCHH, sandwich cultured human
hepatocytes; CCHH, conventional cultured human hepatocytes; ODEs, ordinary differential
3
INTRODUCTION
The underlying pathophysiological mechanisms for most hepatocellular forms of
drug-induced hepatic injury remain poorly understood. However, there is reasonable evidence
that intrahepatic cholestatic forms of drug-induced liver damage frequently result from a
drug- or metabolite-mediated inhibition of hepatobiliary transporter systems (Goldring et al.,
2017; Hillgren et al., 2013). In addition to the function of these key transporters in
determining hepatic drug exposure and clearance, the coordinated action of these transport
systems is essential for bile formation and the biliary secretion of cholephilic compounds and
drugs (Chiang, 2009). A drug-mediated functional disturbance of these processes, directly or
indirectly, can lead to the arrest of bile formation and flow with the development of
cholestatic liver cell damage (Pauli-Magnus and Meier, 2006). In addition to drug-mediated
inhibition of hepatocellular transport function, the inter-individual variability of transporter
expression and function are altered by pre-existing hepatic diseases and genetic factors,
which are believed to contribute to the development of drug-induced risk of cholestasis in
susceptible individuals (Trauner et al., 1998). Recently, some of us reported that cholestatic
drugs caused alteration of bile canaliculi dynamics associated with impairment of the
Rho-kinase/ myosin light chain kinase signaling pathway using human HepaRG cells (Burbank et
al., 2016; Sharanek et al., 2016).
Although the use of primary human hepatocytes (PHH) for the study of drug effects on bile
formation and secretion by hepatocytes is well documented (Guo et al., 2016; Swift et al.,
2010), the donor-donor variability and inherent dedifferentiation of the hepatocellular
phenotype in culture can often greatly influence their practical routine use in early screening
in drug discovery. Moreover, these biological donor-donor variabilities associated with PHH
may confound opportunities to sequentially build an integrated time-resolved mathematical
model using a singularly phenotypically stable, reproducible and robust in vitro model by
4
in culture. By contrast, the HepaRG cell line exhibits a well-characterized and stable
hepatocyte-like phenotype (Guguen-Guillouzo and Guillouzo, 2010) by which to
reproducibly measure bile formation and bile canalicular (BC) clearance (Sharanek et al.,
2015), to establish a dynamic mathematical model describing bile acid clearance.
Modeling the flow of drugs or substrates by ordinary differential equations (ODEs) is a
common approach in pharmacokinetic modeling. Indeed, mathematical models of drug
disposition (Jones et al., 2012; Li et al., 2014) and bile flow (Guo, et al. 2016; Yang et al.,
2015) into and out of hepatocytes have been previously presented. All these models have a
common model structure, including cellular, canalicular/biliary and medium compartments.
Bile acids are transported between these compartments. This model structure is also used in
this work. However, drug-mediated transporter inhibition is frequently modeled as a static
process as the transport rates are reduced in a dose-dependent manner; . time-dependence
of the inhibitory process and the recovery is neglected, and the effects are assumed to occur
immediately. In contrast, our model incorporates transporter inhibition as a dynamic
time-resolved process into the ODE model. Also, the compartment size, such as the volume of
BC that changes dynamically with the concentration of cholestatic drugs and are importantly
implemented into our ODEs. These features are important events identified in the acute
phase of cholestasis associated with vectorial transport of bile acids and initiation of bile
flow.
In this study, we describe the use of experimental data derived from human HepaRG cells to
establish a quantitative and predictive dynamic model of bile acid clearance, using a
prototypical bile acid, taurocholic acid (TCA), for the study of hepatobiliary transport. A
validation of the model was further achieved by use of two prototypical cholestatic drugs,
cyclosporine A (CsA) and chlorpromazine (CPZ), previously shown to exhibit differences in
the mechanisms of apical and basolateral transporter inhibition (Antherieu et al., 2013;
5
Materials and Methods
Data sources and statistical analysis
Chemical reagents, details of biological experiments and techniques used to prepare and
characterize HepaRG cells and PHH are provided in the supplement (Section 1). In brief,
wet-bench assay data from experiments with CPZ (Bachour-El Azzi et al., 2014) and CsA
(Sharanek, et al. 2014) were used to develop a mathematical model. In addition, new
experiments with the use of CPZ and CsA were performed during the course of the present
study with model-informed study design. At least 4 independent experiments with HepaRG
cells and PHH were performed and analyzed.
Pre-processing of time-resolved data
For each protocol, experiments were repeated at least 4 times. Since TCA is radiolabeled,
the count data follows a Poisson distribution. In our case the number of counts is in the order
of 102 to 103. "For statistical analysis, it is beneficial to have normally distributed data with
equal expected variance of all data points. The transformation n = 2√N translates the Poisson-distributed number of counts N into (almost) normally distributed numbers n with
unit variance." . Differences between independent experiments, j, that exceed the expected
variance are due to heterogeneity between the preparations of cultures of HepaRG cells.
These differences can be attributed to a different number of cells between experiments,
represented by a scaling factor S
, which translates into a factor
s = 2√Sof the numbers
n.
. In total, the mathematical model to describe all replicate readouts is described;𝑛𝑗,𝑘,𝑟(𝑡) = 𝑠𝑗⋅ 𝑛𝑘(𝑡) + 𝜖𝑗,𝑘,𝑟(𝑡) + 𝜂𝑗,𝑘,𝑟(𝑡) (1)
where 𝑛𝑗,𝑘,𝑟(𝑡) is the transformed number of counts of experiment j, set-up/treatment k and replicate r at time point t. The numbers 𝜖𝑗,𝑘,𝑟(𝑡) ∼ 𝑁(0, 1) and 𝜂𝑗,𝑘,𝑟(𝑡) ∼ 𝑁(0, 𝜎𝑐𝑒𝑙𝑙𝑡𝑦𝑝𝑒2 ) describe random contributions due to the stochasticity of radioactive decays and
6
heterogeneity between HepaRG cell and treatment preparations. The parameters of interest,
𝑛𝑘(𝑡), represent the true transformed number of counts for each set-up/treatment k as being used for dynamic modeling. They are determined jointly with the scaling parameters sj and
the cell-type heterogeneity 𝜎𝑐𝑒𝑙𝑙𝑡𝑦𝑝𝑒 by least-squares estimation. Parameter uncertainties 𝜎𝑛𝑘(𝑡) are obtained from the least-squares fit. They account for the number of replicates, the uncertainty of the estimated scaling parameters and the heterogeneity between experiments.
The heterogeneity parameters 𝜎𝑐𝑒𝑙𝑙𝑡𝑦𝑝𝑒 are employed to quantify the reproducibility of experiments for the cell types HepaRG, human hepatocytes in sandwich culture and human
hepatocytes in conventional culture. See supplement Figure S2 [Data pre-processing] for a
comparison of the different cell types.
A dynamic model of TCA transport
TCA transport is modeled by ordinary differential equations (ODEs). The equations are
based on mass-action or Michaelis-Menten kinetics and account for the transport between
three compartments, i.e. incubation medium, cells (cyto) and canaliculi with volumes Vbuffer,
Vcyto and Vcana. A schematic overview of the model is shown in Figure 1. The basic transport
processes are
(2)
where k1, …, k4 denote transport rates. These rates are susceptible to temperature,
calcium/magnesium and sodium changes and depend on the activity of the corresponding
basolateral and canalicular membranes to TCA transport. In this study, each transport
process can be associated to one membrane transporter known to be associated with the
basolateral, sinusoidal and canalicular cell membranes, i.e. uptake (T1), sinusoidal efflux (T2)
7
(3)
where k’1, …, k’4 are the transport parameters, 𝛥𝜗 is the temperature change with respect to
4 °C, d1, …, d4 denotes deceleration parameters associated to a temperature drop, a1 is the
acceleration parameter associated to sodium in the buffer and K4 represents the effect of
calcium on canalicular efflux.
The kinetic principles used to model uptake, sinusoidal efflux and canalicular efflux is
Michaelis-Menten Kinetics whereas the transport from the canalicular compartment to the
buffer compartment is modeled by mass-action kinetics.
(4)
The transporter activity Ti , i = 1, ..., 3, is dynamically regulated being modeled by the
reactions . Where, “∅ and “∅"denote deregulation and production. The parameterization by 𝛼𝑖 implies that the equilibrium of the reaction is Ti = 1 for all transporters
and the time-scale how quickly the disturbed system returns to the initial measures of TCA
8
meantime be reduced by cholestatic drugs. Within the mass-action formalism, inhibition by a
drug is implemented as
,
(5)
where D is the drug and DT1, …, DT3 are the inhibited transporters, see Figure 1B. The rate
parameters 𝑘+(𝑖) represent the effective inhibition of the drug on transporter Ti while 𝑘−(𝑖)
represents the transporters’ ability to recover when the compound-containing buffer is removed.
In the absence of the drug, membrane associated transport activity is equal to unity and
assigned the value of 1 across the membranes. By the addition of the drug, a new
equilibrium between active and inactive membrane transport activity is approached which is
determined by the equilibrium constants 𝐾𝑐(𝑖)=𝑘+ (𝑖)
𝑘−(𝑖). Conversely, when the free drug is
removed, the system transitions to another equilibrium retaining some of the drug’s inhibitory effect for reversible inhibition of transporter activity. The drug-induced dynamics is overlain
by the transporter regulating mechanism steering all transporter activities associated to
membranes to unity of 1. The possibility of irreversible changes of the transporter activity is
equally incorporated into the model by choosing drug-specific values for the membrane
transporter activity, 𝛼𝑖.
When cells are exposed to TCA for more than 30 minutes, the uptake can be seen to
effectively accelerate. This is possibly accounted for by changes in membrane transport with
time of TCA exposure in culture. In our model, TCA uptake is controlled by the T1 state
variable. To account for the accelerated uptake, we include a gain term for the T1 state,
proportional to the integrated TCA buffer concentration, AUCTCA(buffer), see Figure 1C. In
9
(6)
Besides their effects on membrane transporter activity, cholestatic drugs can have both
constriction and dilatation effects on BC, such that the volume of the canalicular
compartment is either reduced or increased. For low CsA concentration treatments, the
dilatation effect prevails whereas for higher doses constriction of BC are observed. This
behavior can be implemented by a linear and a saturating rate for dilatation and constriction:
(7)
The dilatation/constriction rates are linked to the integrated drug concentration over time,
see Figure 1A. The integrated drug concentration is restricted by a reduction of the rate, k-.
Because we expect a certain delay between drug treatment and reduction of the volume,
canalicular volume constriction is linked to the integrated drug concentration AUCdrug instead
of simply drug concentration.
A list of all reactions and the corresponding differential equations are available in the
supplement Section 3 [Model specification].
Parameter estimation and uncertainty analysis
Parameter estimation is based on the maximum-likelihood method. As discussed in the
section on pre-processing of time resolved data, the observational noise is composed of a
10
due to the heterogeneity between repeated preparations. Although results for the HepaRG
cell line are highly reproducible, heterogeneity 𝜎𝑐𝑒𝑙𝑙𝑡𝑦𝑝𝑒 still presents the major contribution to the observation noise of around 15%.
Maximization of the likelihood is equivalent to minimization of the objective function
𝜒2(𝑝) = ∑
𝑖,𝑗
(𝑥𝑗(𝑡𝑖, 𝑝) − 𝑥𝑗,𝑖𝐷)2
𝜎𝑖,𝑗2 (8)
where 𝑥𝑗(𝑡𝑖, 𝑝) denotes the model prediction for state j at time-point ti given the parameter
values p. The squared residuals between model prediction and data points 𝑥𝑗,𝑖𝐷 =𝑛𝑗 2(𝑡
𝑖) 4 are
weighted by the variances 𝜎𝑖,𝑗2 =𝑛𝑗 2(𝑡
𝑖)
4 𝜎𝑐𝑒𝑙𝑙𝑡𝑦𝑝𝑒
2 . Optimization of the objective function is
performed by a trust-region algorithm (Nocedal and Wright, 2006) that relies on derivative
information. Therefore, the ODEs of the dynamic system are combined with their forward
sensitivity equations (Leis and Kramer, 1988) and solved numerically by the LSODES
integrator (Soetaert et al., 2010). Nonlinear optimization is usually compromised by the
existence of several local optima. To search the parameter space for the best optimum, we
follow a multi-start strategy to initialize the trust-region optimizer. Identification of the
parameter determinants has been checked based on the symmetries that are admitted by
the system (Merkt et al., 2015). Practical non-identifiability and parameter confidence
bounds were analyzed using the profile likelihood method (Kreutz et al., 2013; Raue et al.,
2009).
All analyses have been performed in R with the packages cOde/dMod (Kascheck et al.,
2016) for dynamic modeling and parameter estimation in R, available on Comprehensive R
Archive Network (CRAN). More details about the parameter estimation process are available
11
Results
The results described in this work are based on dynamic modeling in combination with
parameter estimation to match the experimental TCA data with our mathematical model.
Thus, the nature of our model turns from being descriptive to being predictive. The model of
TCA transport in HepaRG cells is based on ordinary differential equations describing the
TCA flux between three compartments; incubation medium, cells and canaliculi. The impact
of the cholestatic drugs CsA and CPZ on uptake and efflux activities has been implemented
as a dynamic process with changing transporter activity and canalicular volume over time.
The experimental conditions are characterized by different treatments times, incubations
times or changing Ca2+/Mg2+ levels in the buffer. These conditions are fully accounted for
by the model which ultimately depends on a single set of parameters. From these parameter
values, the simulated model outcome is uniquely determined for all experimental conditions.
The building of the model was achieved by use of four different experimental protocols, two
efflux and two uptake protocols. For the sake of clarity, these protocols with the
corresponding model predictions are discussed separately, keeping in mind that they are
connected by a single model structure and parameter set.
Temperature and Ca2+/Mg2+conditions
The first protocol sheds light on the temperature dependency of transport rates and shows
how strongly the presence of Ca2+/Mg2+ in the buffer contributes to the formation of
canalicular junctions to retain TCA in the canaliculi. Figure 2 shows the efflux dynamics of
[3H]-TCA in the cells and in the buffer at two temperature conditions, 37 °C and 4 °C, and
two buffer conditions, with and without Ca2+/Mg2+. Cellular levels of [3H]-TCA (Figure 2A),
remain almost constant for low temperature (blue) while showing a quick reduction at 37 °C
(red).
In building the dynamic model of TCA transport, we introduced deceleration parameters d1,
12
space, we found several locally optimal solutions that explained the temperature and
Ca2+/Mg2+ dependency as shown in Figure 2A. Locally optimal solutions involved either
dominant deceleration of sinusoidal/canalicular efflux mediated TCA transport or dominant
deceleration of canalicular efflux. However, only the latter solution is able to reproduce the
pronounced effect between Ca2+/Mg2+ and Ca2+/Mg2+-free conditions at 37 °C while, at the
same time, showing no difference at 4 °C.
The dynamic model allows separation of the intracellular and canalicular contributions which
summarized, represents the observation of cellular TCA content. Together with a priori
knowledge about the total TCA amounts, a prediction of the [3H]-TCA distribution throughout
the compartments is feasible, shown in Figure 2B. After 30 min uptake, 75% of all TCA is
located in the cytoplasm of cells and 25% in the canaliculi. Under calcium-free conditions at
37 °C, it takes around 10 to 20min for the canalicular junctions to disrupt, as can been seen
from the model prediction for canalicular TCA.
Efflux of TCA in the presence of cholestatic drugs
The second protocol focuses on the inhibitory effect of the cholestatic drugs CsA and CPZ
on TCA efflux. HepaRG cells were incubated with [3H]-TCA for 30 min and then treated for
2h in the presence or absence of drug in standard buffer containing Ca2+/Mg2+. The
experimental results and corresponding model fits are shown in Figure 3. Cellular levels of
TCA over a time period of 120 min are shown in Figure 3A. With increasing concentrations,
CsA-treated cells (squares and solid lines) show the expected inhibition of TCA efflux. To
obtain a measurement that reflects the cytoplasmic TCA level as close as possible, the
efflux buffer was exchanged by a Ca2+/Mg2+-free medium is added after incubation with
[3H]-TCA and drug to measure total TCA efflux. The buffer exchange has been included as
a discontinuity into the mathematical model. Therefore, for each data point there is one
corresponding model trajectory to fit this data points. The typical trajectory shows a slow
exponential decay followed by a fast transition caused by the disruption of canalicular
13
contents changes due to the buffer exchange is shown as shaded area. The bottom
part of the shaded area, a dotted line, reflects the TCA concentration after buffer
exchange which is to be compared with the data points. Relative to CPZ, CsA
shows a much stronger inhibitory effect on TCA clearance by comparison with CPZ at a
dose of 50 µM.
Figure 3B shows the predicted absolute amounts of TCA in the different compartments for
an efflux buffer with Ca2+/Mg2+. All active transport processes are inhibited by CsA, as shown
by Figure 3C and remain low over 120 min except for MRP3 as confirmed by
immunostaining (Sharanek, et al., 2015) which begins to recover cellular efflux of TCA over
the period following addition of CsA. CPZ has no apparent inhibitory effect on sinusoidal
efflux, albeit in the model is shown to inhibit uptake and canalicular efflux. The most evident
difference between CsA and CPZ is the slower time scale by which CPZ inhibits uptake and
canalicular efflux. Therefore, cells treated with 50µM of CPZ are able to clear almost all of
the contained TCA although canalicular efflux transporters activity drops to almost 0% as
similarly observed for CsA.
The inhibitory constant (Ki) reflects binding affinity and functional strength for the
inhibition of activity and becomes important for helping to predict clinically relevant
drug interactions. These are normally reported as static measures. Figure 3C
indicates that transporter recovery and different time scales of CsA and CPZ action
are major characteristics of the system. These properties being identified by our
semi-mechanistic drug-transporter response cannot be captured by a classical
inhibition model i.e., based on K
ivalues, as shown in the Supplement.
Exposure tohigh concentrations (50µM) of either cholestatic drug resulted in constriction of BC as early
14
an effect characterized by bile canaliculi dilatation as shown by phase-contrast microscopy
in Figure 4.
Uptake of TCA in the presence of cholestatic drugs
The third protocol was performed to investigate the effect of treatment time on the
concentration-dependent inhibitory effect of CsA. The results are shown in Figure 5. The
effects of the CsA on BA uptake was estimated through measurement of intracellular
accumulation of [3H]-TCA. Briefly HepaRG cells were treated for 15, 30 or 60 min with
different concentrations of CsA (0, 1, 5, 10, 25 and 50µM) and measurements were taken 10
min after incubation with TCA. CsA induced a dose-dependent inhibition of TCA uptake as
early as 10 minutes after treatment. On the other hand, TCA levels of equivalent doses for
different treatment times roughly achieve the same response, see Figure 5A. This is also
reflected in the predicted absolute amounts in the three compartments, Figure 5B. In
accordance with the observation, the estimated time-scale parameters for transporter
inhibition are fast enough to realize the full inhibitory effect within few minutes, Figure 5C.
During incubation with [3H]-TCA, no drug is contained in the incubation buffer. The
membrane transporter activity can recover and regain their activity to some extent during this
phase. The curves for canalicular export and uptake transporter activity are almost exactly
superimposable, producing the same efflux dynamics whether the treatment with CsA was
for 15, 30 or 60min. By parameter estimation we find that TCA transport to the canaliculi is
four times higher than sinusoidal export, limiting the possible impact of sinusoidal export on
the shape of the curves. This relative preferential clearance of TCA is confirmed by the
observed activities of BSEP and MRP3 activities in heterologous expressed vesicle
membranes (unpublished observations). Similarly since we observe cellular uptake of TCA,
the reduction of canalicular volume has no direct feedback on the observed cellular levels.
Finally, by the fourth experimental protocol, the effects of the two cholestatic drugs, CPZ and
15
of [3H]-TCA. HepaRG cells were treated for 30 min with either drug and then loaded with
[3H]-TCA for different time points over 120 min. As shown in Figure 6 our model predicts that
the TCA dynamics upon CPZ treatment is more linear than upon CsA treatment and turns
earlier into the phase of accelerated uptake (Figure 6A). This is also visible in the predicted
intracellular TCA levels, (Figure 6B) which show a different shape for CsA and CPZ.
Although the exposure to high TCA concentrations for more than two hours might be
non-physiological, the insight that continuous TCA exposure could lead to increased TCA uptake
is valuable for future mathematical model development.
Evaluating the ratio between intracellular and canalicular TCA amounts by the mathematical
model, we find 2-4 times more TCA intracellular content than in the canaliculi. The ratio is
even higher for higher drug concentrations. All these observations are in line with the
estimated effects of CsA and CPZ on the transporter activity shown in Figure 6C. CPZ
inhibition is slower, but more sustained and its effect on canalicular export and cellular
uptake is similar. Also, CsA inhibition of basolateral uptake is similar to efflux inhibition. The
effect is more immediate for CsA than for CPZ but transporters can partially recover after the
removal of CsA. The strongly inhibited accumulation of TCA in the cells upon CsA treatment
is supported by the quick recovery and over compensation of sinusoidal response, which
can be attributed to sinusoidal transporter activity.
Primary human hepatocytes
We relate our findings on HepaRG cells to the TCA efflux dynamics observed in human
hepatocytes. Hepatocytes were kept in either conventional (CCHH) or sandwich (SCHH)
culture. The direct comparison of cellular TCA levels is shown in Figure 7.
The measurements in HepaRG cells, CCHH and SCHH are normalized by the respective
mean values at t=30 min, just before the uptake buffer is replaced to measure efflux. Since
16
types are visualized on the log-scale where a steeper slope corresponds to a higher export
rate. On average, the human hepatocytes show a faster export of TCA. The efflux from
human hepatocytes is not stopped at 4 °C but is in the same range as at 37 °C with
Ca2+/Mg2+ in the buffer; conventional cultured hepatocytes are partly affected. There is the
tendency that human hepatocytes are more susceptible to Ca2+/Mg2+ removal which might
indicate that BC tight junctions are perhaps more disposed to Ca2+ depletion, which in CsA
treated PHH is supported by the observation of fewer fully closed BC in culture.
The comparative analysis of all data reveals that the variability in CCHH and SCHH is much
larger than in HepaRG cells, see Section 2 [data-preprocessing] in the supplement. This was
to be expected due to the known donor-donor differences in transport activity and
intracellular amounts of bile acids. This is attributable at least in part due to source of
resection tissue from patients, the hepatocytes of which may carry pathologies not
consummate with normal liver tissue,thus corroborating our approach to start with a
mathematical model of HepaRG cells by which to study the simultaneous effect of TCA
transport, BC volume and drug effect. Despite the observed donor-donor differences with
PHH, it is nevertheless feasible future work using the model established with HepaRG cells
can potentially form the basis of further studies using PHHs. This opens the perspective of
pointing towards extending our work with the use of primary human hepatocytes for the
development of models to eventually incorporate donor-donor differences, using the dynamic
mathematical model described herein.
Discussion
In the current study, we describe a dynamic mathematical model of TCA uptake and
clearance on the basis of experimental data obtained with untreated and CsA- and
CPZ-treated human HepaRG cells. Data from both previously performed and new experiments on
untreated and drug-treated cells were analyzed. All our results were obtained by dynamic
17
bile acid transport was established on ordinary differential equations and was extended by a
dynamic drug-effect model introducing transporter activity and canalicular volume as
dynamic states. These features are important components of bile acid secretion and flow,
the deregulation of which are implicated in drug-induced cholestasis (Watanabe, et al., 2007)
(Watanabe, et al, 1991).
We analyzed TCA clearance by measuring uptake and both canalicular and sinusoidal efflux
that are predominantly performed by NTCP, BSEP and MRP3 membrane transporters
respectively. Although passive diffusion is reported for some bile acids the predominant
clearance of the prototypical bile acid, TCA, for hepatobiliary studies is through active
transport by the involvement of these membrane transporters. In untreated cells, TCA was
found in the three compartments, i.e. cells (intracellularly), BC lumen and medium after a
short incubation. Time-dependent increased accumulation in the medium during the 30min
incubation likely reflected an increased sinusoidal efflux associated with the activation of the
MRP3 membrane transporter in the presence of drugs, which has been described as a
compensatory mechanism in the event of BSEP inhibition (Yang et al., 2013). In support of
this, immuno-localization of MRP3 showed a more intense labeling of the sinusoidal
membrane after 30min of CsA treatment (Sharanek, et al., 2015). However, it cannot be
excluded that a fraction of TCA was effluxed to the supernatant via BC. Indeed, we recently
showed that BC exhibit asynchronism contraction and relaxation cycles of around 60min
each to evacuate BC content into the supernatant (Sharanek, et al; , 2016).
In our model, membrane transporter activity returns close to its basal level following CsA
treatment. By parameter estimation we found that this regulatory mechanism could play a
major role for sinusoidal export but not for cellular uptake and canalicular export. The model
favors a scenario where sinusoidal transporters quickly recover after CsA treatment and
restores full sinusoidal membrane transporter activity, whereas for uptake and canalicular
export transporters the recovery of activity remains partially inhibited. Consequently, TCA
export is shifted from canalicular to sinusoidal export which, under normal conditions,
18
activityconfirms its role as an alternative route of TCA export when the canalicular
membrane transporter (i.e. BSEP) is inhibited. These observations hold promising insights
for the study on the simultaneous inhibition and recovery of membrane transporter activities
in acute drug-induced cholestasis. Further work to extend these observations to other
cholestatic drugs will provide important developments to establish if the effects of CsA and
CPZ on membrane transporters are drug specific, or equally applies to cholestatic drugs and
rarely cholestatic drugs.
Inhibition of transporter activity by the two prototypical inhibitors, CsA and CPZ, was
modeled phenomenologically by reversible and irreversible binding reactions. Parameter
estimation revealed that all transporters have a well-defined forward- and backward reaction
to CsA due to competitive inhibition characteristics of CsA. This means that the time-scales
of inhibition and recovery as well as the extent of inhibition during and after CsA treatment
can be uniquely determined from the time-course experiments for the three membrane
containing transporters. CPZ which is an inhibitor of cellular uptake and canalicular export
but not sinusoidal export (Antherieu, et al., 2013) was found to act on TCA clearance rates
more slowly when compared to CsA. In agreement, by parameter estimation we could show
that inhibition by CPZ is irreversible, the two reaction parameters corresponding to
reversibility being compatible with zero. Indeed, experimental studies showed that the
cholestatic mechanism of CPZ is indirect and slower, depending on generation of reactive
oxygen species that lead to irreversible bile flow inhibition (Antherieu, et al., 2013). This
indicates that the mathematical model is capable of distinguishing between the two
cholestatic drugs which act by different mechanisms. In addition, the effect on clearance by
both CsA and CPZ causes reduction of canalicular size which was confirmed by direct light
microscopic observation. Therefore, the canalicular volume was included as a dynamic state
into the mathematical model. We found that the volume reduction is well described when
linked to compound exposure and effect on TCA clearance. These features are important
19
Moreover, the model predicts Ki and can be extended to the study of drug-drug interactions,
bile acid perturbation and bile canalicular deregulation in drug safety testing. The
assessment of Ki was performed by two approaches in our work with generally comparable
results (supplement 5). The observed differences by two the approaches can be attributed
to the temporal effect of inhibition and transport recovery. The ability to model both inhibition
and recovery can provide important insight when defining drug safety by use of the dynamic
model.
Finally, to validate that data from experiments on HepaRG cells are adequate to build a
physiologically relevant mathematical model, we analyzed sets of data on TCA uptake and
efflux from PHH. As expected, the mathematical analysis of all data reveals expected
variability in PHH clearance of TCA that was considerably larger than in HepaRG cells
attributed to the statistical fluctuations of inter-donor variability. By contrast, statistical
analysis of HepaRG cells data showed high inter-assay reproducibility, further supporting the
stable phenotype of this cell line and its suitability to construct a mathematical model to
explore for the first time the hepatobiliary function and apparent inter-relationship of
membrane transport, bile canalicular dynamics by drug-induced impairment of TCA
clearance. Use of HepaRG cells, which confers stable biological phenotype consummate
with primary human hepatocytes, would permit use in the screening and modeling of novel
drug candidates in pharmaceutical drug discovery. The approach herein would equally
contribute to known works on Systems Pharmacology Modeling that describe delayed bile
acid mediated drug induced hepatotoxicity by use of Physiologically-based
Pharmacokinetics (PBPK) and virtual population approaches previously described (Yang et
al., 2014).
Our model further identifies a number of similarities and dissimilarities between TCA
clearance in HepaRG cells, CCHH and SCHH. In standard experimental conditions of
20
and a temperature-dependent effect was also observed with the linear regression model.
Indeed, the mathematical curves showed a decrease of TCA active transport in the three cell
models at 4°C as indicated by the smaller slope of the regression lines. However, even
though the efflux rates were close, human hepatocytes showed a tendency for a faster
export of TCA than HepaRG cells that can be attributed to the known higher constitutive
expression of BSEP protein at the canalicular membrane (Bachour-El Azzi et al., 2015) and
a higher number of hepatocytes per surface unit in PHH cultures. The higher level of BSEP
expression in PHH thus confers the capacity (Vmax), but not the ability (Km) to transport
TCA across the bile canalicular membrane. The primitive biliary cell population present in
HepaRG cell cultures do not exhibit any of the bile acid transporters and do not contribute to
uptake and accumulate bile acids (Sharanek, et al., 2014). CCHH were less susceptible to
low temperature and reduction of TCA efflux at 4°C and was less pronounced compared to
either HepaRG cells or SCHH. Importantly, while HepaRG cells are maintained for 30 days
in culture to reach differentiation, human hepatocytes are only maintained for 4-5 days
before use. In this short culture period, isolated human hepatocytes in sandwich
configuration recover to form tight-junctions and well-sealed BC by comparison with
conventional collagen culture conditions of cells (LeCluyse et al., 1994; Liu et al., 1998).
Similarly, as observed with HepaRG cells, the regression model revealed a dependency of
BC tight junctions on Ca2+/Mg2+ in human hepatocytes. It also showed that PHH are more
vulnerable to cation depletion than HepaRG cells. Due to the long culture period, HepaRG
cells developed tight junctions of larger size than in human hepatocytes and thus are less
sensitive to a Ca2+/Mg2+ depletion. It may also be possible that CCHH have more poorly
formed junctions and consequently accumulate less bile acids in canalicular lumens than
their SCHH counterparts and thus potentially diffusion of bile acids to possibly explain the
apparent and reduced susceptibility to 4°C and higher vulnerability to cation depletion
observed in this study. Nevertheless, if some differences were observed between HepaRG
cells and PHH, the largely similar clearance of TCA between these two cell models open the
21
use in extending this work to explore mechanisms of hepatobiliary regulation e.g. FXR gene
regulation of transporters in HepaRG cells and inter-individual variabilities in the transport of
bile acids and bile canalicular kinetics using phenotypically characterized primary human
hepatocytes.
Supplementary data
Listing further details of biological experiments and techniques used to prepare and
characterize HepaRG cells and primary human hepatocytes; data pre-processing details on
the comparison of the different cell types; corresponding differential equations on model
specification; details on parameter estimation process, model fitting and model reduction.
22
Funding Information
This work was supported by the European Community [Contract MIP-DILI-115336]. The
MIP-DILI project has received support from the Innovative Medicines Initiative Joint
Undertaking, resources of which are composed of financial contribution from the European
Union's Seventh Framework Programme [FP7/20072013] and EFPIA companies’ in kind contribution. http://www.imi.europa.eu/.
Daniel Kaschek and Ahmad Sharanek were financially supported by the MIP-DILI project
Conflict of interest
There is no conflict of interest
Acknowledgements & Author contributions
Research design: Richard Weaver;
Mathematical model concept and design, Daniel Kaschek;
Conducted experiments: Biological experiments, Ahmad Sharanek;
Performed data analysis: Interpretation of data, Daniel Kaschek, Ahmad Sharanek, Andre
Guillouzo, Richard Weaver.
Wrote or contributed to the writing of the manuscript: Writing and review of manuscript
Daniel Kaschek, Ahmad Sharanek, Andre Guillouzo, Richard Weaver;
23
References
Antherieu, S., Bachour-El Azzi, P., Dumont, J., Abdel-Razzak, Z., Guguen-Guillouzo, C., Fromenty, B., Robin, M. A., and Guillouzo, A. (2013). Oxidative stress plays a major role in chlorpromazine-induced cholestasis in human HepaRG cells. Hepatology 57, 1518-29. Bachour-El Azzi, P., Sharanek, A., Abdel-Razzak, Z., Antherieu, S., Al-Attrache, H., Savary, C. C., Lepage, S., Morel, I., Labbe, G., Guguen-Guillouzo, C., et al. (2014). Impact of inflammation on chlorpromazine-induced cytotoxicity and cholestatic features in HepaRG cells. Drug Metab Dispos 42, 1556-66.
Bachour-El Azzi, P., Sharanek, A., Burban, A., Li, R., Guevel, R. L., Abdel-Razzak, Z., Stieger, B., Guguen-Guillouzo, C., and Guillouzo, A. (2015). Comparative Localization and Functional Activity of the Main Hepatobiliary Transporters in HepaRG Cells and Primary Human Hepatocytes. Toxicol Sci 145, 157-68.
Burbank, M. G., Burban, A., Sharanek, A., Weaver, R. J., Guguen-Guillouzo, C., and Guillouzo, A. (2016). Early Alterations of Bile Canaliculi Dynamics and the Rho
Kinase/Myosin Light Chain Kinase Pathway Are Characteristics of Drug-Induced Intrahepatic Cholestasis. Drug Metab Dispos 44, 1780-1793.
Chiang, J. Y. (2009). Bile acids: regulation of synthesis. J Lipid Res 50, 1955-66.
Goldring, C., Weaver, R., Kramer, B., Klingmueller, O. A., Van der Water, C. J., Guillouzo, A., et al., (2017). Drug-Induced Liver Injury: Mechanism-Informed Prediction in Drug. In Comprehensive Medicinal Chemistry, 3rd Ed (pp. 1-18). Oxford: Elsevier.
Guguen-Guillouzo, C., and Guillouzo, A. (2010). General review on in vitro hepatocyte models and their applications. Methods Mol Biol 640, 1-40.
Guo, C., Yang, K., Brouwer, K. R., St Claire, R. L., 3rd, and Brouwer, K. L. (2016). Prediction of Altered Bile Acid Disposition Due to Inhibition of Multiple Transporters: An Integrated Approach Using Sandwich-Cultured Hepatocytes, Mechanistic Modeling, and Simulation. J
Pharmacol Exp Ther 358, 324-33.
Hillgren, K. M., Keppler, D., Zur, A. A., Giacomini, K. M., Stieger, B., Cass, C. E., Zhang, L., and International Transporter, C. (2013). Emerging transporters of clinical importance: an update from the International Transporter Consortium. Clin Pharmacol Ther 94, 52-63. Jones, H. M., Barton, H. A., Lai, Y., Bi, Y. A., Kimoto, E., Kempshall, S., Tate, S. C., El-Kattan, A., Houston, J. B., Galetin, A., et al. (2012). Mechanistic pharmacokinetic modeling for the prediction of transporter-mediated disposition in humans from sandwich culture human hepatocyte data. Drug Metab Dispos 40, 1007-17.
Kaschek, D., Mader, W., Fehling-Kaschek, M., Rosenblatt, M., and Timmer, J. (2016). Dynamic modeling, parameter estimation and uncertainty analysis in R. bioRxiv. Jan 1:085001.
Kreutz, C., Raue, A., Kaschek, D., and Timmer, J. (2013). Profile likelihood in systems biology. FEBS J 280, 2564-71.
LeCluyse, E. L., Audus, K. L., and Hochman, J. H. (1994). Formation of extensive
canalicular networks by rat hepatocytes cultured in collagen-sandwich configuration. Am J
Physiol 266, C1764-74.
Leis, J. R., and Kramer, M. (1988). The simultaneous solution and sensitivity analysis of systems described by ordinary differential equations. ACM Trans Math Software, 14, 45-60.
ACM Trans Math Software 14, 45-60.
Li, R., Ghosh, A., Maurer, T. S., Kimoto, E., and Barton, H. A. (2014). Physiologically based pharmacokinetic prediction of telmisartan in human. Drug Metab Dispos 42, 1646-55.
24
Liu, X., Brouwer, K. L., Gan, L. S., Brouwer, K. R., Stieger, B., Meier, P. J., Audus, K. L., and LeCluyse, E. L. (1998). Partial maintenance of taurocholate uptake by adult rat hepatocytes cultured in a collagen sandwich configuration. Pharm Res 15, 1533-9.
Merkt, B., Timmer, J., and Kaschek, D. (2015). Higher-order Lie symmetries in identifiability and predictability analysis of dynamic models. Phys Rev E Stat Nonlin Soft Matter Phys 92, 012920.
Nocedal, J., and Wright, S. (2006). Numerical Optimization (second ed.). Springer Science &
Business Media.
Pauli-Magnus, C., and Meier, P. J. (2006). Hepatobiliary transporters and drug-induced cholestasis. Hepatology 44, 778-87.
Raue, A., Kreutz, C., Maiwald, T., Bachmann, J., Schilling, M., Klingmuller, U., and Timmer, J. (2009). Structural and practical identifiability analysis of partially observed dynamical models by exploiting the profile likelihood. Bioinformatics 25, 1923-9.
Sharanek, A., Azzi, P. B., Al-Attrache, H., Savary, C. C., Humbert, L., Rainteau, D., Guguen-Guillouzo, C., and Guguen-Guillouzo, A. (2014). Different dose-dependent mechanisms are involved in early cyclosporine a-induced cholestatic effects in hepaRG cells. Toxicol Sci 141, 244-53. Sharanek, A., Burban, A., Burbank, M., Le Guevel, R., Li, R., Guillouzo, A., and Guguen-Guillouzo, C. (2016). Rho-kinase/myosin light chain kinase pathway plays a key role in the impairment of bile canaliculi dynamics induced by cholestatic drugs. Sci Rep 6, 24709. Sharanek, A., Burban, A., Humbert, L., Bachour-El Azzi, P., Felix-Gomes, N., Rainteau, D., and Guillouzo, A. (2015). Cellular Accumulation and Toxic Effects of Bile Acids in
Cyclosporine A-Treated HepaRG Hepatocytes. Toxicol Sci 147, 573-87.
Soetaert, K., Thomas, P., and Woodrow-Setzer, R. (2010). Solving Differential Equations in R : Package deSolve. Retrieved from J Stat Softw: http://dx.doi.org/10.18637/jss.v033.i09. Swift, B., Pfeifer, N. D., and Brouwer, K. L. (2010). Sandwich-cultured hepatocytes: an in vitro model to evaluate hepatobiliary transporter-based drug interactions and hepatotoxicity.
Drug Metab Rev 42, 446-71.
Trauner, M., Meier, P. J., and Boyer, J. L. (1998). Molecular pathogenesis of cholestasis. N
Engl J Med 339, 1217-27.
Watanabe, N., Takashimizu, S., Kojima, S., Kagawa, T., Nishizaki, Y., Mine, T., & Matsuzaki, S. (2007). Clinical and pathological features of a prolonged type of acute intrahepatic
cholestasis. Hepatology Research, 37, 598–607.
Watanabe, N., Tsukada, N., Smith, C., & Phillips, M. (1991). Motility of bile canaliculi in theliving animal: implications for bile flow. J Cell biol, 113, 1069-1680.
Yang, K., Kock, K., Sedykh, A., Tropsha, A., and Brouwer, K. L. (2013). An updated review on drug-induced cholestasis: mechanisms and investigation of physicochemical properties and pharmacokinetic parameters. J Pharm Sci 102, 3037-57.
Yang, K., Pfeifer, N. D., Kock, K., and Brouwer, K. L. (2015). Species differences in hepatobiliary disposition of taurocholic acid in human and rat sandwich-cultured
hepatocytes: implications for drug-induced liver injury. J Pharmacol Exp Ther 353, 415-23. Yang, K., Woodhead, J. L., Watkins, P. B., Howell, B. A., and Brouwer, K. L. (2014). Systems pharmacology modeling predicts delayed presentation and species differences in bile acid-mediated troglitazone hepatotoxicity. Clin Pharmacol Ther 96, 589-98.
25
FIGURE LEGENDS
Figure 1: Schematic representation of the dynamic model. (A) The flow of TCA between
the three compartments is indicated by arrows. Transporters associated to each transport
route are marked by red (uptake) and green (efflux) circular symbols. Canalicular content
ejection back into buffer is marked by a blue circular symbol. The amount of TCA in each
compartment and the canalicular volume are dynamic states. Canalicular volume changes
are induced by drug exposure. (B) Drug-induced transporter inhibition is expressed by a
phenomenological model which can be represented by a reaction network. During the
absence of the drug, levels of the active transporter (green open circle) are in equilibrium.
Upon drug stimulation, a new equilibrium between active and inactive transporters (grey
circle) is approached. (C) TCA import is inhibited by the cholestatic drug. This is illustrated
by the equilibrium reaction between active (red open circle) and inactive (grey circle)
transporter. Additionally, continuous exposure to TCA in the buffer eventually leads to
increased uptake. The regulation of active transporter is linked to the integrated buffer TCA
concentration in the model. See methods & materials for full description. Colour versions of
illustrations are available in the online version.
Figure 2 TCA efflux in HepaRG cells. (A-B) Cells incubated at either 37 °C or 4 °C during
efflux and the efflux buffer did or did not contain calcium (colors). (A) Data points and model
fit are shown as dots and lines respectively. (B) The model prediction for the distribution of
TCA amounts between the three compartments shows canalicular levels after uptake to be
around 25%. Colour versions of illustrations are available in the online version.
Figure 3 TCA efflux in HepaRG cells in the presence of cholestatic drugs. (A-C)
Transporters have been inhibited by different concentrations (colors) of the cholestatic drugs
CsA (0, 5, 10 and 50µM) and CPZ (50µM) marked as linestyles and symbols. The buffer was
26
cellular TCA (counts are dpm x103?). Data points and model prediction are shown as dots
and lines. At low doses, canalicular efflux due to calcium removal reduces the observed
cellular TCA levels significantly. (B) The model predicts 1% uptake of all TCA in the buffer.
Amounts are in pmol Avogadro. (C) Transporter inhibition and volume constriction as
predicted by the mathematical model shows a slower dynamics of CPZ-induced inhibition
compared to CsA and significant volume constriction of BC only at higher concentrations.
Colour versions of illustrations are available in the online version.
Figure 4: Alteration of BC morphology by CsA and CPZ in HepaRG cells. Untreated
cells and cells treated with CsA (10 and 50 μM) or with CPZ (20 and 50 μM). Phase-contrast images were captured after 2h (bar = 30 μ); White arrows indicate BC constriction (C) and dilatation (D).
Figure 5 TCA uptake in HepaRG cells at different CsA treatment times. (A-C) HepaRG
treated with 0-50µM CsA for 15, 30 or 60min, then change of buffer containing H3-TCA for
10min prior to measurements of CA. Cells have been treated with different doses (colors) of
CsA for 15, 30 or 60 min and then incubated by TCA for 10 min. (B) The model predicts
similar TCA uptake dynamics in absolute amounts, independent of the treatment time. (C)
The efflux across sinusoidal, canalicular membrane and uptake are similarly predicted
irrespective of time of treatment at 0-50µM CsA are described. Replacing the
treatment-buffer with the TCA-incubation treatment-buffer, results in partial recovery of transporter inhibition (the
transporter inhibition is partially reduced). Colour versions of illustrations are available in the
online version.
Figure 6 TCA uptake in HepaRG cells for different TCA incubation times. (A-C) After a fixed
treatment time of 30 min, either with CsA or CPZ (line-type and symbols), the cells have
been incubated with TCA for different times up to 120 min. (A) The data shows an
27
percentages, are predicted to be smaller than cytoplasmic amounts by a factor 2-4, which is
even reinforced by the cholestatic drugs. (C) Uptake and canalicular export transporters
show almost irreversible predicted inhibition, especially for CPZ. Uptake is increased due to
the continuous exposure to TCA in the buffer. Colour versions of illustrations are available in
the online version.
Figure 7: Comparison of TCA efflux in HepaRG cells and human hepatocytes for different
temperature and Ca2+/Mg2+ conditions. Radioactive counts were normalized by time point 30
min. The normalized counts reflect cellular TCA concentrations, shown by squares, on a
logarithmic scale. Colors indicate the cell type. Differences between the cell types are
highlighted by dashed lines which are computed by linear regression from the data points.
Although on average human hepatocytes show greater efflux activity than HepaRG cells, the
efflux rate under standard conditions (37 °C and Ca2+/Mg2+) remains broadly unaffected, as
indicated by the similar slope of all three regression lines. Colour versions of illustrations are
cellular buffer 40 80 120 40 80 120 0 2 4 time [min] counts [ 1 × 10 3 ] TCA canaliculi
TCA buffer TCA cytoplasm
40 80 120 40 80 120 0 40 80 120 25 50 75 100 0 25 50 75 100 0 25 50 75 100 time [min] cont ents [%] 37°C, Ca²⁺ 37°C, no Ca²⁺ 4°C, Ca²⁺ 4°C, no Ca²⁺ A B
10 µM 50 µM 0 µM 5 µM 30 65 100 140 30 65 100 140 0 2 4 6 0 2 4 6 time [min] counts [ 1 × 10 3 ]
cellular TCA buffer TCA cytoplasm TCA canaliculi
30 65 100 140 30 65 100 140 30 65 100 140 10-2 100 102 time [min] amount [pmol] dose 0 µM 5 µM 10 µM 50 µM compound CsA CPZ
efflux (sinusoidal) efflux (canalicular) uptake volume (canalicular)
30 65 100 140 30 65 100 140 30 65 100 140 30 65 100 140 0 50 100 150 time [min] activity [%] A B C
Figure 4
CsA CsA CPZ CPZ Control 10µM 50µM 20µM 50µM D C Ccellular 0 20 40 60 80 0 1 2 3 4 5 time [min] counts [ 1 × 10
3 ] TCA buffer TCA cytoplasm TCA canaliculi
0 20 40 60 80 0 20 40 60 8010 0 20 40 60 80 -4 10-3 10-2 10-1 10-4 10-3 10-2 10-1 100 10-2 100 time [min] amount [pmol] CsA dose 0 µM 1 µM 5 µM 10 µM 25 µM 50 µM
efflux (sinusoidal) efflux (canalicular) uptake volume (canalicular)
0 20 40 60 80 0 20 40 60 80 0 20 40 60 80 0 0 20 40 60 80 40 80 120 0 40 80 120 0 25 50 75 100 0 50 100 150 time [min] activity [%] A B C
cellular 0 50 100 150 0 5 10 time [min] counts [ 1 × 10 3 ]
TCA buffer TCA cytoplasm TCA canaliculi
0 50 100 150 0 50 100 150 0.1 0 50 100 150 1.0 10.0 100.0 0.1 1.0 10.0 100.0 0.1 1.0 10.0 100.0 time [min] cont ents [%] dose 0 µM 1 µM 5 µM 10 µM 20 µM 25 µM 50 µM compound CsA/no CPZ
efflux (sinusoidal) efflux (canalicular) uptake volume (canalicular)
0 50 100 150 0 50 100 150 0 50 100 150 0 50 100 150 0 50 100 0 50 100 150 0 25 50 75 100 0 40 80 120 time [min] activity [%] A B C
temp.: 37 °C Mg²⁺/Ca²⁺: no temp.: 37 °C Mg²⁺/Ca²⁺: yes temp.: 4 °C Mg²⁺/Ca²⁺: no temp.: 4 °C Mg²⁺/Ca²⁺: yes 10-1 100 10-1 100 10-1 100 10-1 100 30 40 50 60 30 40 50 60 30 40 50 60 30 40 50 60 time [min] conc. [a.u.] cell type HepaRG CCHH SCHH cellular
Supplement: A dynamic mathematical model of bile
acid clearance in HepaRG cells
Daniel Kaschek, Ahmad Sharanek, André Guillouzo, Jens Timmer and Richard J. Weaver
Contents
1 Materials and Methods 1
1.1 Reagents . . . 1 1.2 Cell cultures . . . 1 1.3 [3H]-TCA efflux in control (untreated) HepaRG cells and primary human hepatocytes . . . . 2
1.4 Efflux inhibition experiments . . . 2 1.5 Uptake inhibition experiments . . . 2 1.6 Bile canalicular area quantification . . . 2
2 Data pre-processing 3
3 Model specification 4
3.1 Table of reactions . . . 4 3.1.1 TCA transport . . . 4 3.2 Specification of reaction rates . . . 6 3.3 List of differential equations . . . 7
4 Model fitting and model reduction 7
4.1 Table of parameters . . . 8
1
Materials and Methods
1.1 Reagents
Cyclosporine A (CsA) and chlorpromazine (CPZ) were purchased from Sigma (St. Quentin Fallavier, France). [3H]-Taurocholic acid ([3H]-TA) was from Perkin Elmer (Boston, MA).
1.2 Cell cultures
HepaRG cells were seeded at a density of 2.6×10⁴cells/cm2
in Williams’ E medium supplemented with 2 mM glutaMAX, 100 U/mL penicillin, 100 µg/mL streptomycin, 10% HyClone fetal calf serum, 5 µg/mL insulin, and 50 µM hydrocortisone hemisuccinate. At confluence (after 2 weeks), HepaRG cells were further incubated in the same medium, but supplemented with 1.7% dimethyl sulfoxide for 2 additional weeks to obtain confluent
differentiated cultures containing equal proportions of hepatocyte-like and progenitor/primitive biliary-like cells (16).
The differentiated hepatic cell cultures were used for the analytical assays. Human hepatocytes were obtained from Biopredic International (St Gregoire, France) in compliance with French bioethics legislation. Hepatocytes were isolated by collagenase perfusion of histologically normal liver fragments from 4 adult donors undergoing resection for primary and secondary tumors. Primary cultures were obtained by hepatocyte seeding at a density of 1.5×10⁵cells/cm2onto collagen-pre-coated plates in Williams’ E medium supplemented
as detailed above except for the addition of 10% fetal calf serum and 1 µg/ml bovine serum albumin. The medium was discarded 12 h after cell seeding, and the cultures were then maintained in the same medium as for the HepaRG cells and designated as conventional collagen cultured HH (CCHH), or maintained for 24 to 48 h and then washed with cold medium and overlaid with matrigel at a concentration of 0.25 mg/mL in ice-cold Williams’ E medium for the preparation of sandwich cultured HH (SCHH). The medium of both the CCHH and SCHH preparations was renewed daily. CCHH and SCHH were prepared from the same donors and analyzed in parallel. SCHH cultures were used after at least a 3 day-matrigel overlay.
1.3 [3H]-TCA efflux in control (untreated) HepaRG cells and primary human
hepatocytes
HepaRG cells and 4-5 days CCHHs and SCHHs were exposed to [3H]-TCA for 30 min. After washing, efflux
of radiolabeled TCA was assessed for different time points (0, 5, 15 and 30 min) in either standard with Ca2+ and Mg2+ or Ca2+- and Mg2+-free buffer. Cells were then scraped in 0.1 N NaOH and accumulation
of radiolabeled substrate into cells + bile canaliculi (in the presence of Ca2+- and Mg2+-ions) and into cells
only (in the absence of Ca2+- and Mg2+-ions) was measured through scintillation counting to evaluate TCA
efflux. Absence of divalent cations promotes disruption of tight junctions and induces bile canaliculi opening (Swift, 2010).
1.4 Efflux inhibition experiments
HepaRG cells were first exposed to 43.3 nM [3H]-TCA for 30 min to induce intracellular accumulation of
[3H]-TCA, then washed with standard buffer and incubated with CsA (0, 1, 5, 10, 25 and 50 µM) or CPZ (0,
20 and 50 µM) for different time points in a standard buffer with Ca2+ and Mg2+. After incubation, cells
were washed and incubated for 5 min with Ca2+- and Mg2+-free buffer in order to disrupt canalicular tight
junctions. Cells were then scraped in 0.1 N NaOH and the remaining radiolabeled substrate were measured through scintillation counting to determinate TCA efflux (Sharanek, 2014).
1.5 Uptake inhibition experiments
HepaRG cells were treated with different concentrations of CsA (0, 1, 5, 10, 25 and 50 µM) or CPZ (0, 20 and 50 µM) for 30 min. After washing, cells were loaded with [3H]-TCA-containing buffer at different time
points (10, 30, 60 and 150 min). After the incubation period, [3H]-TCA-containing buffer was removed and
cells were scraped in 0.1 N NaOH. The radiolabeled substrate was measured by scintillation counting to determinate TCA uptake. At the time they were used, HepaRG hepatocytes exhibited typical BC structures. As previously reported, HepaRG cells form bile acids (BA) and express BA metabolizing enzymes and BA transport activities and can be used to study drug-induced cholestatic effects. Primitive biliary cells do not express BA metabolizing enzymes or BA transporters (Sharanek, 2014).
1.6 Bile canalicular area quantification
Effects of CsA and CPZ on BC area were evaluated by time-lapse cell imaging and quantified by a software video analysis and a modelling tool (Tracker 4.87). Briefly, circular frames delimiting BC were manually
identified using the free hand selection tool of Tracker 4.87 to track and record brightness variations. These records reflected the area of BC.
2
Data pre-processing
All radioactive count data has been transformed by the transformation n = 2√N, where N denotes the
number of counts. Due to the Poissonian nature of count experiments, repeated measurements of the same sample would yield values for n with unit variance. Repeated measurements for different samples, i.e. biological replicates, yield values for n that necessarily have a higher variance. Therefore, the variance of 2√N for these samples is a measure for the heterogeneity between biological replicates.
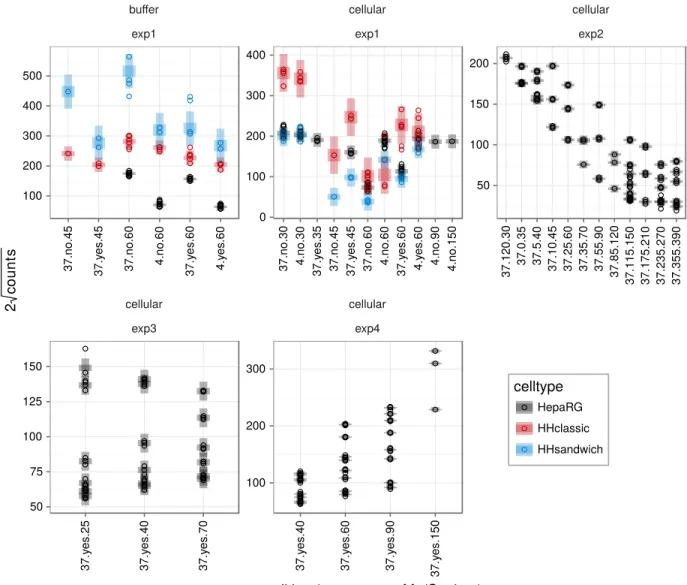
TCA has been measured in buffer or in cells for four experimental protocols, exp1, . . . , exp4. Data for each of these combinations have been pooled on a common scale and the variance has been estimated per celltype, i.e. HepaRG, HHclassic (human hepatocytes, classic culture) and HHsandwich (human hepatocytes, sandwich culture). The results are shown in Figure S1.
For the buffer measurements, human hepatocytes in sandwich culture (blue) show the highest variance, followed by the human hepatocytes in classic culture (red) and HepaRG cells (black). The shaded areas denote ±1 standard deviation and ±3 standard deviations of the pooled observations. The result is similar for cellular measurements where again human hepatocytes show a larger variance than HepaRG. Notably, the standard deviation of HepaRG does not exceed the value of 5.8 (cellular, exp1), for most experimental protocols it is even lower.
buffer exp1 cellular exp1 cellular exp2 cellular exp3 cellular exp4 100 200 300 400 500 0 100 200 300 400 50 100 150 200 50 75 100 125 150 100 200 300 37.no.45 37.y es.45
37.no.60 4.no.60 37.y
es.60
4.y
es.60
37.no.30 4.no.30 37.y
es.35
37.no.45 37.y
es.45
37.no.60 4.no.60 37.y
es.60 4.y es.60 4.no.90 4.no.150 37.120.30 37.0.35 37.5.40 37.10.45 37.25.60 37.35.70 37.55.90 37.85.120 37.115.150 37.175.210 37.235.270 37.355.390 37.y es.25 37.y es.40 37.y es.70 37.y es.40 37.y es.60 37.y es.90 37.y es.150 condition (temperature.Mg/Ca.time) 2 co un ts celltype HepaRG HHclassic HHsandwich
Figure S1: Data pre-processing. Twice the square root of the number of counts are plotted versus the different conditions. The data has been divided into buffer/cellular measurements and experimental protocols exp1, exp2, exp3 and exp4. Data from different celltypes are distinguished by color. Each dot represents one measurement. Confidence intervals with a 1σ and 3σ confidence level are visualized as shaded areas.
3
Model specification
The dynamic model of TCA transport in HepaRG cells is specified by a table of reactions and a list of expressions, specifying the rate constants and compartment volumes.
3.1 Table of reactions
The following table lists the elementary processes in the language of chemical reactions.
3.1.1 TCA transport