Publisher’s version / Version de l'éditeur:
Vous avez des questions? Nous pouvons vous aider. Pour communiquer directement avec un auteur, consultez la
première page de la revue dans laquelle son article a été publié afin de trouver ses coordonnées. Si vous n’arrivez pas à les repérer, communiquez avec nous à [email protected].
Questions? Contact the NRC Publications Archive team at
[email protected]. If you wish to email the authors directly, please see the first page of the publication for their contact information.
https://publications-cnrc.canada.ca/fra/droits
L’accès à ce site Web et l’utilisation de son contenu sont assujettis aux conditions présentées dans le site LISEZ CES CONDITIONS ATTENTIVEMENT AVANT D’UTILISER CE SITE WEB.
Proceedings of the RCI 22nd International Convention, pp. 105-116, 2007-03-01
READ THESE TERMS AND CONDITIONS CAREFULLY BEFORE USING THIS WEBSITE. https://nrc-publications.canada.ca/eng/copyright
NRC Publications Archive Record / Notice des Archives des publications du CNRC :
https://nrc-publications.canada.ca/eng/view/object/?id=c051c23e-a4bd-4fb6-b3c5-6e01bac53116 https://publications-cnrc.canada.ca/fra/voir/objet/?id=c051c23e-a4bd-4fb6-b3c5-6e01bac53116
NRC Publications Archive
Archives des publications du CNRC
This publication could be one of several versions: author’s original, accepted manuscript or the publisher’s version. / La version de cette publication peut être l’une des suivantes : la version prépublication de l’auteur, la version acceptée du manuscrit ou la version de l’éditeur.
Access and use of this website and the material on it are subject to the Terms and Conditions set forth at
A New test method for quantifying air leakage of a
mechanically-attached roofing assembly
http://irc.nrc-cnrc.gc.ca
A N e w t e s t m e t h o d f o r q u a n t i f y i n g a i r
l e a k a g e o f a m e c h a n i c a l l y - a t t a c h e d r o o f i n g
a s s e m b l y
N R C C - 4 9 4 3 8
M o l l e t i , S . ; B a s k a r a n , B . A .
A version of this document is published in / Une version de ce document se trouve dans: Proceedings of the RCI 22nd International Convention, Orlando, Florida, March 1-6, 2007, pp. 105-116
The material in this document is covered by the provisions of the Copyright Act, by Canadian laws, policies, regulations and international agreements. Such provisions serve to identify the information source and, in specific instances, to prohibit reproduction of materials without written permission. For more information visit http://laws.justice.gc.ca/en/showtdm/cs/C-42
Les renseignements dans ce document sont protégés par la Loi sur le droit d'auteur, par les lois, les politiques et les règlements du Canada et des accords internationaux. Ces dispositions permettent d'identifier la source de l'information et, dans certains cas, d'interdire la copie de documents sans permission écrite. Pour obtenir de plus amples renseignements : http://lois.justice.gc.ca/fr/showtdm/cs/C-42
A New Test Method for Quantifying Air Leakage of a
Mechanically-Attached Roofing Assembly
1 2c
Suda Molleti, Ph.D., Bas A. Baskaran Ph.D., P.Eng.,
1 2
Research Officer, Senior Research Officer National Research Council
1200 Montreal Road, Ottawa, ON, Canada, K1A OR6
Abstract
Air intrusion into roof assemblies is a concern for wind uplift resistance and life cycle performance of roofs. Airflow control is usually achieved by the installation of a barrier/retarder in the roofing assembly. Even though the concept of air barrier/retarder and air barrier systems has been around for decades, it is still pretty much a new notion to the roofing industry. Currently, there are no widely accepted standard specifications or test methods to determine the air leakage through a roof. An experimental procedure has been under development at National Research Council of Canada to quantify the air intrusion into roof assemblies. As part of this investigation, five roofing assembly configurations were quantified for air leakage. Relative performance of the air retarding effect of the five assemblies indicated that assemblies with a barrier/retarder had lower air leakage rates than without. Measured air leakage rates are compared with the existing codes of practice and standards. This comparison clearly demonstrates the significance of air intrusion into the roofing assembly and the necessity of a standardized air leakage test method for the roofing industry.
Keywords: roofs, roof components, assemblies, air leakage, air intrusion, test method, wind.
c
INTRODUCTION
Built-up roofing assemblies (BUR) have dominated the roofing industry for over a century (Baskaran, et al 1997). In the BUR, different plies of roofing felt are fully adhered to the substrate and this continuity offered significant resistance to air flow. Therefore much of the research efforts have been focused on the system performance rather than the study of air leakage into the roofing assembly. In the 1970’s single-ply roofing systems emerged as the next generation of low slopped roofing assemblies, replacing the labor intensive BUR. Within the single-ply roofing systems, the membrane can be mechanically attached, fully adhered, ballasted or air pressure equalized. The membrane can be a single ply membrane such as PVC (Polyvinyl Chloride), EPDM (Ethylene Propylene Diene Monomer) and TPO (Thermoplastic Olefin) or a two-ply as in the case of modified bituminous membranes. A roofing assembly in which the membrane is attached, through insulation and other components, to the structural deck at discrete points using fasteners is known as a Mechanically Attached Assembly (MAA) and this system will be focus of the present study.
Approximately one fourth of North American low slope/commercial buildings are roofed with MAA (NRCA 2004). Recent, wind uplift performance studies of the MAA (Baskaran, et. al 2006) identified that air intrusion into the assembly is one of the major factor that affects the performance. For airflow to occur, there must be both:
1. a pressure difference between two locations,
2. a continuous flow path or opening connecting the locations
MAA meet these two prerequisites during wind uplift conditions. Figure 1 illustrates the airflow mechanism through MAA. The waterproof membrane, which acts as an air barrier/retarder, is placed on top of the insulation and attached to the structural steel deck using mechanical fasteners. The attachment locations are then overlapped and seamed. Wind induced suction lifts the membrane and causes membrane elongation and billowing between the attachments. The magnitude of the wind induced suction; the membrane’s elastic properties and the fastening
pattern determine the deflection of the membrane billowing. The momentary displacement or billowing of the membrane creates a relative negative pressure below the lifted membrane and this draws indoor air into the roof, thereby satisfying the first prerequisite. The second prerequisite is met by the lack of airflow control at the deck level. Flow paths are created by the component’s air permeability and joints/junctions/ penetrations in the roofing assembly.
Despite the significance of air leakage on roofing systems performance, currently, no study exists in the literature (Molleti, 2006) that addresses the air leakage characteristics of a roofing assembly. Therefore, a research study was initiated at the National Research Council of Canada (IRC/NRC) with the objective of developing a new test procedure for air leakage quantification of roofing assemblies. This paper presents air leakage data from five roofing assemblies. It also compares the measured air leakage rates of the assemblies with the requirements prescribed in the codes.
EXPERIMENTAL APPROACH
Recently, Molleti and Baskaran (2006) reported the details of the newly developed air leakage test method for roofing assemblies. Figure 2 illustrates the experimental setup developed for the air leakage quantification. As shown in Figure 2, the test frame has a dimension of 2 m x 6 m x 0.8 m (79” x 236” x 32”). The test specimen/roof assembly is installed in the frame, which is supported on a lifting mechanism with adjustable jacks. This feature allows for investigating different roofing assembly thicknesses accommodating different roofing components.
The relevant experimental quantities to be determined in an air leakage test method are the applied test pressure difference and the corresponding volumetric airflow rate. The applied test pressure difference across the test specimen is detected by using Setra differential pressure transducers, which have a measuring range up to 10 kPa (200 psf) and an accuracy of 0.14% of the full-scale reading, and the corresponding airflow rate is measured using Merriam laminar
flow elements with three flow ranges of 212 L/M (7.5 CFM), 1130 L/M (40 CFM) and 11300 L/M (400 CFM), depending on the air tightness of roofing assembly type. The output of the airflow and pressure measuring devices is connected to the data acquisition system (DAS), which records and plots the respective data on a GUI interface.
Following the above experimental setup (Figure 2) the present study quantified air leakage rate of five roofing assembly configurations. The five roofing assemblies are:
Assembly 1 (A1) – Steel deck and a layer of insulation Assembly 2 (A2) – Steel deck and two layers of insulation
Assembly 3 (A3) - Steel deck, a layer of insulation and building paper as a barrier/retarder
Assembly 4 (A4) - Steel deck, a layer of insulation and SBS modified self adhered membrane sheet as barrier/retarder
Assembly 5 (A5) - Steel deck, a layer of insulation and a 6-mil polyethylene sheet as a barrier/retarder (retarder)
This experimental study was intended to measure only the air leakage associated with the field of the roof and it does not include leakage at the openings or perimeter of the roof. The experimental setup assumed that in a roofing assembly the continuous waterproof membrane is airtight and thereby it can be excluded from the investigation. Therefore all the experimental mock-ups were constructed up to the insulation level. As the system installation is same for all the tested assemblies the construction procedure can be classified into five steps:
Deck Installation
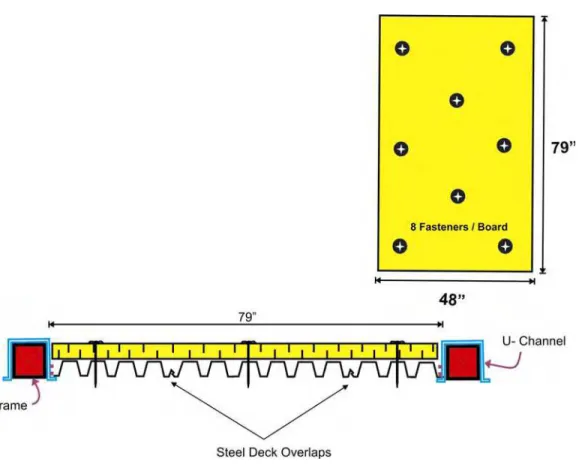
This experimental set up is intended to measure the wind uplift resistance associated with the field zone of the roof. In order to achieve this, the edge treatment of the test assembly was handled by installing steel U-channels along the perimeter of the test frame as shown in Figure 3. As the width of table was 2006 mm (79”), one full sheet of 914 mm (36”) wide and two cut pieces of 610 mm (24”) and 483 mm (19”) wide steel decks were installed along the
table length as shown in Figure 5. The steel deck was 0.76 mm (22-Ga) thick with a profile height of 38 mm (1.5”) and a flute width of 150 mm (5.9”). The black dotted lines indicate the deck overlaps. To eliminate the air leakage along the edges of the deck, the steel deck edges are butted to the U-channel, and the gap between them was sealed using sealant and adhesive membrane as shown in Figure 3. Thus, the field zone of the roof is simulated, assuring that the airflow occurs along the steel deck seams and not the deck edges.
Barrier/retarder Installation
In the present experimental setup, barrier/retarder means a component installed in the roofing assembly to prevent airflow into the system. Three types of barrier/retarders are used:
i) Polyethylene film -single layer of 6 mil (0.006 ”) sheet
ii) Building Paper - 15mil thick (0.015”) asphalt-impregnated paper. It comes in a length of 44 m (144’) and width of 914 mm (36”).
iii) SBS modified self-adhered membrane sheet – 0.8 mm thick (1/32”) self-adhered sheets. They are composed of SBS modified bitumen and surface reinforced, and it comes in strips of 1140 mm wide (45”).
Figure 4 shows the installation of the three barriers/retarders. A3 had building paper as the barrier/retarder and since the building paper comes in width of 914 mm (36”) two full sheets of 914 mm (36”) and one cut sheet of 457 mm (18“) were laid on the steel deck. The sheets had an overlap of 152 mm (6”) and by using adhesive (vapour-bloc glue) the overlaps were joined. The edges of the building paper were pulled and bent at 90o over the U channel and sealed to the U channel as shown in the Figure 4, and at the corners the building paper was cut at 45o and folded over the U-channel. A4 had self adhered membrane sheet (SAM) as barrier/retarder and as SAM also comes in sheet widths of 914 mm (36”) the installation procedure is similar to the building paper except this is a self-adhered film, which adheres directly to the top flange of the steel deck. For A5, a continuous sheet of polyethylene was
installed on the steel deck. The edges of the polyethylene sheet were pulled and bent at 90o over the U channel as shown in the Figure 4. The edge treatment of the polyethylene sheet was similar to the building paper in A3.
Insulation Installation
Figure 5 illustrates the cross section view of the two-insulation layouts and Figure 6 shows the typical layout of insulation attachment. For all the five tested assemblies, 51 mm (2”) thick polyisocyanurate boards with a compressive strength of 170 Kpa (25 psi) were used as the insulation. In A1, A3, A4 and A5 insulation configuration comprised of a layer of insulation with four full boards of 1219 mm x 2006 mm (48” x 79”) and one partial board of 1118 mm x 2006 mm (44” x 79”) installed with the long edges perpendicular to the deck flutes. In A2, the insulation layout is similar to the former assemblies except that it comprises of two layers of insulation in staggered arrangement. The insulation boards were mechanically fastened to the steel deck with 76 mm (3”) diameter circular plastic plates and 127 mm (5”) long fasteners. Each insulation board was attached with 8 fasteners, which has a fastener density of one fastener per 0.3 m2 (3.3 ft2)
Installation of the Separator
With the insulation in position and fastened to the deck, a square meshed wooden separator was installed on top of the insulation as shown in Figure 7. The role of the separator is to provide the gap or space between the test specimen and the impermeable cover for creating uniform differential pressure across the specimen and for allowing the airflow without any obstruction. A minimum gap of 50mm (2”) was maintained for this purpose. After the completion of the separator installation, two pressure taps are installed on either ends of the test specimen. These pressure taps measure the differential pressure across the test specimen.
Installation of the Impermeable Cover:
separator. The overhang edges of the impermeable cover were adhered to the frame edges, thus eliminating any extraneous airflow into the test specimen. Provisions were made to install the flow measurement setup by making a 50 mm (2”) diameter opening on top of the impermeable cover. One end of the flow measurement setup has an air filter, which was inserted into the test specimen, and the other end was connected to the air system. In between them, the flow-measuring device and the adjustable control valve were installed. The former measures the airflow rate and the latter controls the applied pressure.
RESULTS AND DISCUSSION
As discussed above, the relationship between the two parameters namely the differential pressure across the assembly and the volumetric airflow rate characterizes the air leakage rate of the assembly. To obtain these parameters, the following test procedure of depressurization technique was followed:
• Differential pressure in the range of 480 Pa (10 psf) to 2870 Pa (60 psf) in increments of 480 Pa (10 psf) will be applied across the assembly.
• At each applied target pressure, allow the pressure to stabilize for a minimum duration of 60 secs.
• After the pressure stabilization, the airflow measurements will be recorded for a minimum duration of 60 secs.
Following the above test procedure, the five assemblies were quantified for air leakage. All tests were carried out in an indoor laboratory environment (air pressure 101 kPa, ambient temperature 21oC and air density 1. 202 kg/m ). The tested assemblies can be categorized into 3 two sets:
• Set 1: Assembly without barrier/retarder – A1 and A2 • Set 2: Assembly with barrier/retarder – A3, A4, A5
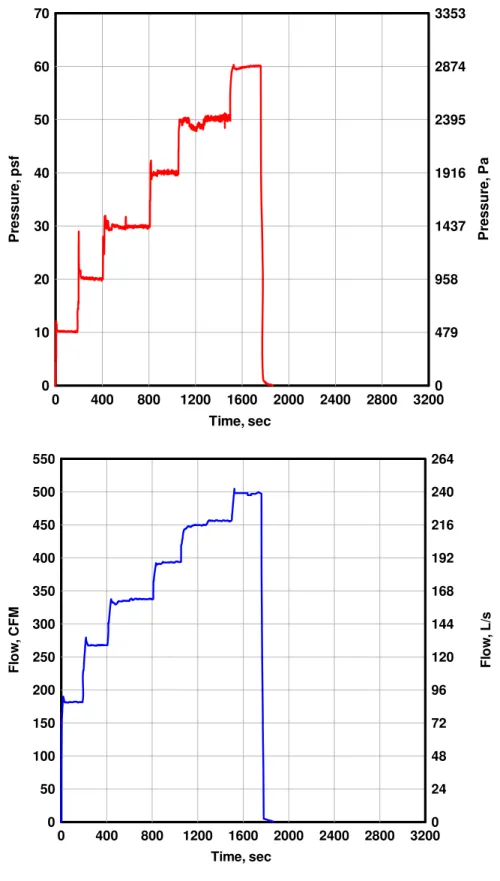
Figures 9 and 10 shows a typical measured pressure and flow time histories of two assemblies, one without barrier/retarder (A1) and other with barrier/retarder (A5) respectively. The pressure
time history is a measure to verify whether the applied pressure equals the target pressure of the test protocol. The applied pressure at each pressure level comprises of three parts: 1) Pressure Build-up 2) Pressure Stabilization 3) Pressure Measured (Molleti and Baskaran, 2006). As per the test procedure, the pressure is measured for a minimum duration of 60 secs after it stabilizes. The pressure stabilization varies from assembly to assembly and is dependent on the air tightness of the tested assemblies, which leads to varying testing time as shown on the X-axis of the Figures 9 and 10. Error analysis was performed between the target pressures and the measured pressure for all the assemblies. Data indicates that the measured pressure showed an error of 0.2% deviation from the target. As shown in Figure 10, the peaks in the pressure measurement for both the assemblies can be attributed to the manual operation of the control valve.
Note that these selected differential pressures are significantly higher when compared to existing wall test procedures. No specific pressure level was identified for representing the air leakage rate of roofs, similar to the case of wall assemblies at 75 P a (1.5 psf). Recently developed Wind Design Guide (Baskaran and Smith, 2005) provides procedure for calculating wind induced design pressure on roof coverings. Such calculation procedure and practical input from the members of the on going consortia (ref. Acknowledgement section) will be used to reach consensus about the pressure level at which air leakage rates will be reported for the roof assemblies.
Figure 11 presents the measured air leakage rate of the five assemblies. Data clearly indicates that A1 and A2without barrier/retarder had a greater leakage rate when compared to the assemblies with barrier/retarder namely A3, A4 and A5. The present study also attempts to answer whether the staggered arrangement of insulation boards as in A2 can be as effective as that of having a barrier/retarder in an assembly. The comparison of the data from Figure 11 points out that the staggered arrangement of insulation in A2 certainly provided the air retarding effect in comparison to A1, however it proved to be not as effective as the assemblies with
barrier/retarder (A3, A4, & A5). It is also to be noted that in Figure 11, no air leakage data is presented for A3 (with building paper) beyond 1440 Pa (30 psf). The reason was, during the air leakage testing of A3, at one corner a 45o cut made in the building paper opened up or enlarged. This lead to a drastic increase in the airflow rate and as a result the test was stopped. Irrespective of this drawback A3 provided a good air retarding effect upto 1440 Pa (30 psf).
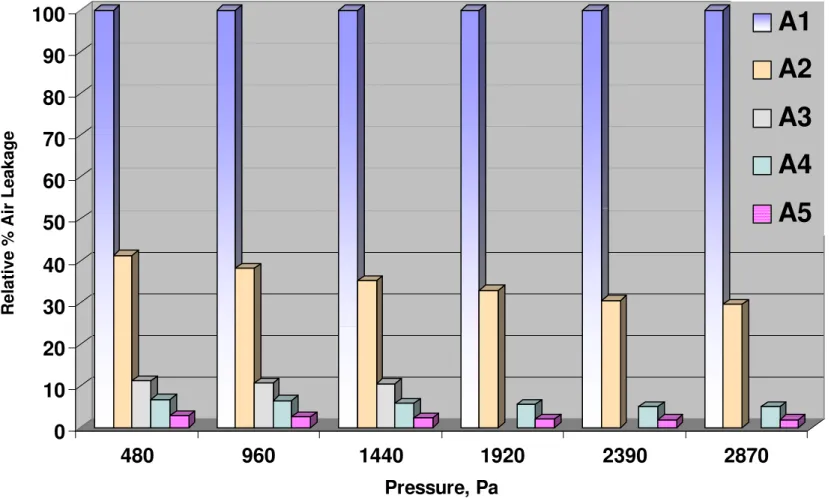
To further illustrate the relative performance of the air retarding effect of the different assemblies, Figure 12 presents the percentage air leakage of the assemblies relative to A1. To get a better understanding, a typical pressure of 1440 Pa (30 psf) was selected for the following discussion. If it is assumed that A1 without any barrier/retarder had 100% air leakage, then relative to the air leakage of A1, observations can be summarized as follows:
• A2 with staggered insulation has 35% of air leakage of A1 or air leakage reduced by 65% • A3 with building paper has 10% of air leakage of A1 or air leakage reduced by 90% • A4 with self-adhered film 6% of air leakage of A1 or air leakage reduced by 94%, • A5 with polyethylene sheet has 2% of air leakage of A1 or air leakage reduced by 98% High leakage rate of A1can be attributed to the channel flow occurring at the deck and insulation joints. With the inclusion of another layer of insulation, A2, did provide good air leakage resistance by reducing 65% of air intrusion, however it could not be as effective as assemblies with a barrier/retarder. The channel flow between the joints in the insulation boards was providing the necessary flow path for air movement into the assembly. A4 and A5 with self adhered film and polyethylene sheet as barriers/retarders, showed good air leakage resistance. The reduced air leakage resistance of A3 could be mainly attributed to the seam joints and corner edge treatments of the building paper. It should be noted that the building paper being a soft material, if not properly installed has a tendency to tear. Within the assemblies with barrier/retarders, A5 showed better air leakage resistance by reducing airflow by 75% and 60% compared to A3 and A4. However, it should be noted here that the polyethylene sheet in A5 was continuous without any seam joints, which represents the best-case scenario.
For an air barrier/retarder system in opaque, insulated portions of the building envelope, Part 5 of the NBCC (2005) recommends three permissible air leakage rates corresponding to various indoor humidity levels as shown in Table 1. To verify whether the tested assemblies comply with this code requirement, air leakage rates of the five assemblies were calculated at 75 Pa (1.56 psf) and compared with the NBCC [based on the laboratory testing condition 0.15 L/s.m2 (0.03 ft3/min.ft2) was selected] as shown in Figure 13. A1 had a leakage rate of 2.52 L/s.m2 (0.5 ft3/min.ft2) , A2 had 1.56 L/s.m2 (0.31 ft3/min.ft2), A3 had 0.30 L/s.m2 (0.06 ft3/min.ft2), A4 had 0.26 L/s.m2 (0.051 ft3/min.ft2) and A5 had 0.12 L/s.m2 (0.023 ft3/min.ft2 ) respectively. Comparison of these data with the NBCC indicates that none of the assemblies except A5 comply with the NBBC code requirement. However, once again it should be remembered here that the assembly set-up of A5 represents the idealistic construction procedure having proper edge treatment and no seam joints, which has achieved its end result demonstrating the significance of air intrusion. Similarly, ASTM E1677-2005, Standard Specification for an Air Barrier (AB) Material or System for Low-Rise Framed Building Walls, calls for an assembly air permeance requirement of 0.30 L/s.m2 (0.06 ft3/min.ft2) at 75 Pa (1.5 psf). However, the standard restricts this permissible leakage rate to the opaque walls. Therefore, the comparison presented in Figure 13 relative to ASTM E1677 is not really applicable to roofing assemblies, however, it signifies the necessity of similar air leakage resistance requirement for roofing assemblies.
Analogous to the ASTM E1677, it should be noted here that the NBCC (2005) recommended air leakage rates are also the outcome of the research pertaining to walls, which have been generalized as a requirement for air barrier/retarder systems in opaque, insulated portions of the building envelope. Once again, though the comparison in Figure 13 might not reflect the air leakage resistance requirement of roofing assemblies, it has clearly achieved its end result clearly demonstrating the significance of air leakage into the roofing assembly and the necessity of developing air leakage test standard for roofing assemblies with recommended
deign guidelines for barriers/retarders in the assembly. Additional research efforts are in progress in the enhancement of this test method such as component requirements, structural capacity, installation techniques, and overall develop a standard for air barrier system in roofing assembly, which can lead to development of generalized “best practice” recommended air leakage rates for the air barrier systems of building envelope.
CONCLUSION
Currently no procedure or standard exists for quantification of air leakage through roofing assemblies. To quantify the air leakage performance of this roofing assembly, the authors have developed a test method. Based on this test method, the present paper investigated five roofing assemblies with and without barrier/retarder and quantified their air leakage performance. Data clearly indicated that assemblies without barrier/retarder had a high rate of air leakage, compared to assemblies with barrier/retarder. The present experimental study also attempted to solve the myth that currently exists in the minds of some people in the roofing industry that the staggered arrangement of insulation boards can be as effective as that of having a barrier/retarder in an assembly. The reality was, the staggered insulation can indeed provide certain air retarding effect, and however it cannot be considered as an effective barrier/retarder. Comparison of the measured air leakage rates of the five assemblies with the NBC (2005) recommended system air leakage rates clearly attested that except the assembly with polyethylene sheet as barrier/retarder none of the other assemblies complied with the code. It is worth mentioning here that, in the conventional assembly the waterproofing membrane acts as an air barrier preventing air infiltration from outside to inside (if installed properly), however from the interior of the building it cannot act as an air barrier for preventing air infiltration into the roof assembly. In general, code requirement comparison clearly demonstrates the significant amount of air leakage into the roofing assembly and the necessity of air barrier/retarder test standard for roofing assemblies. Development of this test method is a starting point for investigating the
impact of air barrier/retarder systems in the roofing assembly performance such as wind uplift performance, sustainable energy, moisture migration and most important increasing the longevity of the roofs.
ACKNOWLEDGMENTS
The presented research is being carried out for a consortium, the Special Interest Group for Dynamic Evaluation of Roofing Systems (SIGDERS) formed from a group of partners interested in roofing design. These partners included:
Manufacturers Atlas Roofing Corporation, Canadian General Tower Ltd., Carlisle Syn Tec., GAF Materials Corporation, GenFlex Roofing Systems, Firestone Building Products Co., IKO
Industries Ltd., ITW Buildex, Johns
Manville, Sarnafil
Roofing, Soprema Canada, Stevens Roofing, Tremco and Trufast.Building Owners Canada Post Corporation, Department of National Defence, Public Works and Government Services Canada.
Industry Associations Canadian Roofing Contractors' Association, Canadian Sheet Steel Building Institute, National Roofing Contractors’ Association and Roof Consultants Institute.
REFERENCES
ASTM (American Society for Testing and Materials) 2005, Standard Specification for an Air Barrier (AB) Material or System for Low-Rise Framed Builing Walls, E1677-2005
Baskaran, A., R.M. Paroli and R.J. Booth. 1997. “Wind Performance Evaluation Procedures for Roofing Systems Current Status and Future Trends.” Pp. 37-52 in Fifth International Conference on Building Envelope Systems and Technology, BATH, U.K.
Baskaran, A., Molleti, S. & Sexton, M. 2003. Wind uplift performance of mechanically attached roofing systems with vapor barrier, 9th Conference on Building Science and Technology, Vancouver, British Columbia, Canada, February 27-28.
Baskaran, A., S. Molleti and R.J. Booth. 2006. “Understanding Air Barriers in Mechanically Attached Low Slope Roofing Assemblies for Wind Uplift.” Pp. 443-450 in Proceedings of the 3rd International Building Physics/Science Conference, Montreal, August 2006.
Baskaran, A. and T.L. Smith. 2005. A Guide for the Wind Design of Mechanically Attached Flexible Membrane Roofs. National Research Council of Canada, Ottawa, Ontario, Canada, K1A 0R6.
Molleti, S. 2006. “Performance Evaluation of Mechanically Attached Roofing Systems.” Ph.D. thesis, University of Ottawa, Ottawa, Canada.
Molleti, S and Baskaran, A.,. 2006. “Development of a New Test Method for Air Leakage
Quantification of Roofing Assemblies”. Submitted to the ASTM - Journal of Testing and Evaluation, September
National Roofing Contractors Association (2004), “Hurricane Charley: A Preliminary Report”, Professional Roofing Magazine, NRCA, October.
NRC (National Research Council). 2005. National Building Code of Canada, Part 5. Ottawa: National Research Council of Canada, Ottawa, Ontario, Canada, K1A 0R6.
Table 1: Recommended Maximum Air Leakage Rates as per the existing codes of practice and standard
Codes of Practice and Standard
Warm Side Relative Humidity at 21
Recommended Maximum System Air Leakage Rate, L/
(s.m o C 2 ) at 75 Pa < 27 % 0.15 27 to 55% 0.10 NBC (2005) > 55% 0.05 None 0.3 ASTM* Note:
*ASTM E1677-2005, Standard Specification for an Air Barrier (AB) Material or System for Low- Rise Framed Building Walls
Figure 2: Ex perimental s e t-up for de termin ation o
f air flow res
istanc e of ro ofs Page 15 of 2 5
Overlap of
the barrier
seam
(a) One Layer Insulation
(b) Two layer staggered insulation
(a) One layer insulation layout (Front view along the table width)
(a) Two layer staggered insulation layout (Side view along the table length)
Figure 7: Installation of the separator
0 400 800 1200 1600 2000 2400 2800 3200 Time, sec 0 10 20 30 40 50 60 70 P ress u re , ps f 0 479 958 1437 1916 2395 2874 3353 Pr e s s u re , P a 0 400 800 1200 1600 2000 2400 2800 3200 Time, sec 0 50 100 150 200 250 300 350 400 450 500 550 Fl o w , C F M 0 24 48 72 96 120 144 168 192 216 240 264 Fl ow , L/ s
0 400 800 1200 1600 2000 2400 2800 3200 Time, sec 0 10 20 30 40 50 60 70 Pr e s s u re , p s f 0 479 958 1437 1916 2395 2874 3353 Pr e s s u re , P a 0 400 800 1200 1600 2000 2400 2800 3200 Time, sec 0 5 10 15 20 25 30 35 40 Fl ow , C F M 0 2.4 4.8 7.2 9.6 12 14.4 16.8 19.2 Fl ow , L /s
0
50
100
150
200
250
A1
A2
A3
A4
Flow, L/s
A5
480
960
1440
1920
2390
2870
Pressure, Pa
Figure 11 : Ai r leakage ra te of the five tes ted as se mblies Page 23 of 2 50
10
20
30
40
50
60
70
80
90
100
Relative % Air Leakage
480
960
1440
1920
2390
2870
Pressure, Pa
A1
A2
A3
A4
A5
0.15
0.3
2.52
1.56
0.30
0.26
0.12
0
0.5
1
1.5
2
2.5
3
Air leakae rate (L/s-m
2


![[PDF] Cours PowerPoint 2007 pour débutant en pdf | Cours informatique](data:image/gif;base64,R0lGODlhAQABAIAAAP///wAAACH5BAEAAAAALAAAAAABAAEAAAICRAEAOw==)