The Application of Signaling Networks to Cancer Metastasis and
Cellular Motility through the EGFR Pathway
by
Ranjeetha Bharath S.B., Mechanical Engineering
Massachusetts Institute of Technology, 2013
ARCHNES
MASSACPUrET) '-T T rr OF L T4H LJUL 302015
L-
LIBRARIES
Submitted to the MIT Department of Mechanical Engineering in Partial Fulfillment of the Requirements for the Degree of
S.M. in Mechanical Engineering at the
Massachusetts Institute of Technology June 2015
Massachusetts Iinstitute of Technology 2015. All rights reserved.
Signature of Author
S
...
ig
atUre
redacted
...
MIT School of Engineering a t ent of Mechanical Engineering
Signature redacted
May 8,2015Certified by ..
Linda G. Griffith
Certified by...Signature
red acted
Thesis Supervisor Certified# by"... ...
Douglas A. Lauffenburger Thesis Supervisor
Accepted by...Signature
redacted
The Application of Signaling Networks to Cancer Metastasis and
Cellular Motility through the EGFR Pathway
by
Ranjeetha Bharath
S.B., Mechanical Engineering
Massachusetts Institute of Technology, 2013
Submitted to the MIT Department of Mechanical Engineering in Partial Fulfillment of the Requirements for the Degree of
S.M. in Mechanical Engineering at the
Massachusetts Institute of Technology June 2015
Submitted on May 8, 2015
Abstract
This thesis explores the problem of cancer metastasis by analyzing the various downstream components of the epidermal growth factor receptor (EGFR) pathway. This work develops a mathematical model that consists of partial differential equations and signaling networks. Analysis techniques for these nonlinear reaction-diffusion equations included a study of the biological background and motivation, along with computational simulation of the various sets of models developed. The modeling effort combined biochemical reaction-diffusion equations for various species with mathematical descriptions of the mechanical machinery of the cell to characterize the foundations of cell movement in response to stimuli. By quantifying and qualifying the signaling networks and molecular pathways involved in cellular signaling and linking intracellular signaling to the mechanical machinery of the cell, it is possible to quickly check in silico the effects of changing various feedback parameters and signaling molecule concentrations. By creating a model of this process, it is possible to perform rapid tests of different pharmaceuticals on the biochemical and biomechanical pathways, in order to assess how they would affect cell motility and cancer metastasis on a large scale.
Table of Contents
Abstract ... 2
Table of Figures ... 4
Acknow ledgem ents... 7
Chapter 1: Introduction ... 8
Chapter 2: Background ... 11
2.1 Sm all GTPases ... 15
2.2 Epiderm al Growth Factor Receptor (EGFR) ... 17
2.3 Actin N etw ork... 19
2.4 Contractile M achinery and Integrins ... 22
Chapter 3: M athem atical M odel and M ethods... 24
3.1 M athem atical and Biochem ical Background ... 24
3.2 M odules and D escriptions... 28
3.3 Relational Analysis ... 41
3.4 Software and Com putational M odeling ... 42
3.5 M odeling Progression ... 46
3.6 Challenges to M odeling ... 48
3.7 M odels... 49
Chapter 4: Results ... 52
4.1 Cell Polarization... 52
4.2 Param eterization to M atch Experim ental Data... 54
4.3 PIP2 Concentration Test ... 56
4.4 Initial Conditions and Boundary Conditions ... 57
4.5 EG F and M enai ... 58
4.6 EGF-Induced Polarization ... 62
4.7 3D Results... 64
4.8 Double-Peak in the Barbed n e ... 72
Chapter 5: Applications and Future W ork ... 80
Chapter 6: Conclusion... 82
Table of Figures
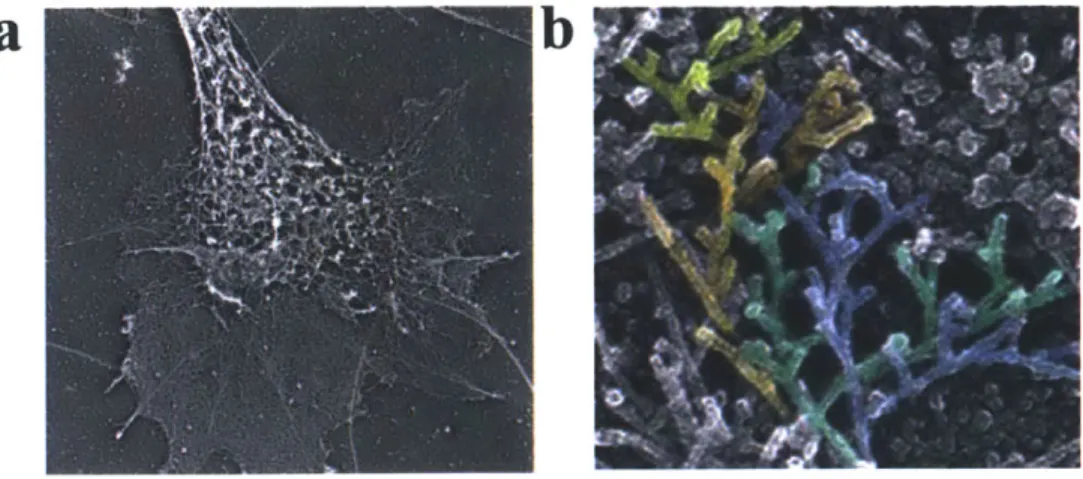
Figure 1 (a) The process of cancer cells entering and exiting the bloodstream (Lee, 2007). (b)
Cellular mechanical components (Taylor, 2011)... 9
Figure 2. The three stages of cell crawling across a surface. (Cooper, 2000) ... 12
Figure 3. 3D Imaging of invadopodia (Albiges-Rizo, 2009)... 12
Figure 4. Methods of cellular invasion in cancer metastasis and the key components involved (N um berg, 20 11)... 13
Figure 5. Epithelial to mesenchymal transition (Kalluri, 2009). ... 14
Figure 6. Intravasation and extravasation (Reymond, 2013)... 15
Figure 7. Small GTPase activation-inactivation process, mediated by GEFs (Etienne-M anneville, 2002)... 15
Figure 8. Spatial organization of RacI, Cdc42, and RhoA using biosensors (Machacek, 2009).16 Figure 9. Spatial organization of Rac, Rho, and CDC42 in a cell to improve modeling efforts (M aree, 2006)... 17
Figure 10. Key cellular receptors and selected pathways in metastasis (Ciardiello, 2008)... 18
Figure 11. (a) Electron microscopy showing actin cytoskeleton (NIH) (b) highlighting individual families of branching filaments in actin (Svitkina) ... 19
Figure 12. Arp2/3 creating actin branching (Nurnberg, 2011) ... 20
Figure 13. (a) Normalized elastic modulus for actin (Chaudhuri, 2007). (b) Structures composed of actin filam ents (Lodish, 2000)... 20
Figure 14. Fit to actin polymerized using model described above (Sept, 2001)... 22
Figure 15. Myosin proteins walk along the actin fibers. (Berg, 2002) ... 22
Figure 16. Integrins embedded in the plasma membrane, linking intracellular proteins with the extracellular m atrix. (Cooper, The Cell. 2001)... 23
Figure 17. Michaelis-Menten kinetics; reaction rate plotted against substrate concentration (B erg, 2002)... 24
Figure 18. Diffusion process depicted graphically; particles diffuse through random walks... 26
Figure 19. Partial differential equations evaluated in ID vs 3D... 27
Figure 20. Sample constant values from literature (Dawes, 2007)... 28
Figure 21. Steps involved in MATLAB implementation of algorithms... 42
Figure 22. Sample finite element mesh for COMSOL implementation. ... 43
Figure 23. Example input page for COMSOL implementation... 44
Figure 24. Proposed MATLAB Graphical User Interface (GUI) ... 44
Figure 25. Simple network relating key species (Holmes, 2012). ... 46
Figure 26. Different levels of coverage and intricacy in models. (a) (Maree, 2006) (b) (Holmes, 2012) (c) N etw ork used in this w ork. ... 47
Figure 27. Control feedback to represent the black box that is being explored... 49
Figure 28. Species can be active in the cytosol region, membrane region, or both... 50
Figure 29. N etw ork used in this w ork... 51
Figure 30. Cellular polarization diagram . ... 52
Figure 31. (a) Localization of GTPases (Mayor, 2010). (b-d) Simulation results showing cellular polarization for Rho, Cdc42, and Rac... 53
Figure 32. (a) Original Rae result (b) Desired model result shape [not actual result] (c) Rac
ELISA data (Talento) ) (d) Parameter match to fit data (Talento) ... 54
Figure 33. (a) Experimentally matched simulation (b) Original simulation Results ... 55
Figure 34. (a-d) Set of plots displaying early model results for stochastic initial conditions... 56
Figure 35. Relationship between PIP2 hydrolysis and EGFR (Haugh, 1999)... 57
Figure 36. Sample view screen for COMSOL platform. ... 58
Figure 37. Mena affects cellular mechanical machinery (Gertler, 2011). ... 59
Figure 38. Change in PIP2 concentration for the absence (a) or presence (b) of EGF concentration from sim ulation results... 60
Figure 39. Change in barbed end metric with PIP3 to Rac feedback parameter. ... 61
Figure 40. Parameter variation to fit Rac data trend from ELISA experiment... 61
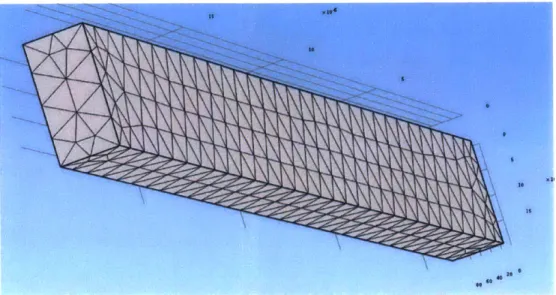
Figure 41. (a) EGF induced cell polarization. (b) Pathway diagram highlighting P13K linkage.62 Figure 42. The effect of PIP3 to Rac feedback on polarization using an EGF gradient stimulus. 63 Figure 43. Variety of early 3D modeling efforts. A, B, and C are COMSOL, D is Mathematica. ... 6 4 Figure 44. COMSOL implementation from first stages of 3D modeling process. ... 65
Figure 45. (a) Rae and (b) Rho in 3D and ID for a rectangular prism geometry... 65
Figure 46. (a) Rae concentrations in 3D (b) Rho concentrations in 3D; present at both ends as experim entally predicted... 66
Figure 47. (a) Myosin phosphatase. Black arrows show ring-like formation. (b) Different view ing angle... 67
Figure 48. a-b. Barbed end time series (0 and 30 seconds). Insignificant change in concentration. ... 6 8 Figure 49. Predictive approach to cellular geometry. (a) Initial cell shape. (b) Output to actomyosin network (Mak, 2014). (c) New cell shape. ... 68
Figure 50. (a) PLC Gamma simulation result, spiking begins in center and localized to one side. (b) PLC gamma stain in HeLa cell to show membrane ruffles (Santa Cruz Biotechnology). ... 69
Figure 51. (a) P IP3. (b) PIP2 ... . . . .. . . .. . . .. . . .. . . .. . . 69
Figure 52. PIP3 polarization without use of EGF stimulation to induce polarization; fails to capture essential biological concepts ... 70
Figure 53. Cdc42 stochastic initial conditions... 70
Figure 54. Stochastic initial conditions translated while moving downstream to ROCK. ... 71
Figure 55. Rac with original diffusion coefficient... 71
Figure 56. Rae with increased diffusion coefficient (two orders of magnitude) ... 71
Figure 57. The two key components of protrusion are shown. (a) The early peak based on cofilin. (b) The late peak based on Arp2/3. (c) The sum of both as the barbed end protrusion m etric . ... 73
Figure 58. (a) WAVE, WASP, and Arp2/3 spatiotemporal plot with low EGF stimulation (PI3Kinase pathway, the late pathway). X axis: Time 0 to 100 seconds; Y axis: Position across 20pm cell. (b) EGF increase with Pl3kinase increases protrusion and cellular polarization... 74
Figure 59. Variation in barbed end metric in response to changing the feedback between Cdc42 and N -W A S P . ... 75
Figure 60. Variation in barbed end metric in response to changing the feedback between PIP2 and N -W A SP . ... 75 Figure 61. (a) Barbed end assay for MTln3 cells (Mouneimne, 2004). (b) Model results for varying PIP2 to barbed end feedback. ... 77
Figure 62. (a) Barbed end assay for MTln3 cells, control and PLC inhibitor (Mouneimne, 2004). (b) Model results for PLC component and PLC inhibition. ... 77 Figure 63. A ctin peaking... 78 Figure 64. Capping rate and timescale analysis of first peak (normalized)... 78 Figure 65. The effect on the barbed end/actin parameter of increasing the model Mena parameter through a mechanistic inhibition mechanism on capping and actin elongation. ... 79 Figure 66. Actin and myosin Brownian dynamics simulation (Mak, 2014)... 80
Acknowledgements
I would like to thank Professor Doug Lauffenburger and Professor Linda Griffith for their incredible advice and support throughout this process. Without their invaluable guidance, none of this work would be possible. I want to thank them for this amazing opportunity and for taking the time to help me out with this.
I would also like to thank the National Institutes of Health for funding this work on cancer metastasis.
In addition, I would also like to thank Professor Roger Kamm, Professor Muhammad Zaman, Dr. Shannon Hughes, Dr. Michael Mak, Dr. Vivi Andasari, Dr. Fabian Spill, Ms. Suzanna Marie Talento, and Dr. Steve Wasserman for their support.
Chapter 1: Introduction
More than half a million Americans are expected to die each year from cancer; that is approximately 1,600 people per day. After heart disease, cancer is the leading cause of death in the United States. In fact, nearly one in four deaths is caused by cancer (ACS, 2014). Cancer metastasis is the process by which cancer spreads from one location in the body to multiple locations around the body. For example, a breast cancer tumor can potentially metastasize to the brain, lungs, bone, and other locations. Once cancer has spread, it becomes much more difficult to treat since it is no longer localized. Tumor metastasis accounts for approximately 90 percent of suffering and death in cancer patients (ACS, 2014).
When cancer metastasizes, cells leave their location of origin at the primary tumor site and spread to other parts of the body, traveling through the blood stream to get there. Cancer cells exert and experience many forces from their microenvironment as they go through this process. The cell must integrate various chemical and mechanical stimuli through its signaling network and then respond accordingly. Understanding, quantifying, and eventually controlling this process could potentially help with the development of effective therapeutics. On the way to a secondary tumor site, cells often pass through various microenvironments, including the "stroma, the blood vessel endothelium, the vascular system and the tissue at a secondary site" (Wirtz, 2011). Each microenvironment exhibits a new set of challenges for the cell to overcome. For example, a mammary tumor cell may encounter dense networks of collagen I and fibronectin, where crosslinking enhances integrin signaling and bundling (Wirtz, 2011). These different microenvironments provide a complicated array of interactions with the tumor cell as it metastasizes.
Thus, the feedback pathways between signaling and movement are intricate and difficult to characterize. In the process of modeling cancer metastasis, it becomes vital to identify key pathways and make simplifications in order to mathematically capture the most important steps that allow cancer cells to proliferate. It is helpful to understand and quantify metastasis in order to discover and target potential therapeutic and diagnostic targets. When modeling the signaling and motility pathways involved in metastasis, there are many challenges. For example, cells in three-dimensional environments have features that are different from motility on flat surfaces, such as pore size, fiber orientation, and structural components. In addition, the processes and linkages are extremely complicated and involve many different species that each behave differently when placed under various biological conditions. While it is useful and interesting to begin to understand the entire process of cancer metastasis, it is even more vital to select the key system players to model mathematically.
During cancer metastasis, cells break away from the tumor of origin, squeeze through the epithelial wall of blood vessels, and move around the body. Figure 1 a below shows the key components of
this process. Cancer cells leave the primary tumor site and invade the basement membrane, travel through the bloodstream, and adhere to a distant site. In the event that a tumor cell successfully implants at a new location and starts a secondary tumor, then the cancer has metastasized. Metastasis poses significant clinical challenges for treating cancer, because when the cancer has implanted at multiple sites throughout the body, it is much more difficult to locate and destroy. Many cells may leave a primary tumor, but each individual cell faces a large number of barriers before successfully implanting at a new tumor site. Cells must invade the basement membrane, chew through the extra-cellular matrix (ECM), enter the blood stream, adhere at a new location, and successfully implant and begin dividing again. Cells often use devices to get past the obstacles they face. For example, matrix metalloproteases (MMPs) to chew through surrounding matrix. Most importantly for this work, there are factors that can make a cell more motile. Thus, the goal here is to identify and quantify the activity of these factors and their impact on cancer cell motility. For example, the Menainv isoform of a protein Mena involved in cell motility is more effective at driving cancer metastasis (Philippar, 2008). Once again, it is important to remember that metastasis is a complicated process, and choosing the right places to start modeling it can begin to yield insights about the nature of vital parts of this process.
a
btw
e~ ECM e FRopodium 9OWWCoica -a\ctinat *0 RufiFigure 1 (a) The process of cancer cells entering and exiting the bloodstream (Lee, 2007). (b) Cellular mechanical components (Taylor, 2011).
Creating a model of the key parts of this process can make it possible to perform rapid tests of different pharmaceutical linkages and pathways. This would allow the user to be able to assess how changes would affect cell motility on a large scale. The set of models developed throughout the course of this thesis are developed in a modular fashion with various interlinks between key components. It is simple to remove or add to existing sets of equations and system components by choosing which modules are being assessed and creating connections to new species. As new pathways are discovered or existing pathways modified, the modular nature makes it simple for the user to easily change the model. This process of trying to characterize the signaling networks and molecular pathways involved in cellular signaling and the mechanical machinery of the cell allows the user to try to quickly check the effects of changing various parameters and signaling molecule concentrations, key factors in testing new pharmaceuticals. Namely, this model of interconnected signaling pathways and cellular processes can provide a quick in silico analysis of how changes in various protein concentrations or feedback strengths between system players can
affect overall function. The long term goal of this modeling effort is to provide a tool to test out various drugs or effectors on a comprehensive three-dimensional model of a cell.
Chapter 2: Background
There are many biological processes involved in cancer cell metastasis. Delving into the details underlying these biomechanical processes can help to frame the work presented here and put it into the appropriate biomechanical context. Figure 1 B shows a cell and some of its key mechanical components. A cell's shape is defined and modulated by its actin cytoskeleton. Actin in combination with myosin serve as the most important components of cellular mechanical machinery; these proteins work together to make a cell expand, contract, and move. As the cell reacts to external stimuli in its environment, all the components of the mechanical machinery act in concert to extend protrusions or contract in order retract a particular portion of the cell. Myosin proteins, also labeled in Figure lB, form a superfamily of motor proteins that move along actin
filaments and hydrolyze adenosine triphosphate (ATP), helping the cell contract.
Actin is the most abundant protein in many eukaryotic cells; even in non-muscle cells, actin composes 1-5% of cellular protein (Lodish, 2000). A human cell is composed of a cytosolic portion within its plasma membrane, containing a nucleus, other organelles, and a mechanical structure with components such as actin and myosin, which help give the cell structure and allow it to move. This is obviously a very complicated and multi-faceted system. Focusing on specific intracellular signaling molecules and how they impact the cell's mechanical machinery (primarily, actin and myosin) can provide a valuable path to effectively modeling such a complex system.
When the cell moves along a flat surface, as shown in Figure 2 below, it extends protrusions, such as filopodia or lamellipodia. By extending protrusions, grabbing onto the extracellular matrix, the area that surrounds the cell, and contracting at the trailing edge, cells can move around their environments. This process of cellular motility is at the center stage in cancer metastasis, because cancer cells must leave their primary tumor site and move to a new location. There are three main stages that coordinate cellular movement on a substrate.
This three-step process is shown graphically in Figure 2 below. First, the leading edge of the cell extends forward in the direction of movement. Then, the part of the cell that extend attaches itself to the substrate with focal adhesion kinases. Finally, the back of the cell retracts into the cell body using myosin-mediated contraction. This three-step extension, attachment, and retraction process is responsible for a cell's movement over a substrate. The cell moves by attaching itself to a substrate and "pulling" itself along in the direction of persistence. In a three-dimensional environment, however, the mechanics and pathways can get more complicated.
t
xtenslon of 1 ... d1ng edget
Attadimml to St1bstratumt
Re1racdo11 ol llalllng odgeFigure 2. The three stages of cell crawling across a surface. (Cooper, 2000)
Figure 3. 3D Imaging of invadopodia (Albiges-Rizo, 2009).
The metastasizing tumor cell is subjected to a three-dimensional environment, with a different set of mechanical restrictions. In Figure 2, the cell is shown moving across a flat substrate using a simple three-step process. A cell trying to leave a tumor must often extend protrusions in all three directions. It experiences a different set of mechanical factors in its environment than it would while moving along a simple flat substrate.
Figure 3 shows an image of a cell protrusion in 3D. This particular protrusion is known as an invadopodia. Notice the intricate shapes of cellular protrusion shown in Figure 3; these extensions are not simply definable or predictable mathematically. Characterizing cellular movement in three-dimensions requires the development of a new toolbox. This work serves as a step toward attaining that goal, by synthesizing a set of models to represent key cellular pathways in I D and extending them in a simplified manner to 3D.
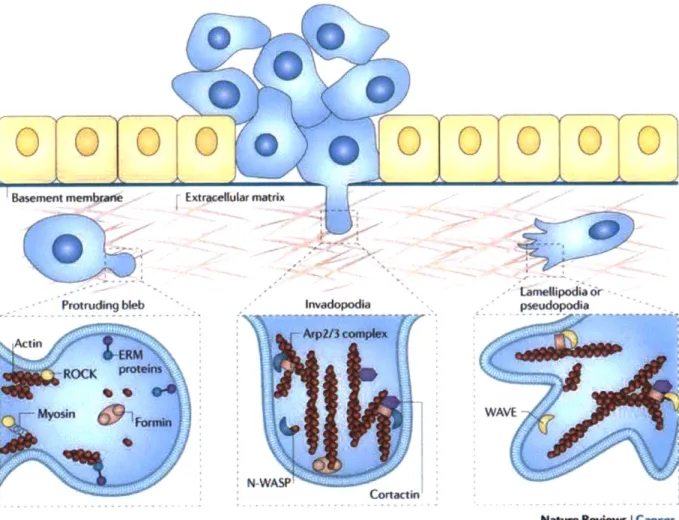
Figure 4 shows a series of cellular protrusions in 3D that a cancer cell can use as it becomes more motile and begins to invade the surrounding area. As cancer cells invade the basement membrane, they are subjected to a variety of mechanical constraints that limit their motion. In response, cells extend protrusions that come in many unique sizes and shapes.
Basement membrane ExtrwAe utar matrix
tamellipodia Or
Protruding bleb Invadopodia pudopodi
ROCK
Myosin C11WAVE
N-WP
Cortactin
Natwe Reviem Icancer Figure 4. Methods of cellular invasion in cancer metastasis and the key components involved
The precise set of reasons behind cancer metastasis are unknown, but there are many reasonable hypotheses. It is known that cancerous tumors often exist in a hypoxic microenvironment, or an environment where there is a lack of oxygen. "Prolonged hypoxia increases genomic instability, genomic heterogeneity, and may act as a selective pressure for tumor cell variants.. .alter non-specific stress responses, anaerobic metabolism, angiogenesis, tissue remodeling, and cell-cell contacts" (Subarsky, 2003). Essentially, tumors provide cells with poor living environments and mounting evidence suggests that this could potentially motivate the tumor cells to leave in search of a better environment. A poor or hypoxic environment, along with external signaling factors, can
cause cells to begin the process of metastasis.
Cancer cells can undergo a process called epithelial-mesenchymal transition (EMT) that can initiate metastasis. In EMT, a polarized epithelial cell undergoes biochemical changes that allow it to exhibit a mesenchymal phenotype where it loses its polarity and adhesion to neighboring cells. These phenotypic changes lead to enhanced invasiveness, migratory capacity, and resistance to apoptosis, among other things (Kalluri, 2009). Figure 5 shows the process of epithelial-mesenchymal transition, and lists important markers used at each step.
E-sh" Oyp Intmendakt ph- MOsnc phenom"
a ells vuaonS N
j ~ T S
Figure 5. Epithelial to mesenchymal transition (Kalluri, 2009).
After cancer cells leave the primary tumor location, they can enter the bloodstream in a process called intravasation, and re-enter tissue in extravasation. Figure 6 depicts these two processes. A variety of different mechanical processes are highly relevant to intravasation and extravasation. The cell must first squeeze through a very tight junction in the endothelial wall of the bloodstream. Then, it must survive the shear stress of the flow through the blood stream. Finally, the cell must
leave the bloodstream to adhere to tissue and squeeze back out of the bloodstream (Reymond, 2013). While in the bloodstream, the cells are subjected to shear-stresses from blood flow. In addition, their size can be a limiting factor. Organelles within the cell also play a role in intravasation and extravasation. For example, the nucleus must often bend and deform in order to squeeze through the tight space available in order to enter the bloodstream. The nuclear size can
be a bottleneck, or limiting factor, as the nucleus is stiffer than other parts of the cytoplasm. In fact, the nucleus can be 3-10 times stiffer than the surrounding cytoplasm (Lammerding, 2007), acting as a further barrier to metastasis.
throughSi
______________________C___ ionod~y!
Figure 6. Intravasation and extravasation (Reymond, 2013)
2.1 Small GTPases
The identification of Rho GTPase proteins began in 1985 (Ridley, 2012). Small GTPases are a family of hydrolase enzymes that can hydrolyze guanine triphosphate. Note that the acronym GTP in "GTPase" stands for guanine triphosphate. The Rho GTPases are a family of signaling proteins. They are small, approximately 21-30 kD (Yang, 2002), and are subfamily of the Ras superfamily. The G proteins are molecular switches and cycle between an active and inactive state. There are twenty Rho GTPases described for mammalian cells (Heasman, 2008). Guanine nucleotide exchange factors catalyze the GTPase activation process. When active, GTPases interact with target effector proteins to mediate signaling network processes. GTPases are found in all eukaryotic organisms. The GTPases impact filopodia, actin stress fibers, and lamellipodia. Certain linkages and combinations of the GTPases are key in 3D protrusions, and others are on flat surface protrusions.
Plasma membrane
GTP GDP
Effectors
Figure 7. Small GTPase activation-inactivation process, mediated by GEFs (Etienne-Manneville, 2002).
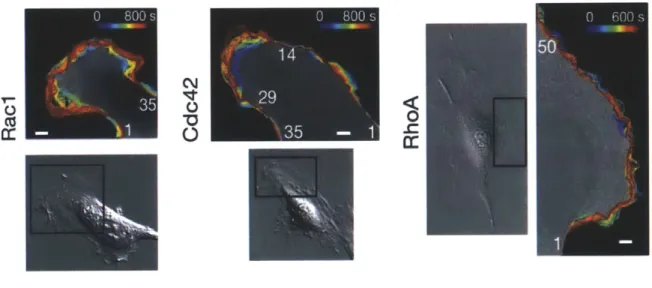
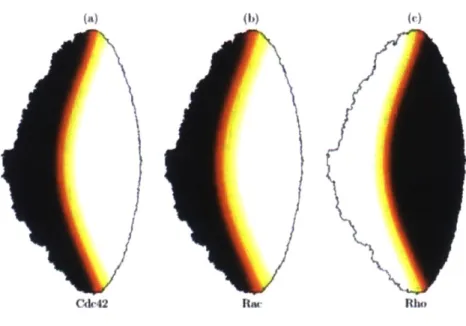
Guanine nucleotide exchange factors (GEFs) and GTPase activating proteins (GAPs) allow GTPases to switch between the active and inactive state. GEFs catalyze the GDP to GTP exchange to activate Rho proteins. On the other hand, GAPs allow the hydrolysis of GTP to GDP (Etienne-Manneville, 2002). This process is depicted in Figure 7 above. This sort of active to inactive state switching plays an important and interesting role in the downstream signaling network for EGFR and the activation of the cellular mechanical machinery, and a key role in the work presented here. Characterizing the relationship between the GTPases and the downstream network species is key to understanding and quantifying cellular motility. For example, a downstream effector of RhoA is Rock], which helps cells contract. All three of the GTPases studied here are shown to be activated at the leading edge of the cell (Machacek, 2009); see Figure 8 below. This presents a complicated spatiotemporal relationship for which the exact dynamics is not completely understood. A simplified representation with cell polarization (Rac and Cdc42 on one side, Rho on the other) provides a more approachable and easier route to modeling basic behavior, shown in Figure 9. Despite these useful simplifications, biosensor studies show that in the cell protrusion process, all three GTPases are activated at the front of migrating cells (Machacek, 2009). The results in 3D given below in this work show that Rho GTPase exists at both the leading and trailing edge of the cell, while Rac GTPase is polarized toward at the leading edge, which is consistent with this notion. The complicated dynamic spatiotemporal relationships between these species, along with the dozens of other important species in metastasis, is very difficult to capture in a model.
a0
Fzs
C&-42 RaR
Figure 9. Spatial organization of Rac, Rho, and CDC42 in a cell to improve modeling efforts (Maree, 2006).
2.2 Epidermal Growth Factor Receptor (EGFR)
EGFR is a transmembrane receptor to which ten different ligands can bind selectively. Once bound, the receptor forms a dimer that activates autophosphorylation through tyrosine kinase activity. This process can trigger a series of pathways resulting in cancer-cell proliferation and the activation of invasive or metastatic behavior (Ciardiello, 2008). There are two kinds of EGFR antagonists that have been successfully tested in phase 3 clinical trials and are currently in use: anti-EGFR monoclonal antibodies and small-molecule EGFR tyrosine kinase inhibitors (Ciardiello, 2008).
Anti-EGFR monoclonal antibodies bind to the extracellular EGFR domain and block ligand-induced EGFR tyrosine kinase activation. The second, EGFR tyrosine kinase inhibitors (e.g. gefitinib or erlotinib), compete with ATP to bind to the intracellular catalytic domain and inhibit the autophosphorylation and downstream signaling. This method is effective because the EGF signaling pathway leads to important key biological effects such as invasion, metastasis, and cell proliferation. There exist on the order of 50,000 to 100,000 EGFR receptors per cell. However, in cancerous cells, sometimes EGF receptors can be overexpressed, up to 1.7 to 1.9 times (Zimmerman, 2006).
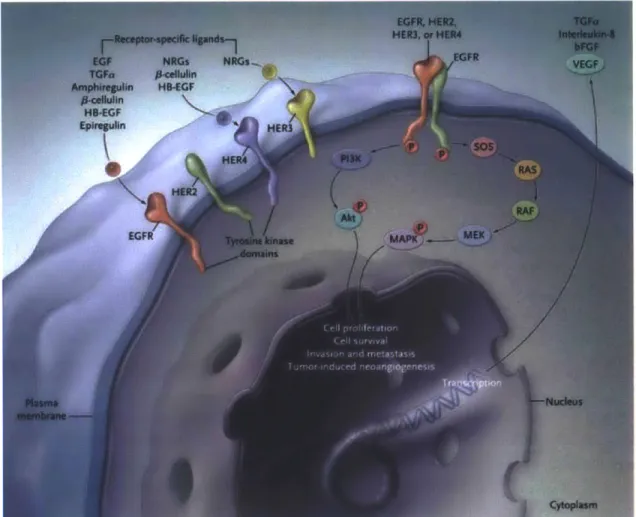
Epidermal growth factor is important for cell proliferation and differentiation. When it binds to the cell surface receptor, it induces dimerization that activates the tyrosine kinase activity that initiates a signal transduction cascade. Tyrosine kinase is a cellular enzyme useful to turn biological functions on or off, by transferring a phosphate group from adenosine triphosphate to a cell protein.
If protein kinases mutate to stay functionally "on," that can cause cell growth without proper regulation, a key aspect of cancer. Figure 10 below shows different sets of transmembrane receptors that are embedded inside the cellular plasma membrane. The EGFR receptor is shown in
relationship to the pathway that connects to cell proliferation, cell survival, invasion and metastasis, and tumor-induced neoangiogenesis. Most importantly for the work here, EGFR is strongly connected to the metastasis pathway in cells.
2.3 Actin Network
The cellular cytoskeleton is composed of actin filaments which link together to form an actin network. Actin filaments can be capped or uncapped, allowing further polymerization. Actin and myosin form the basic mechanical machinery that causes changes in cell shape and motility. Using this mechanical machinery, the cell can examine its surroundings by pushing on the extracellular matrix and restructuring itself to move around. As discussed above, motility is essential to cancer metastasis.
When cancer progression or metastasis is initiated, the cell must leave its original tumor site, make it through the tissue to the bloodstream, and get carried around the body until it implants at a secondary tumor site. By studying the signal process that leads to the activation of a cell's mechanical machinery, and coupling that with a description of how the mechanical machinery works, it is possible to develop an understanding of how a cancer cell can biophysically metastasize.
Globular actin, or G-actin, can polymerize to form F-actin filaments. The addition of ions like magnesium, sodium, and potassium induces this polarization (Lodish, 2000). The F-actin filaments can then bundle together to form larger structures that help provide structure in the cytoskeleton, shown in Figure 1 Ia below. Figure II b shows the actin cytoskeleton and individual families of branching actin filaments. As the actin filaments branch and extend, they give rise to forces within the cytoplasm that can push the cell membrane outward to create cell movement. This branching process is mediated by a protein Arp2/3, which is a fundamental key player in the mathematical models presented in this work. Arp2/3 stimulates the formation of actin assembly and branching, which is important for cell protrusion and metastasis. The function of this protein is shown in Figure 12.
a
b
WCA domain from NPF
F-actin binding
Figure 12. Arp2/3 creating actin branching (Numberg, 2011)
a
b
8-o50 500 E Efx - q(Pa)z
Emin 0.1 1Figure 13. (a) Normalized elastic modulus for actin (Chaudhuri, 2007). (b) Structures composed of actin filaments (Lodish, 2000).
F-actin binding I
I
EI~
[
C
-MO-The actin filaments join together to form actin bundles by using a fascin cross-linker (see Figure 13b); the scale of space between cross linkers is approximately 36 nanometers (Lodish, 2000). There are several ways to model actin filaments in a cell, in order to mathematically characterize the actin cytoskeleton.
Networks composed of actin exhibit interesting mechanical properties that provide insight into the mechanical structure of a cell. Actin networks exhibit stress stiffening and softening. There are three regimes of elasticity, as shown in Figure 13a. The first regime is the linear regime, followed by stress stiffening and then softening. In fact, the stress softening of an actin network is reversible. Both the reversible elastic behavior and the large elastic modulus suggest that actin network architecture is good for high compressive loads. These measurements apply to lamellipodia (Chaudhuri, 2007).
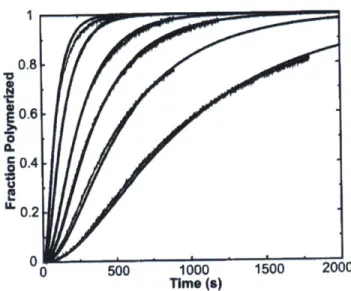
The thermodynamics and kinetics of actin nucleation are fundamental to the entire cytoskeletal process. Analyzing these factors can predict the behavior for actin monomers over a range of concentrations. Characterizing the nucleation-elongation process for actin can yield interesting
insights (Sept, 2001). Modeling protein-protein interactions using Brownian dynamics simulations is an effective way to approach this process. The equation that forms the basis of Brownian Dynamics simulations is given:
DAt
R (t + At) = R (t) + kTF + S 1
kT
Here, R gives the protein position, D is the diffusion constant, At is a time step, k is Boltzmann's constant, and T is the temperature. S is a stochastic term to describe Brownian motion from solvent interactions (Sept, 2001). "The Brownian dynamics simulations assume that the formation of each protein- protein complex is controlled by diffusion and electrostatic interactions. We know this to be the case for barbed-end actin polymerization, but here this assumption also applies to the nucleation phase" (Sept, 2001).
Structure DT (A/ps) DR (rad2/ps)
Monomer 0.0103 1.23 X 10~
Dimer (a) 0.00798 5.91 X 10⁻⁶
Dimer (b) 0.00805 4.69 X 10⁻⁶
Trimer (c) or (1) 0.00707 3.54 X 10⁻⁶
Tetramer (i) 0.00638 2.41 X 10⁻⁶
Table 1. Translational and rotational diffusion coefficient for ellipsoid structures used in monomer polymerization model (Sept, 2001).
1 0.81 j0.6 0. 0.4 LL 0 0 500 1000 Time (s) 1500 2000
Figure 14. Fit to actin polymerized using model described above (Sept, 2001).
2.4 Contractile Machinery and Integrins
The contractile machinery of a cell is extremely important to its ability to move. As a cell moves, the trailing end has to contract in order to pull it back towards the center of motion. The key players in contractility are ROCK, Rho, and Myosin.
yo~n~ir-v
( apAW®V
-4 0
*4-066
Figure 15. Myosin proteins walk along the actin fibers. (Berg, 2002)
ROCK serves many functional purposes with in the cell. Not only is it important for cell contraction, but is also very important for the assembly of the actin network, focal adhesions, and intermediate filament mechanics. Rho is extremely important for cellular function. For this work, the focus is on its function in mediating cellular contractility. Myosin serves as a molecular motor that moves along the actin filaments in a cell, hydrolyzing ATP. The proteins within the myosin family are key for muscle contraction and cellular motility. Using an exchange of ADP to ATP, they move along the actin filament in order to create contractile forces within the cell. This process is shown in Figure 15; it is important both for cellular movement along a flat substrate, and also for cellular movement in a 3D environment, such as in cancer metastasis.
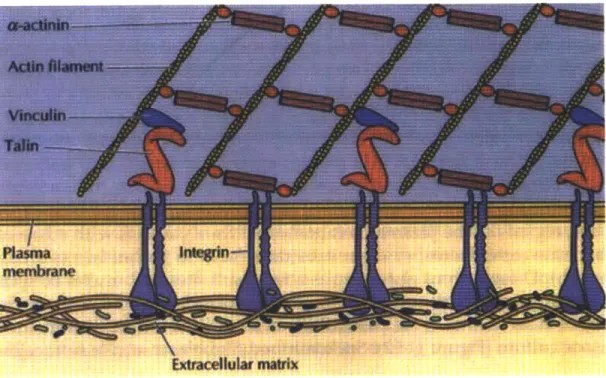
Cells use focal adhesions in order to attach themselves to the substrate they are moving through or placed on. As a cell moves, there is a "tug of war" between the focal adhesions at each end of the cell, with the side that has the stronger pull moving the cell forward. Figure 16 displays how actin filaments attach to vinculin and talin, which connect to integrins that are attached inside the extracellular matrix.
Figure 16. Integrins embedded in the plasma membrane, linking intracellular proteins with the extracellular matrix. (Cooper, The Cell. 2001)
Chapter 3: Mathematical Model and Methods
3.1 Mathematical and Biochemical Background
There are multiple types of reaction mechanisms that occur within the cell. Describing the kinetics to model these reactions is important to developing a model of metastasis and the signaling networks it employs.
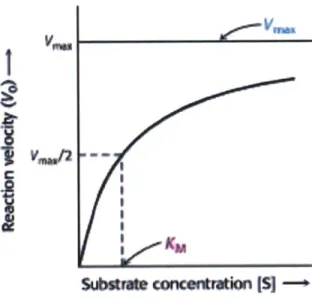
Michaelis-Menten kinetics are often used to describe enzyme reaction kinetics. Assuming the following reaction:
E + S ES -> E + P (2)
Then the reaction kinetics can be described as:
d[P] Vmax[S]
dt Km+[S]
The rate of the reaction increases with the concentration of the substrate, eventually plateauing at
Vmax, as shown in the plot below in Figure 17:
Subetrte
concentration IS]
-+
Figure 17. Michaelis-Menten kinetics; reaction rate plotted against substrate concentration (Berg, 2002).
Another important type of reaction kinetics is the Hill function, which describes the binding of a ligand, accounting for the presence of other ligands. The Hill equation is given as:
[L]"
= K + [L]n (4)
This describes the fraction of bound ligand sites over total ligand sites as a function of the unbound ligand concentration and the dissociation constant, K.
A key element here is n, which is the Hill coefficient. If n>1, the interaction is characterized as positively cooperative binding, where a bound ligand increases the affinity for other molecules. For n<l, this is negatively cooperative binding, where binding decreases affinity. In the n=1 or non-cooperative case, the enzyme affinity to ligand is independent of whether the others are bound. Reaction rates can be of zero-order. This means that the reaction rate is independent of the reactant
concentrations. There is a simple rate law to describe this sort of reaction:
d[A] = k (5)
dt
A first-order reaction's rate depends on the concentration of one reactant, and is zero-order for the other reactants involved.
d[A](6
= k[A] (6)
dt
Progressively increasing to the nth-order reaction, the equation becomes:
d[A] = k[A] (7)
Using combinations of these reaction kinetics, it is possible to produce sets of equations called reaction-diffusion equations that then describe the mechanistic interactions in a physical system. Diffusion is a key element of this process, shown graphically in Figure 18. Molecules can diffuse through a cell and spread through the cytoplasm. Diffusion is a slower process than active transport of molecules. For example, molecules must be actively transported to the end of long neurons because a diffusive process would be too slow for them to reach the end in time to conduct cellular processes. Nevertheless, for the case of metastasis, cellular diffusion of molecules like Rac, Cdc42, and Rho are important to model. Diffusion is the process by which particles will move from a region of high concentration to that of low concentration. Brownian motion and random fluctuations cause the particles to engage in a random walk due to thermal energy. An expression for the diffusion constant is given below:
RT
Here, R is the ideal gas constant, T is the temperature, il Is the viscosity, r is the particle radius, and N is Avogadro's number.
. *
Figure 18. Diffusion process depicted graphically; particles diffuse through random walks.
Differential equations can be used to describe a system mathematically. The structure of a differential equation provides linkages between different variables and their derivatives. In the case of this work, the time derivatives of a set of state variables are related to the first and second spatial derivatives along with other source terms.
Partial differential equations are a class of differential equations that have multiple independent variables. For example, a differential equation in space and time would be a partial differential equation due to the independent variables to describe space and time, which could be x,y,z,t in rectangular coordinates. Analyzing cellular behavior thoroughly requires a 3D description because metastasizing cells in a cancer have important behavior in all three spatial dimensions and time. While a flattened ID and time perspective can lend enormous insight into what is happening, progress toward a 3D description is extremely important for developing a complete description of cancer metastasis and signaling networks. However, partial differential equations in three dimensions and time, a total of four independent variables, are complex and difficult to interpret. For example, examine a reaction-diffusion equation for a ID and time case (Eqn. 9), and contrast it with a 3D and time case (Eqns. 10- 11).
aA a2A = DV2 A + S (10) A /a2A a2A 2A (1 -D -+-++ +S at (x 2 ay2
az
2The 1 D case provides the solution on a line of space as shown below, where the 3D case provides the solution on a generalized 3D shape (Figure 19b). As shown in figure 19a, in the ID and time case, there is a solution for each dependent variable that varies with space for a single time snapshot. In the case of this work, this would be the concentration of a particular species. In the 3D case, the solution is given at every point, with a profile for each of the three spatial dimensions at every time slice. Figure 19b below shows a particular time slice and a family of plots, while Figure 19a shows the ID case.
a
3.2 Modules and Descriptions
Timescales are important for cellular function, because the order of various molecular events determines what kind of action will occur on a cellular and organism level. For example, cellular protrusions are governed by a set of molecular events that occur in a particular order, with various events occurring at different times. One molecule's concentration might peak at a certain time, which causes a cascade of a different molecule, and then the pathways engages the mechanical machinery of the cell in a particular location where the peak occurred.
Trying to map out these timescales hinges on the values of constants within the model. There are many unknown constants, but this can be accounted for using a parameter variation or sensitivity analysis. The results for some of these sensitivity analyses are shown below in Chapter 4. The constant parameters within the model (of which there have been hundreds) are variable depending on the particular cell and experiment being performed. Many of the parameters are available in literature, and those which were not available were estimated using parameter variation analysis. Sample parameters are given in Figure 20. Selected parameter variation plots are given in Chapter
4.
kp,,K PIP, to PIP2 baseline conversion rate (by P15K). 0.84 s'
k2, PIP2 to PIP, conversion rate. 1.4
s-kP13K PIP2 to PIP3 baseline conversion rate (by P13K). 0.0072 s~
kpTEN PIP3 to PIP2 baseline conversion rate (by PTEN). 4.3
s-D, PI diffusion rate. 0.5-5 im2 S I
Figure 20. Sample constant values from literature (Dawes, 2007).
Different versions of the models developed have different equations and mechanisms to represent different processes. Some are more or less accurate, or developed for different biological purposes. Note that the set of equations presented here does in no way represent a full description of all models developed; that would be too large to include here. This is a collection of some of the most important biochemical pathways and suggested mechanisms. The annotations for each presented equation are given in tables below, with the term numbering corresponding to the terms listed in the right side of the equation. Every equation is presented in differential form with the time derivative given as a function of the spatial derivatives and species state. Note that the key goal in this work is to develop an effective means for relational analysis; the units of various terms are less important than the relational trends and feedback mechanisms, which are the focus here.
Module I: Small GTPases
Small GTPases are an important part of the cellular networks involved in intracellular signaling and motility. They play a key role in cell polarization, with concentration gradients and localization they create being vital for the reorganization of the actin cytoskeleton. The equations for the small GTPase module are adapted from (Holmes, 2012). This first equation is provided for active Rac, a GTPase. The equation explanations are given as an approximate example of possible mechanisms at work in the complex network of interactions.
aRac
at
(12)
a2 Rac Rac,
-x 2 + [PP3-RacP1 3 + PCd42-RacCdC4 2
) + aRac + S] RaCT ~ Rac-RacRac
Term Explanation
1 Rac is assumed to diffuse through the cytosol
2 The reaction between PIP3 and Rac is assumed to be first order and proportional to the
concentration of PIP3 but also the ratio of Inactive Rac to Active Rac
3 A first order reaction between Cdc42 and Rac, tempered by the ratio of Inactive Rac to
Active Rac
4 Constant Term
5 Gradient: Not used in EGF stimulation based model
6 Degradation of Rac
Table 2. Description of terms for active Rac.
The following equation describes the inactive Rac species, which is described by cycling between the two states.
(13)
dRac1a a2Rac
1a Rac1a
=Da2 n [P3-RacP1P3 + PCdc42-RacCdC4 2) + l R] + IRac-RacRac
t
x2 RaCTotTerm Explanation
1 Inactive Rae is assumed to diffuse through the cytosol
2 The reaction between PIP3 and Rac is assumed to be first order and proportional to the concentration of PIP3 but also the ratio of Inactive Rae to Active Rac. The effect is
opposite for Active Rac.
3 A first order reaction between Cdc42 and Rac, tempered by the ratio of Inactive Rac to
Active Rac. Effect opposite for Active Rac
4 Constant Term
5 Degradation of Rac yields an increase in inactive Rac Table 3. Description of terms for inactive Rac.
This equation describes the active Rho GTPase species.
aRho a2Rho IRho Rholn
-t = D + + racn Rho IoRho-RhoRho
at
(14)Term Explanation
1 Rho is assumed to diffuse through the cytosol
2 Unidirectional signaling from Rac to Rho. Rae is assumed to antagonize and inhibit Rho.
3 Degradation of Rho
Table 4. Description of terms for active Rho.
ORho a2Rho I Rho Rho 1n
= Rhoot + PRho-RhoRho (15)
at
- +x a ________a22)
Term Explanation
1 Inactive Rho is assumed to diffuse through the cytosol
2 Unidirectional signaling from Rac to Rho. Rac is assumed to antagonize and inhibit Rho. The effect is the opposite as for Rho (Active).
3 Degradation of Rho yields an increase in Inactive Rho Table 5. Description of terms for inactive Rho.
Cdc42 a2cdc42
[
MCc42 Cdc421nt = D + rho aCdc42Tt Iac 4 2-cdc4 2Cdc4
2 (16)
at(+
a)Term Explanation
1 Cdc42 diffuses through the cytosol 2 Inhibition of Cdc42 by Rho
3 Degradation/conversion to inactive Cdc42 Table 6. Description of terms for active Cdc42.
aCdc42n a2Cdc42 = D -at aX2
rCdC42
]
Cdc42T 1 +scdc
4 2-cdc 4 2Cdc4 2 (17)(1
+ Cdc42T t Term Explanation 1 Diffusion2 Opposite effect than Cdc42
3 Conversion from Cdc42
Table 7. Description of terms for inactive Cdc42.
Module II: Phosphoinositides & PLC Pathway
There are two key overarching pathways that lead to protrusion within a cell; here they are denoted as the cofilin pathway and the arp2/3 pathway. Both are responsible for the development at barbed ends, and different upstream factors are responsible for each, while there is some overlap. The phosphoinositide and PLC pathway module consists of a wide variety of system players that are involved in the cofilin pathway and the Arp2/3 pathway of protrusion.
The following equations provided in Module II were adapted, integrated, and expanded from the following sources: (Holmes, 2012), (Haugh, 1999), and alternative selections from (Tania, 2011). The role of species like the phosphoinositides in cell motility is complicated and multi-faceted. A variety of base models needs to be integrated together in order to fit in its different pathways throughout the cell. The equation for species PIPi (Phosphatidylinositol 4-phosphate) is given here. This species interacts with other phosphoinositides and this interaction is Rac-mediated.
(18)
2PIP,
a2PIP1 + Rac
t D y + pip1
-
Ppip'-pip, 1 + a kp15K PIP1 + @PP 2-P 1 PIP2Term Explanation
1 Diffusion through cytosol
2 Constant Term
3 Degradation term
4 Conversion to PIP2 dependent on Rac
5 Conversion from PIP2
A potential overarching equation to describe PIP2 (Phosphatidylinositol (4,5)-biphosphate) is given
here as:
(19)
aPIP2 D a2pIp2 Rac -) Rac
= D
a
2 - IP2- PIP2 + 1 + R)k PIP - + kpI3K PIP2at 8xRaCTot RaCTot
Rho 1
RhoTotkPEPI 3 +kP-(k +kL+kE)PP+ I2
The term: -(k_ 1 + kPLC + kCE)PP2 (Haugh, 1999) can also be described in the form used in
(Tania, 2011):
-dhyd
(PLC
- PLCrest PIP2PLCrest
Both adaptions might serve to describe the same physical phenomena, the PIP2 -PLC connection. Term Explanation
1 Diffusion
2 Degradation of PIP2
3 Conversion from PIPi, influenced by Rac, proportional to PIPi concentration 4 Conversion to PIP3, influenced by Rac, proportional to PIP2 concentration 5 Conversion from PIP3, influenced by Rho and proportional to PIP3 concentration
6 Conversion from PI to PIP2, away from PIP2 to PI to describe the PLC gamma PIP2 cycle 7 Term to include constant in kinetics
Table 9. Description of terms for Phosphatidylinositol (4,5)-biphosphate. PIP3 (Phosphatidylinositol (3,4,5)-triphosphate)
(20)
dPIP3 a2PIP2 / Rac '~( Rho
= D 2 + 1 + f(EGF, kPI3K)PIP2 - 1 + kPTENPIP3
at
ax2 RacTot RhoTot)Term Explanation
1 Diffusion
2 Conversion from PIP2, proportional to Rac
3 This term, using the function of EGF and Pl3Kinase, brings in the EGF interaction to amplify this pathway. In some versions of this model, the EGF interaction is simulated
mathematically with a Hill function.
4 Conversion to PIP2, proportional to Rho
This is the equation for Phosphatidylinositol (PI), a species involved in the phospholipase-C pathway (Haugh, 1999).
OPI
= rp*I, + k_1PIP2 - k*PI
at SrPP(k-1 + k +E) P1(O) = k(kgL+
k)
kkPLC E) (21) Term Explanation 1 Constant Term2 Conversion from PIP2
3 Degradation of PI
4 Initial Condition
Table 11. Description of terms for Phosphatidylinositol. (Asterisks indicate dependence on
receptor activity; zero superscripts indicate absence of receptor activity values) (Haugh, 1999)
Inositol Phosphate (IP) (Haugh, 1999) IP
t= k*PC 2 + PITP/PLC
(22)
Term Explanation
1 Conversion from PIP2 to IP
2 Constant Term
Table 12. Description of terms for Inositol Phosphate.
k+ = k(1 - Di + X+*)
Gi + Ki + fa* - (Fai + Ki + fa*)2 - 4aifa*
PLC-yI is an important system player which mediates cell motility. It plays a large role in
mediating the EGFR pathway linking it to the downstream factors that lead to cell movement and potentially metastasis.
dPLC
dt = Stimulus + 'pIc - dpicPLC
Stimulus = ISO(H(t - ton) - H(t - toff))
(23)
Term Explanation
1 Mimics EGF stimulation 2 Constant Term
3 Degradation of PLC
Table 13. Description of terms for PLC-yl.
This form is presented in Tania et al. 2011. It uses a stimulus function in PLC to represent EGF stimulation, which is extremely important.
It can be possible to alternatively represent this pathway as a function of an EGF species.
PLC-yl (Alternative-EGF Dependent, not Stimulus Dependent), and PLC as a Hill function
dependent on EGF.
dPLC
dt= EGF-PLCEGF + 'pic - dpicPLC (24) dt
PLC = f(EGF stimulus gradient, n, K)
Term Explanation
1 Linkage between EGF stimulation and PLC 2 Constant Term
3 Degradation of PLC
Module III: Contractile Machinery
Equations 26-27 adapted from citation: (Kaneko-Kawano, 2012) Myosin-Phosphatase
dMP kcat(MP)(MPtot - MP) kcat2(ROCK)(MP) + ki(MPt0t - Mp) (25) dt Kml + (MPtot - MP) Km2 + MP
Term Explanation
1 Relating the myosin phosphatase concentration and inactive MP (this form of MP contains a phosphorylated MYPTI) using Michaelis-Menten kinetics
2 Relating ROCK (active form of Rho-kinase) concentrations and MP using Michaelis-Menten kinetics
3 Describes the activation by other pathways Table 15. Description of terms for Myosin-Phosphatase. Phosphorylation of Myosin Light Chain
(26) dpMLC kcat3(ROCK)(MLCtot - pMLC) kcat4(MP)(pMLC)
dt Km3 + (MLCtot - pMLC) Km4 + pMLC
Term Explanation
1 ROCK directly influences the conversion to pMLC (Michaelis-Menten kinetics) 2 MP increases the reaction from pMLC to MLC
3 Describes the activation by other pathways
Table 16. Description of terms for Phosphorylation of Myosin Light Chain. Linking together the above equations with the GTPase Module:
aRock a2 Rock
Sck = D + @Rho-RockRho - kock-RockRock (27)
at
X
Term Explanation 1 Diffusion
2 Feedback from Rho to ROCK 3 Degradation of ROCK
Module IV: Cofilin
Equations 28-32 adapted and integrated from: (Tania, 2011) Cofilin-PIP2
dPC PIP2 PLC - PLCrest
= k C - d 2PC - dhyd PLCrest p
dt pip2 PI2,rest P 2C y PLCrest
(28)
Term Explanation
I Dependence on phosphorylated cofilin 2 Degradation of PC
3 Describes the activation by other pathways
Table 18. Description of terms for Cofilin-PIP2.
Active Cofilin
(29)
= dpcPC + dhyd PLC - PLCrest PC - k'nFCa + koffCf
- kmpCa + kpmCp
dt =dCCPLCre 5
)
mTerm Explanation
1 PIP2 bound cofilin changes to active cofilin
2 Change from PIP2-bound cofilin to active cofilin
3 Degradation tempered by F
4 F-actin bound cofilin to active cofilin
5 Transitioning to phosphorylated cofilin
6 Phosphorylated cofilin changing to active cofilin
Table 19. Description of terms for Active Cofilin.
F-Actin Bound Cofilin
= k' nFCa - koffCf - Fsev(Cf) (30)
Cf "-sev
Fsev(Cf) = ksevCfrest C, f, rest
Term Explanation
1 Active cofilin to f-actin bound cofilin 2 Degradation
3 Severing of actin bound cofilin
G-Actin Bound Cofilin
dCM = Fsev(Cf)
-kmp Cm + kpmCp (31)
Term Explanation
1 Severing of actin bound cofilin 2 Transition to phosphorylated cofilin
3 Phosphorylated cofilin to G-actin bound cofilin
Table 21. Description of terms for G-Actin Bound Cofilin.
Phosphorylated Cofilin
dCP PIP
2
= kmp(Ca+Cm -2kpm p -k pip2 PIP2,rest C (32)
Term Explanation
1 Transition from active cofilin and G-actin bound cofilin 2 Leaving phosphorylated cofilin state
3 Leaving proportional to PIP2 concentration ratio Table 22. Description of terms for Phosphorylated Cofilin.
A simplified model for cofilin is developed in this work, capturing the key PLC linkage and
degradation.
aCof / Rac
t=11 at + Rat-) kpIRactot 3 PIP2 - Pcof-cofCOf (33)
Term Explanation
1 Feedback from PIP2 - Cofilin pooling breakdown
2 Degradation and leaving separated state; lumped parameter description Table 23. Description of terms for simplified cofilin metric.
Module V: Protrusion
Barbed Ends (Tania N. , 2013) dB
d = AFsev(Cf) - kcapB - @Cap-BCap + PArp-BArp2/3 (34)
Term Explanation
I Severing of F-actin bound cofilin 2 Degradation of barbed ends
3 Capping protein inhibits barbed ends
4 Positive feedback from Arp2/3 to the creation of barbed ends* Table 24. Description of terms for Barbed Ends.
The cofilin parameter Cof [t > t1] incorporated at a particular time point into the actin metric
equation is very important. It is known that the first barbed end peak is not dependent on P3Kinase (Mouneimne, 2004) (Rheenen, 2007). Thus, incorporating cofilin into this actin-protrusion metric for all time would be inappropriate for a modeling effort. Rather, it must be incorporated after the first peak, as is done here.
aA a2 A
= D kcapA + kpip2-API 2 PLC + Cof [t > t1] (35)
Term Explanation
I Monomer diffusion
2 Negative feedback from capping to protrusive process and nucleation 3 PLC and PIP2 pathway, direct from EGFR
4 First barbed end peak is independent of P13K Table 25. Description of terms for actin nucleation metric.
The cytoplasmic actin monomer diffusion coefficient is 6 pm2/s (Schaus, 2007).Using the actin-protrusion metric in addition to the Arp2/3 barbed end metric can yield a powerful tool to analyze overall cell protrusion in the form of new barbed ends in the actin species population. Then, the different biological factors underlying the two peaks can be broken down and analyzed in depth. In addition, this sort of model set-up can be used to perform sensitivity analysis of upstream parameters (for example, N-WASP, Wave, and PLC parameters) that are unknown from literature. This final metric, the protrusion or barbed end metric, is useful for analysis and as a simulation tool to yield interesting insights.
*This term connects Arp2/3 to Barbed Ends. The relative timescales of this portion and the rest of this feeding in from the cofilin pathway can represent the two varying time scales observed in experimental barbed end production data. This interplay can be used to meaningfully tune the model to biologically represent the motility timescales.
dCap [Cap1 cCap
Cap
dt = -kCap-Cap -n1+ n cap1 CapTot
a3 )
J
(36)
ICap Cap
1+ Mena n-Cap CaPTot
Term Explanation
I Degradation of capping proteins
2 Feedback from PIP2 to inhibit capping. When PIP2 levels drop, this protein might be
dissociated from the membrane (Citation)
3 Feedback from Mena to inhibit capping Table 26. Description of terms for Capping Protein.
Module VI: The Arp2/3 Pathway
dArp2/3 -BArp-ArpArp2
dt 3 + PWave- Wave + PNW NW
1Arp
Arp2/3(1+
Actin) n-cap] Arp2 /3normalization factoras.
(37)
dArp2/3 BArpArpArp2/3 + fwaveArp2/3Wave +PNW-Arp/23NW - PActin-Arp2/3Actin
dt
The second alternative form is a useful mathematical modeling tool because it is less complex than the proposed form that uses actin inhibition, but can recreate the lowering of Arp2/3 through the use of a linear negative feedback term.
Term Explanation
1 Degradation of Arp2/3
2 Positive feedback from Wave to Arp2/3 3 Positive feedback from N-Wasp to Arp2/3 4 Inhibition of Arp2/3 by actin
dNW
dt= -BNW-NWNW + @Cdc4 2-NWCdC4 2 + PPIP2-NwPI2
dt (38)
Term Explanation
1 Degradation of N-WASP
2 Positive feedback from Cdc42 3 Positive feedback from PIP2
Table 28. Description of terms for N-WASP.
dWave = Bwave-waveWave +
pac-waveRac
(39)
Term Explanation
I
Degradation of WAVE2 Positive feedback from Rac