HAL Id: hal-00303072
https://hal.archives-ouvertes.fr/hal-00303072
Submitted on 24 Aug 2007HAL is a multi-disciplinary open access
archive for the deposit and dissemination of sci-entific research documents, whether they are pub-lished or not. The documents may come from teaching and research institutions in France or abroad, or from public or private research centers.
L’archive ouverte pluridisciplinaire HAL, est destinée au dépôt et à la diffusion de documents scientifiques de niveau recherche, publiés ou non, émanant des établissements d’enseignement et de recherche français ou étrangers, des laboratoires publics ou privés.
Clouds and aerosols in Puerto Rico ? a new evaluation
J. D. Allan, D. Baumgardner, G. B. Raga, O. L. Mayol-Bracero, F.
Morales-García, F. García-García, G. Montero-Martínez, S. Borrmann, Jodi
Schneider, S. Mertes, et al.
To cite this version:
J. D. Allan, D. Baumgardner, G. B. Raga, O. L. Mayol-Bracero, F. Morales-García, et al.. Clouds and aerosols in Puerto Rico ? a new evaluation. Atmospheric Chemistry and Physics Discussions, European Geosciences Union, 2007, 7 (4), pp.12573-12616. �hal-00303072�
ACPD
7, 12573–12616, 2007Clouds and aerosols in Puerto Rico J. D. Allan et al. Title Page Abstract Introduction Conclusions References Tables Figures ◭ ◮ ◭ ◮ Back Close
Full Screen / Esc
Printer-friendly Version Interactive Discussion
EGU Atmos. Chem. Phys. Discuss., 7, 12573–12616, 2007
www.atmos-chem-phys-discuss.net/7/12573/2007/ © Author(s) 2007. This work is licensed
under a Creative Commons License.
Atmospheric Chemistry and Physics Discussions
Clouds and aerosols in Puerto Rico – a
new evaluation
J. D. Allan1,2, D. Baumgardner3, G. B. Raga3, O. L. Mayol-Bracero4,
F. Morales-Garc´ıa4, F. Garc´ıa-Garc´ıa3, G. Montero-Mart´ınez3, S. Borrmann5,6, J. Schneider6, S. Mertes8, S. Walter6, M. Gysel1,∗, U. Dusek7,∗∗, G. P. Frank7,9, and M. Kr ¨amer10
1
School of Earth, Atmospheric & Environmental Science, University of Manchester, Manchester, UK
2
Composition Directorate, National Centre for Atmospheric Science, Leeds, UK
3
Centro de Ciencias de la Atm ´osfera, Universidad Nacional Aut ´onoma de M ´exico, Mexico City, Mexico
4
Institute for Tropical Ecosystem Studies, University of Puerto Rico, San Juan, Puerto Rico
5
Institute for Atmospheric Physics, Johannes Gutenberg University, Mainz, Germany
6
Particle Chemistry Department, Max Planck Institute for Chemistry, Mainz, Germany
7
ACPD
7, 12573–12616, 2007Clouds and aerosols in Puerto Rico J. D. Allan et al. Title Page Abstract Introduction Conclusions References Tables Figures ◭ ◮ ◭ ◮ Back Close
Full Screen / Esc
Printer-friendly Version Interactive Discussion
EGU
8
Leibniz-Institute for Tropospheric Research, Leipzig, Germany
9
Department of Physics, Lund University, Lund, Sweden
10
Institute for Chemistry and Dynamics of the Geosphere 1: Stratosphere, Forschungszentrum J ¨ulich, J ¨ulich, Germany
∗now at: Paul Scherrer Institut, Villigen, Switzerland ∗∗now at: Utrecht University, Utrecht, The Netherlands
Received: 20 August 2007 – Accepted: 21 August 2007 – Published: 24 August 2007 Correspondence to: D. Baumgardner ([email protected])
ACPD
7, 12573–12616, 2007Clouds and aerosols in Puerto Rico J. D. Allan et al. Title Page Abstract Introduction Conclusions References Tables Figures ◭ ◮ ◭ ◮ Back Close
Full Screen / Esc
Printer-friendly Version Interactive Discussion
EGU
Abstract
The influence of aerosols, both natural and anthropogenic, remains a major area of uncertainty when predicting the properties and behaviour of clouds and their influence on climate. In an attempt to better understand warm cloud formation in a tropical marine environment, a period of intensive measurements using some of the latest
de-5
velopments in online instrumentation took place in December 2004 in Puerto Rico. Simultaneous online measurements of aerosol size distributions, composition, hygro-scopicity and optical properties were made near the lighthouse of Cape San Juan in the north-eastern corner of the island and at the top of East Peak mountain (1040 m a.s.l.), the two sites separated by 17 km. Additional measurements of the cloud droplet
10
residual and interstitial aerosol properties were made at the mountain site, accompa-nied by measurements of cloud droplet size distributions, liquid water content and the chemical composition of cloud and rain water samples.
Both aerosol composition and cloud properties were found to be sensitive to wind sector. Air from the east-northeast (ENE) was mostly free of anthropogenic influences,
15
the submircron fraction being mainly composed of non-sea salt sulphate, while that from the east-southeast (ESE) was found to be moderately influenced by populated islands upwind, adding smaller (<100 nm), externally mixed, carbonaceous particles to the aerosol that increased the number concentrations by over a factor of 3. This change in composition was also accompanied with a reduction in the measured
hy-20
groscopicity and fractional cloud activation potential of the aerosol. At the mountain site, the average cloud droplet concentrations increased from 193 to 519 cm−3, median volume diameter decreased from 20 to 14 µm and the liquid water content increased from 0.24 to 0.31 g m−3 when the winds shifted from the ENE to ESE. Larger numbers of interstitial particles were recorded, most notably at sizes greater than 100 nm, which
25
were absent during clean conditions. The average size of the residual particles and concentrations of cloudwater nitrate, sulphate and insoluble material increased during polluted conditions.
ACPD
7, 12573–12616, 2007Clouds and aerosols in Puerto Rico J. D. Allan et al. Title Page Abstract Introduction Conclusions References Tables Figures ◭ ◮ ◭ ◮ Back Close
Full Screen / Esc
Printer-friendly Version Interactive Discussion
EGU Previous studies in Puerto Rico had reported the presence of a significant
non-anthropogenic organic fraction in the aerosols measured and concluded that this was a factor controlling the in situ cloud properties. However, this was not observed in our case. In contrast to the 1.00±0.14 µg m−3 of organic carbon measured in 1992 and 1995, the organic matter measured in the current study of 0.17±0.35 µg m−3 is many
5
times lower, most of which can be attributed to anthropogenic sources. During clean conditions, the submicron aerosol was observed to be almost entirely inorganic, an ob-servation supported by the hygroscopicity measurements. This suggests that organic aerosols from marine sources may not be completely ubiquitous (either spatially or temporally) in this environment and requires further investigation to quantify their true
10
extent and implications, with more extensive, longer-term sampling in conjunction with back trajectory analyses.
1 Background and objectives
Aerosol properties have long been recognized as an important influence on the dynam-ics and properties of clouds (McFiggans et al., 2006; Twomey, 1977). Quantitatively
15
linking aerosol properties to cloud albedo and lifetime is a priority in climate science, as this is needed to address a large area of uncertainty in radiative forcing (Forster et al., 2007). This is especially true for marine clouds in tropical environments, as these have a dramatic influence on the planetary radiation budget due to both the high solar radiation flux and the low albedo of the surface they obscure. Recent advances in our
20
understanding of interactions between aerosols and warm clouds has been driven in part by modern instrumentation that allows aerosol composition analyses to be per-formed online and in a greater detail than before (Canagaratna et al., 2007; McMurry, 2000). The object of the Puerto Rico Aerosol Cloud Interaction Study (PRACS) pre-sented here was to perform detailed in situ measurements of both aerosol and cloud
25
properties in a tropical environment at two sites simultaneously and compare the two in a “quasi Lagrangian” framework, as has been used in studies at other locations (e.g.
ACPD
7, 12573–12616, 2007Clouds and aerosols in Puerto Rico J. D. Allan et al. Title Page Abstract Introduction Conclusions References Tables Figures ◭ ◮ ◭ ◮ Back Close
Full Screen / Esc
Printer-friendly Version Interactive Discussion
EGU Bower et al., 1999).
Puerto Rico is a tropical, Caribbean island whose fair weather climate is dominated by north-easterly trade winds. The island has been the site of a number of studies to measure the properties of aerosols in clean, maritime flow, taking advantage of air that is devoid of major anthropogenic influences. The second feature of Puerto Rico that
5
makes it an attractive site for atmospheric research is the high frequency with which clouds envelop the mountain peaks and provides a region where the interaction of aerosols with clouds can be studied over extended periods of time. The first studies of this type were made in 1992 at the El Yunque mountain site (Novakov and Pen-ner, 1993; Novakov et al., 1994). Sulphate and organic carbon (OC) were analyzed
10
on aerosol samples taken with an eight stage micro-orifice uniform deposit impactor (MOUDI) and compared with measurements of condensation nuclei (CN) and cloud condensation nuclei (CCN). An inversion algorithm was invoked in order to estimate the number concentration as a function of size so that the mass distributions could be used to derive CCN composition. From these studies it was estimated that 37% of
15
CCN were composed of sulphate with the remainder composed of OC. A relationship between CCN and non-sea salt (nss) sulphate was derived for clear and cloudy condi-tions and a good agreement was found between pre-cloud CCN and droplet concentra-tions. The CCN and sulphate were well correlated but the researchers concluded that the droplet concentrations were insensitive to sulphate loadings and more dependent
20
on the sea salt fraction.
In a follow-up study, measurements were made in 1995 at the Cape San Juan light-house located on the northeast corner of the island (Novakov et al., 1997). Analysis of aerosol particles less than 0.6 µm in diameter, captured on quartz filters, showed that a large fraction of the OC was water soluble. In another project concluded in 1998, a
25
chemical analysis of the OC in aerosol particles in regions upwind and to the NE of Puerto Rico showed that black carbon concentrations were low-to-non detectable and that there were no polycyclic aromatic hydrocarbons (PAHs) in the OC (Mayol-Bracero et al., 2001), suggesting that the OC was likely of natural origin. Another study at
ACPD
7, 12573–12616, 2007Clouds and aerosols in Puerto Rico J. D. Allan et al. Title Page Abstract Introduction Conclusions References Tables Figures ◭ ◮ ◭ ◮ Back Close
Full Screen / Esc
Printer-friendly Version Interactive Discussion
EGU the same lighthouse location of Novakov et al. (1997) was conducted in 1999 using a
MOUDI (Kirchstetter et al., 2000), but with a denuder to remove the positive artefacts produced by condensation of organic gases on the filters. The primary result from this experiment was to show that the non-anthropogenic OC is highly volatile and, perhaps even more importantly, that results from filter measurements should be interpreted with
5
caution when sampling organics, otherwise serious artefacts can arise.
Evaluation of filters taken further upwind (Maria et al., 2002) from aircraft near St. Croix revealed that 60–90% of organic matter in the free troposphere was water soluble, with hydrophobic organic compounds accounting for 20–50% of the organic matter in the marine boundary layer. In an evaluation of how aerosols may affect cloud
10
formation over Puerto Rico, Comarazamy et al. (2006) examined the effect of aerosols on precipitation rate using a sun photometer to estimate aerosol loading and a cloud model to predict precipitation at the Arecibo Observatory. They predicted that cloud droplet concentrations are significantly larger and the precipitation diminished when formed in polluted air.
15
Following on from these seminal and farsighted works, a period of intensive mea-surements was conducted in Puerto Rico in December 2004, with the goal of improving further our understanding of warm cloud formation in a tropical marine environment and the role of marine organic aerosols though the use of some of the latest developments in online instrumentation. While the previous studies provided valuable insights into
20
potentially important processes, most of the composition measurements were made using bulk sampling methods that require substantial exposure times to acquire a sam-ple that is adequate for chemical analysis and that are susceptible to artefacts that contaminate the samples. Recent developments in the field of aerosol instrumenta-tion have allowed the quantificainstrumenta-tion of the composiinstrumenta-tion and the hygroscopic properties
25
of atmospheric aerosols online with high size and time resolution. These instruments have been in use for some time in northern mid-latitude environments (Zhang et al., 2007); however, their application to tropical locations has been very limited. Here we present measurements of aerosol properties measured using these instruments
simul-ACPD
7, 12573–12616, 2007Clouds and aerosols in Puerto Rico J. D. Allan et al. Title Page Abstract Introduction Conclusions References Tables Figures ◭ ◮ ◭ ◮ Back Close
Full Screen / Esc
Printer-friendly Version Interactive Discussion
EGU taneously at the Cape San Juan lighthouse and at East Peak, a mountain site in the El
Yunque National Forest, and evaluate their relationships with meteorological conditions and cloud properties, also measured in situ. These sites are subsequently referred to as CSJ and EP, respectively, in this paper.
2 Measurement and analysis methodology
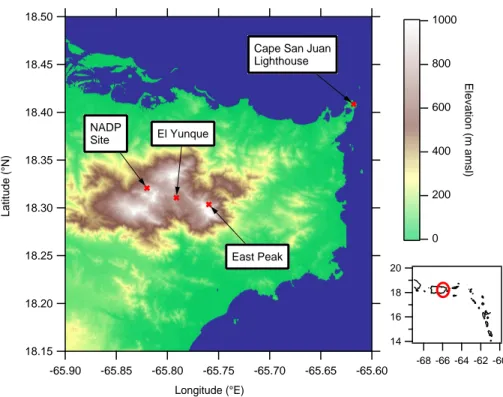
5
Figure 1 shows the locations of the measurement sites, CSJ (18◦22.85′N, 65◦37.07′W) located at the northeast tip of the island and EP (18◦18.21′N, 65◦45.57′W), one of the highest points on the island (1040 m a.m.s.l.) and the farthest to the NE. The line of sight distance to the lighthouse installation was 17 km. This location is close to El Yunque peak where previous measurements have been made of aerosol composition
10
and cloud properties (Novakov and Penner, 1993; Novakov et al., 1994) and is also close to the precipitation sampler (18◦19.35′N, 65◦49.22′W, 380 m a.m.s.l.) that is operated as part of the National Atmospheric Deposition Program (NADP). The EP site experienced a layer of boundary-layer convective cloud on most days during these measurements.
15
The aerosol properties measured at each site were 1) concentrations of CN and CCN, 2) particle number size distributions, 3) light absorption coefficients, 4) particle mass concentrations of sulphate, nitrate, ammonium and organic matter and 5) sub-saturated hygroscopic growth factors (lighthouse site only). The list of instrumentation is summarized in Table 1. All commercial instrumentation was operated under the
20
manufacturer’s normal operating procedures unless stated otherwise. The instruments that were operated at Cape San Juan were connected to a standard NOAA ESRL GMD1aerosol inlet system that consists of a 10 m stack, a heater that maintained the relative humidity below 40% and a flow splitter (Sheridan et al., 2001).
1
Global Monitoring Division, National Oceanic and Atmospheric Administration Earth Sys-tem Research Laboratory, Boulder, CO, USA;http://www.cmdl.noaa.gov/aero/instrumentation/ inlet system.html;http://www.esrl.noaa.gov/gmd/aero/net/csj/index.html
ACPD
7, 12573–12616, 2007Clouds and aerosols in Puerto Rico J. D. Allan et al. Title Page Abstract Introduction Conclusions References Tables Figures ◭ ◮ ◭ ◮ Back Close
Full Screen / Esc
Printer-friendly Version Interactive Discussion
EGU Both of the Aerodyne aerosol mass spectrometer (AMS) systems were of the type
originally introduced by Jayne et al. (2000) and used the data analysis methods de-scribed by Allan et al. (2003, 2004b). This system uses aerodynamic sizing, thermal vaporization, 70 eV electron ionization and quadrupole mass spectrometry to deliver the size-resolved mass concentrations for the non-refractory, submicron component of
5
the aerosol. This means that it is capable of measuring sulphate, particulate organic matter (POM), ammonium and nitrate, but is incapable of detecting elemental carbon, sea salt or mineral dust. In the absence of a reliable external constraint, a collection efficiency of 0.5 was assumed based on validations performed in similar environments (Allan et al., 2004a). The equivalent black carbon (EBC) values are derived from an
10
Aethalometer (Magee Scientific) and Particle Soot Absorption Photometer (PSAP, Ra-diance Research) using specific absorbencies of 19 m2g−1and 10 m2g−1, respectively. These factors are by no means definitive (Bond and Bergstrom, 2006), but uncertainty in this factor will not effect the conclusions of our study given that the EBC is reported here only as a qualitative indicator for the presence of anthropogenic particles.
15
The design of the hygroscopicity tandem differential mobility analyzer (HTDMA) is given by Cubison et al. (2005) and a multi-triangle inversion method was applied (Gy-sel et al., 2006). This is an instrument designed to study the amount of water vapour taken up by dried, monodisperse aerosols exposed to high relative humidity (87% was used during this study), which is related to the mixing states and water activity of the
20
particle constituents. Two of the CCN counters used to measure total concentrations used the parallel plate diffusion chamber technique. The counter deployed at the light-house is an in-light-house design developed at the Max Planck Institute (Frank et al., 2007) and the counter used at East Peak is the University of Wyoming model 101 (Delene et al., 1998; Delene and Deshler, 2000). These are designed to count the number of
25
particles that activate at selected supersaturations, thereby helping to predict the frac-tion of particles that will activate and form cloud droplets under a given cloud scenario. Additionally, size resolved CCN spectra were measured at CSJ using a Droplet Mea-surement Technologies continuous flow CCN counter (Lance et al., 2006; Roberts and
ACPD
7, 12573–12616, 2007Clouds and aerosols in Puerto Rico J. D. Allan et al. Title Page Abstract Introduction Conclusions References Tables Figures ◭ ◮ ◭ ◮ Back Close
Full Screen / Esc
Printer-friendly Version Interactive Discussion
EGU Nenes, 2005; Rose et al., 2007) coupled to a Differential Mobility Analyzer (TSI 3071),
to derived size-resolved CCN spectra as described in Frank et al. (2006). Both CCN counters operated at CSJ were calibrated with respect to supersaturation and counting efficiency using ammonium sulphate particles according to the method described in Frank et al. (2007). The two scanning mobility particle sizers (SMPS) were included to
5
measure the aerosol size distributions.
At the mountain site, cloud and rain water samples were taken for chemical analysis of the ion mass content. The precipitation sampler is the same model used by the NADP network (AirChem Inc.) and the cloud water sampler a Caltech Active Strand Cloud Collector Version 2 (Demoz et al., 1996), provided by Colorado State University.
10
The cloud and water samples were sent to the Illinois State Water Survey Analyti-cal Laboratory for analysis of pH and inorganic ion mass. This institute performs the analysis for all the samples collected by the NADP. The number, volume concentra-tion and size distribuconcentra-tion of insoluble particles in the cloud and rain water samples were analyzed at Forschungszentrum J ¨ulich, Germany, with a Beckmann Multisizer
15
3 Coulter Counter that measures from 0.4 to 1.2 µm. In addition, the ion mass is de-rived from pH and conductivity measurements as described by Kr ¨amer et al. (1996). The cloud droplet size distributions were measured with a Forward Scattering Spec-trometer Probe (FSSP, Droplet Measurement Technologies, Boulder, USA) and the liquid water content (LWC) was measured with a Particle Volume Monitor (PVM,
Ger-20
ber Associates). An automated meteorological station (Davis Instruments) measured temperature, relative humidity, pressure, winds and precipitation.
Part of the instrumentation at East Peak was installed in a trailer located directly at the edge of an overlook facing the lighthouse. Three types of inlets were used to sample the aerosols: 1) total, 2) interstitial and 3) a counter flow virtual impactor
25
(CVI). Air from the “total” inlet was heated to 50◦C to dry the aerosol particles and
evaporate water droplets when in cloud; hence, the particles measured from this inlet include interstitial particles and cloud droplet nuclei, when sampling cloudy air. The interstitial inlet separated water droplets from the air stream with an impactor (upper
ACPD
7, 12573–12616, 2007Clouds and aerosols in Puerto Rico J. D. Allan et al. Title Page Abstract Introduction Conclusions References Tables Figures ◭ ◮ ◭ ◮ Back Close
Full Screen / Esc
Printer-friendly Version Interactive Discussion
EGU cut-size of 4 µm), such that only non-activated particles would be measured when in
cloud. The remaining inlet, a CVI with a lower cut-size diameter of 5 µm (Mertes et al., 2005), removed the interstitial particles, evaporated the water droplets and allowed the residual nuclei to be delivered to the aerosol instrumentation. The AMS and the SMPS alternated between the CVI and interstitial inlet. Due to technical problems, the
5
AMS at East Peak was only operated between 8 December and 11 December. To eliminate any possible influence from a nearby generator, any data coincident with the EBC being greater than 3 standard deviations from the mean were excluded from the analysis.
The PVM was mounted on the roof of the trailer and the FSSP was installed
hori-10
zontally on the roof of a small building approximately 10 m from the PVM. No aspirator was used to maintain a constant velocity of droplets through the FSSP but the pre-vailing wind maintained a steady flow through the probe from 2 to 10 m s−1 and the probe was aligned as close to parallel with the wind direction as possible. Given that the variable velocity through the FSSP was not directly measured, the flow volume was
15
estimated by adjusting the sample volume such that the liquid water content (LWC) derived from the measured size distribution matched the LWC measured directly with the PVM. This approach was taken since the PVM is considered more accurate than the FSSP for measuring LWC when the mass is dominated by droplets less 30 µm (Wendisch, 1998) whereas the FSSP is an accurate droplet counting instrument.
As-20
suming that the sizing by the FSSP is accurate to within 20%, the uncertainty in LWC is approximately 35% (Baumgardner, 1983). This leads to an estimated uncertainty in the derived sample volume of approximately 38%, assuming that the PVM has an accuracy of 15%, as cited by the manufacturer. Hence, the number concentration, de-rived from the FSSP droplet count divided by the sample volume, has an uncertainty
25
of 38%, assuming negligible counting losses due to coincidence. The FSSP was only operated during daylight hours given staff limitations but all the other instrumentation, at both measurement sites, were operated 24 h a day during the project.
ACPD
7, 12573–12616, 2007Clouds and aerosols in Puerto Rico J. D. Allan et al. Title Page Abstract Introduction Conclusions References Tables Figures ◭ ◮ ◭ ◮ Back Close
Full Screen / Esc
Printer-friendly Version Interactive Discussion
EGU
3 Results
The measurements took place over the period 9–18 December 2004. The winds were east southeast (ESE) during the first three days, changing to the east northeast (ENE) on 13 December then back ESE on 15 December where they remained throughout the rest of the measurement program. While at no point were the two sites explicitly
5
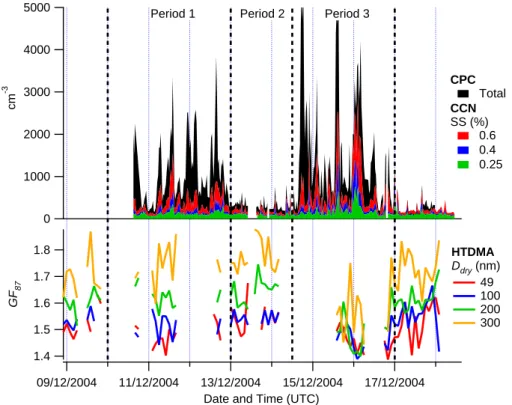
linked in a true Lagrangian manner, it is reasonable to assume that given their prox-imity, the measured compositions will be similar enough to make statements regarding the variations in composition of the regional aerosol. This assumption is backed up by the similarity in the CN concentration time series between the two sites shown in Fig. 2. Using principally the CN concentration and EBC mass concentrations, in
con-10
junction with meteorological data, the observations during the campaign were stratified into three periods defined as “polluted”, “clean” and “polluted”. These time intervals, henceforth referred to as periods 1, 2 and 3, are shown in the time series of Figs. 2 and 3, along with the concentrations of CN and CCN, mean hygroscopic growth factors and mass concentrations of inorganic ions, POM and EBC, all measured at the
light-15
house. Table 2 lists the averages and standard deviations for these parameters during the three periods, as well as the EBC, CN, CCN and AMS-derived mass concentrations measured at East Peak.
The average CN concentrations measured at the two sites changed by approximately the same amount between the periods although the concentration at the East Peak
20
was always somewhat higher. Periods 1 and 3 have much higher CN and the mass concentrations of OC and EBC at the lighthouse are also elevated, which is manifested in the reduced growth factors of the aerosol, possibly as a result of the addition of lower solubility material. This behaviour is most pronounced for period 3. There are more CCN during the polluted episodes but there are less relative to the number of CN, since
25
ACPD
7, 12573–12616, 2007Clouds and aerosols in Puerto Rico J. D. Allan et al. Title Page Abstract Introduction Conclusions References Tables Figures ◭ ◮ ◭ ◮ Back Close
Full Screen / Esc
Printer-friendly Version Interactive Discussion
EGU 3.1 Cape San Juan
The AMS-measured nitrate was also found to have increased during period 3, although it must be noted that this is probably mainly in the form of sodium nitrate in sea salt particles, as nitrate does not coexist with sulphate on acidic particles. This is further supported by the fact that the overwhelming majority of nitrate signal is contained within
5
m/z 30 as opposed to 46, which can be indicative of sodium as opposed to ammonium nitrate (Allan et al., 2004a; Topping et al., 2004). If this is the case, the values reported by the AMS will generally be low compared to the actual total concentrations, as sea salt particles are not detected efficiently due to their size and low volatility. POM con-centrations are generally very low but these too show an increase during periods 1
10
and 3. The ratio of POM to EBC during period 3, the period when the most signif-icant amounts of carbonaceous aerosols were observed, was 2.66. This is greater than the primary OM/EC ratio of 1.4 reported by Zhang et al. (2005), which is to be expected, as there is likely to be a secondary organic component here. If an OM/OC ratio of 2.1 is assumed (Turpin and Lim, 2001), this corresponds to an OC/BC ratio of
15
1.27, which is close to the OC/BC ratios ranging from 1.3 to 2.4 reported by Novakov et al. (2005). However, as stated earlier, the absolute values of the EBC are to be treated with caution, especially at low black carbon concentrations where positive arte-facts due to scattering and weakly absorbing material such as dust may be greatest. The fact that POM, EBC and CN exhibit such marked increases implies that they are
20
linked, probably through the presence of sooty primary emissions in the form of small Aitken-mode particles. In the second period when the site was exposed to air from the clean northeasterly sector, there are reductions in POM and EBC to the point of being at or below the detection limits.
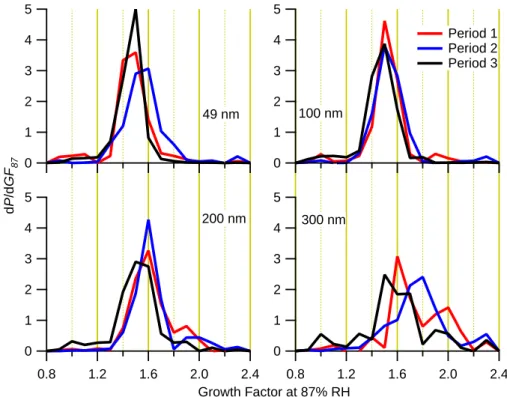
The growth factor spectra recorded by the HTDMA shown in Fig. 4 generally show
25
a consistent mode around a growth factor of 1.5–1.6. This is quite close to the growth factors that are predicted for ammonium sulphate by the model of Topping et al. (2005) (1.57, 1.60, 1.62 and 1.62 for dry diameters of 49, 100, 200 and 300 nm,
respec-ACPD
7, 12573–12616, 2007Clouds and aerosols in Puerto Rico J. D. Allan et al. Title Page Abstract Introduction Conclusions References Tables Figures ◭ ◮ ◭ ◮ Back Close
Full Screen / Esc
Printer-friendly Version Interactive Discussion
EGU tively2), but lower than what would be expected for ammonium bisulphate (1.84, 1.86,
1.87 and 1.88). It may be that the particles are principally ammonium sulphate or they are a more acidified form of sulphate that is internally mixed with a less soluble compo-nent. The latter is deemed unlikely given the consistency of the growth factors, which would require a constant mass ratio between the two components to achieve this.
Un-5
fortunately, without adequate size-resolved ammonium measurements from the AMS (which are not possible in this experiment due to signal-to-noise limitations), it is difficult to definitively say which is happening. In addition to the main mode, there is frequently an additional component of high growth factor (≈2) particles, in particular for the larger dry sizes. These are almost certainly sea salt particles, but the fact that this activity is
10
generally less significant than the principle mode shows that the majority of particles of these dry sizes are not composed of pure sea salt. During period 2, the modal growth factor for 300 nm particles increases to around 1.7, which could be indicative of more acidic sulphate particles. During period 3 (and to a lesser extent period 1), the main mode persists, but a significant “shoulder” of particles of a growth factor of less than
15
1.2 appears, which is likely to be externally mixed soot particles, consistent with the increased EBC and POM concentrations measured.
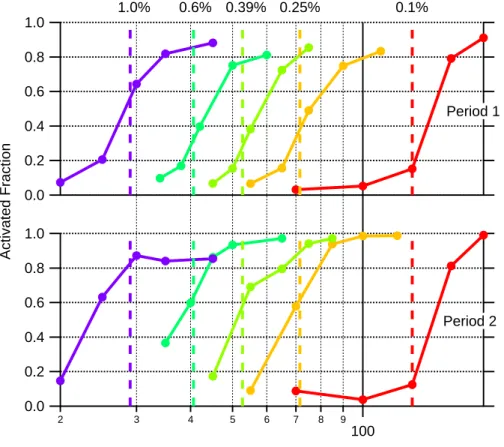
The hygroscopic behaviour is also reflected in the CCN measurements. Figure 5 shows size-resolved CCN activation efficiencies as a function of different supersatura-tions for parts of periods 1 and 2 (data for period 3 were unavailable). During period 1,
20
the small particles (<100 nm) are less easily activated compared to period 2 and the CCN spectra do not always reach unity at high supersaturations. This is in agree-ment with the lower HTDMA growth factors observed during this period (Fig. 4) and is consistent with there being an increased number of POM-containing Aitken mode particles, assuming that these particles are less hygroscopic than the inorganic
parti-25
cles. The activation diameters for pure ammonium sulphate were calculated using the K ¨ohler equation with a variable Van’t Hoff factor as is used in the calibration of the CCN
2
ACPD
7, 12573–12616, 2007Clouds and aerosols in Puerto Rico J. D. Allan et al. Title Page Abstract Introduction Conclusions References Tables Figures ◭ ◮ ◭ ◮ Back Close
Full Screen / Esc
Printer-friendly Version Interactive Discussion
EGU counters (Frank et al., 2007) and are shown as dashed vertical lines on the figure. The
activation behaviour is roughly consistent with these during in period 1, also in agree-ment with the HTDMA growth factors. In period 2 the particles are, in some cases, somewhat more CCN-active than pure ammonium sulphate, especially for the smaller particles. This could, much like the HTDMA growth factors, indicate the presence of
5
acidified sulphate particles. Sea salt particles could also be responsible, but as these are mechanically generated, a bias in this discrepancy towards the larger dry sizes would be expected, which is not the case here.
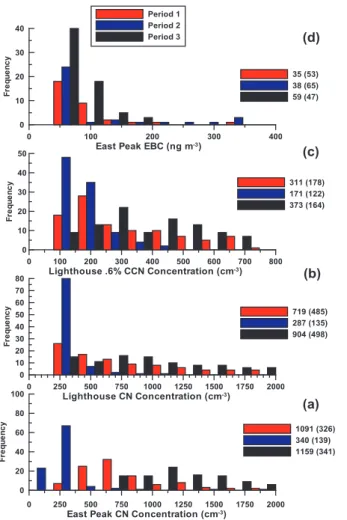
The frequency distributions shown in Fig. 6 highlight the differences in some of the aerosol properties related to air mass origins. Overall, the measurements during
pe-10
riod 3 show the most signs of influence from anthropogenic emissions. The average values of the CN at the lighthouse and East Peak change by a factor of more than three during periods of SE winds, although there are large variations during both clean and polluted periods as seen in the standard deviations. The CCN concentration, mea-sured at 0.6% supersaturation was on average less than 200 cm−3 during the clean
15
period at the lighthouse but more than doubled between the second and third periods. The EBC at East Peak is similar between periods 1 and 2, then increases by nearly a factor of two between periods 2 and 3.
The variations in particle composition are also evident when comparing the averaged size distributions measured with the scanning mobility particle sizer (SMPS). As shown
20
in Fig. 7, the overall number concentrations of Aitken mode (Dm<100 nm) particles
are significantly elevated for periods 1 and 3, which will be manifested in the total CN and CCN number concentrations. In the accumulation mode (Dm≈200 nm), the increases during periods 1 and 3 are more subtle, but are also evident in the AMS sulphate mass distributions from the lighthouse. All of the distributions also contain a
25
“shoulder” in the lower particle diameters, which corresponds to the Aitken modes in the number distributions. A discernable organic mass distribution is only found during period 3, which is more biased towards the smaller particle sizes compared to sulphate, consistent with it being associated with smaller primary particles.
ACPD
7, 12573–12616, 2007Clouds and aerosols in Puerto Rico J. D. Allan et al. Title Page Abstract Introduction Conclusions References Tables Figures ◭ ◮ ◭ ◮ Back Close
Full Screen / Esc
Printer-friendly Version Interactive Discussion
EGU 3.2 East Peak
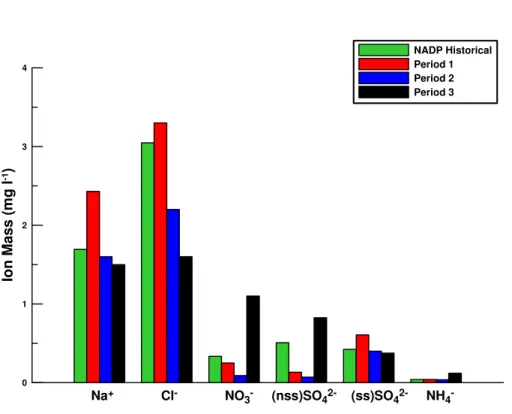
The difference in air mass origin during the three periods was also manifested at the East Peak in the cloud/rain water chemistry. Figure 8 shows the mass concentrations of selected ions, stratified by time period. Also shown in this figure are averages from the NADP archives from 1985 to 2005. The major component during all periods was sea
5
salt. The sea salt (ss) sulphate, calculated using a mass ratio of SO2−4 to Na+of 0.252 (Quinn et al., 2000). The concentrations of non-sea salt (nss) sulphate and nitrate were significantly greater in the third period compared to the other periods, probably due to the oxidation of anthropogenic SO2and NOx. It is also of interest to note that the
chloride to sodium ratio was much smaller during period 3, which indicates that some
10
of the chloride will have been displaced by the uptake of nitric and/or sulphuric acid onto the sea salt particles. The same conclusions were reached during measurements performed in January 2005 at the same site as part of the Rain In Cumulus over the Ocean experiment3.
Due to technical issues, the data coverage of composition measurements using the
15
AMS downstream of the CVI at East Peak was not extensive, but the data that were collected during period 1 (only on 10 December) consistently showed particle residuals mainly composed of sulphate, with small amounts of nitrate and chloride (Table 2). The detection limit for organic matter of the AMS operated on East Peak was 0.2 µg m−3 for the averaged time period. The cloud residual data has to include corrections due
20
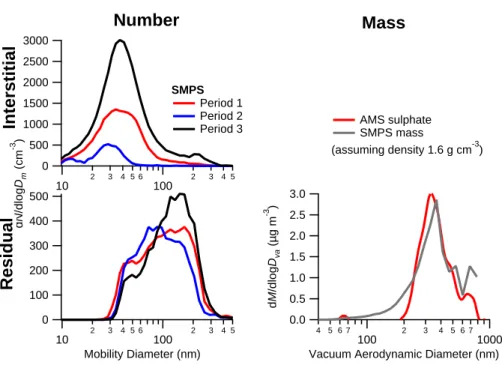
to the CVI sampling efficiency and enrichment, which equate to factors of 10 and 0.25, respectively, yielding an ambient detection limit of 0.5 µg m−3. The average concen-tration of organic matter was clearly below this detection limit. Figure 9 shows a size distribution of the droplet residual aerosol mass concentration of sulphate compared
3
Gioda, A., Mayol-Bracero, O. L., Morales-Garc´ıa, F., Collett, J., Decesari, S., Emblico, L., Facchini, M. C., Morales-De Jes ´us, R. J., Mertes, S., Borrmann, S., Walter, S., and Schnei-der, J.: Chemical composition of cloud water in the Puerto Rican tropical trade winds, Atmos. Environ., submitted, 2007.
ACPD
7, 12573–12616, 2007Clouds and aerosols in Puerto Rico J. D. Allan et al. Title Page Abstract Introduction Conclusions References Tables Figures ◭ ◮ ◭ ◮ Back Close
Full Screen / Esc
Printer-friendly Version Interactive Discussion
EGU with a mass size distribution estimated from the SMPS. Chloride size distributions were
not recorded. The size distribution is very similar to that measured by the AMS at CSJ (Fig. 7). Adding up the AMS mass concentrations leads to a slightly greater total than what can be inferred from the SMPS data, which is probably due to uncertainties in the particle density and AMS collection efficiency. Through the absence of any
measur-5
able organics, these results suggest that no significant amounts of submicron organic particles (primary or secondary) were emitted by the rain forest or human activity in the intervening distance between the site and the coast. In the interstitial aerosol mea-sured at East Peak all substances detectable by the AMS were below detection limit with the exception of sulphate (Table 2). The measured sulphate mass concentrations
10
in the cloud residuals were higher by a factor of about 20. This indicates that almost all sulphate-containing particles were activated as CCN.
Sodium chloride would probably dominate the larger residual particles but this is undetectable by the AMS. In spite of this, significant amounts of chloride (detected as HCl+after ionisation) were measured by the AMS in the residuals at East Peak, but not
15
in the interstitial aerosol. A speculative explanation for this finding may be that aqueous chloride is displaced by sulphate and nitrate absorbed within the cloud and converted to HCl as the cloud droplet dries in the CVI. Being volatile, this is expected to evaporate from the particle, but a fraction may not have time before the aerosol is passed to the instrument, so will be detected on the particles by the AMS.
20
An analysis of the total ion mass, insoluble mass, insoluble particle number con-centrations and median diameter of the insoluble particles in the cloud and rain water samples is listed in Table 3 for periods 1 and 2. The total ion mass and insoluble mass in the cloud water is nearly ten times more than measured in the rain water. The to-tal ion mass and insoluble mass decrease by more than a factor of two between the
25
first and second periods. The insoluble mass may be sooty particles or possibly dust. There is little change in the median insoluble particle diameter between periods 1 and 2 for either the cloud or rain water samples.
ACPD
7, 12573–12616, 2007Clouds and aerosols in Puerto Rico J. D. Allan et al. Title Page Abstract Introduction Conclusions References Tables Figures ◭ ◮ ◭ ◮ Back Close
Full Screen / Esc
Printer-friendly Version Interactive Discussion
EGU size distributions were compared between the times spent sampling via the CVI
resid-ual line and the interstitial inlet during cloudy periods (defined as those time intervals when the LWC was greater than 0.1 g m−3 and the cloud droplet number concentra-tion greater than 100 cm−3for at least twenty minutes). The averaged distributions are shown in Fig. 9. In addition to the larger numbers of interstitial particles overall, the
5
more polluted cases show a significant number of larger particles that are not activated within the clouds. The interstitial particles observed during period 1 are very small (30– 60 nm), which due to their small size are not expected to contribute significantly to the chemical mass concentrations. Period 3 shows significant numbers of non-activated particles of sizes up to 300 nm, whereas in period 2, there are few particles above
10
50 nm that are not activated. These particles must be lower-solubility particles, ex-ternally mixed and with higher critical supersaturations than those that activate in the cloud. The HTDMA growth factor distributions at CSJ confirm the presence of a frac-tion of externally mixed non-hygroscopic particles at dry size 300 nm during period 3, indicating the presence of a lower solubility component. In the residual particles, the
15
number of particles smaller than 80 nm is fewest in period 3 and greatest during pe-riod 2, which may be another manifestation of the increase in the overall solubility of particles, although the addition of secondary material in polluted conditions through aqueous processes in the cloud may be partly responsible for an increase in the size of the residual particles (Chandler et al., 1989).
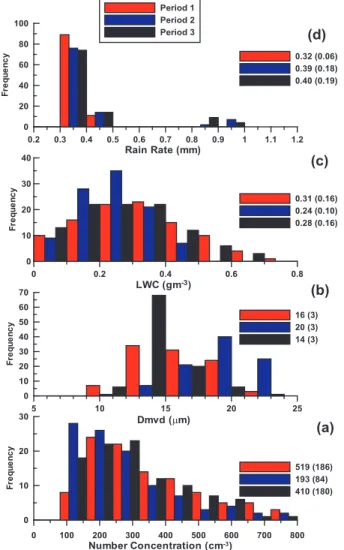
20
The frequency diagrams shown in Fig. 10 illustrate the changes in bulk cloud prop-erties as a function of air mass origin. The figure shows that the average droplet concentrations change by a factor of two between the clean and first polluted period, by 25% from the clean to the second polluted period and that these concentrations are consistent with the average CCN concentrations that were measured at the lighthouse
25
and East Peak (Table 2). The average value of the median volume diameter is 4 µm larger during the clean period (20 µm) than during the polluted period 1 (16 µm) and 6 µm larger than period 3 (14 µm). The LWC during the clean period is 0.24 gm−3 com-pared to 0.30 gm−3in the periods influenced by anthropogenic emissions. The average
ACPD
7, 12573–12616, 2007Clouds and aerosols in Puerto Rico J. D. Allan et al. Title Page Abstract Introduction Conclusions References Tables Figures ◭ ◮ ◭ ◮ Back Close
Full Screen / Esc
Printer-friendly Version Interactive Discussion
EGU precipitation during all periods is nearly the same.
The 00:00 UTC and 12:00 UTC (19:00 and 07:00 local time) soundings from the San Juan International airport4, launched by the U.S. National Weather Service, were evaluated to compare the meteorological state of the atmosphere during the three pe-riods. The pressure of the lifted condensation level (LCL) is used as an indicator of
5
expected cloud base and the precipitable water (PW) as a measure of potential rain amounts. The average LCLs for the three periods were 956±8 mb, 962±11 mb, and 963±4 mb, respectively, indicating little difference in expected cloud bases for the three identified periods. The average PW for these same periods was 40±6 mm, 44±11 mm, and 50±5 mm. There is a positive trend in PW during the nine days of the project;
how-10
ever, this is not reflected in either the precipitation rates or in situ liquid water contents that were measured (Table 2 and Fig. 10). It is possible that the observed differences in the LWC, droplet concentration and median volume diameter are the result of changes in the aerosol population and the resulting dynamical effects such as precipitation ini-tiation, as opposed to mesoscale forcing, although the overall system will be highly
15
complex and impossible to constrain with these measurements alone.
4 Discussion
The overall aerosol composition measured was principally inorganic in nature. The sulphate mass concentrations are consistent with previous field studies in this location and in other non-polluted MBL sites (Allan et al., 2004a; Coe et al., 2006) with the
20
amounts of POM representing a much smaller fraction. This apparent lack of a sig-nificant organic matter mass fraction is corroborated by the HTDMA and size-resolved CCN measurements which consistently showed the majority of the particles exhibiting the hygroscopicity that would be expected with principally inorganic aerosols.
4
Data provided by the University of Wyoming, http://weather.uwyo.edu/upperair/sounding. html.
ACPD
7, 12573–12616, 2007Clouds and aerosols in Puerto Rico J. D. Allan et al. Title Page Abstract Introduction Conclusions References Tables Figures ◭ ◮ ◭ ◮ Back Close
Full Screen / Esc
Printer-friendly Version Interactive Discussion
EGU The two main conditions observed during the study, dictated by the wind sector, were
clean conditions when the air originated from the ENE (period 2) and more polluted conditions when the wind was from the ESE (periods 1 and 3) and resulted in marked changes in both the aerosol composition and the in situ cloud properties. HYSPLIT back trajectory analysis performed using the NOAA Air Resources Laboratory web
5
service5 (Fig. 11) indicates that there was a tendency for the air to come from the direction of populated islands to the east (principally the British Virgin Islands) during periods 1 and 3, with the airmasses having a more northerly origin during period 2. The polluted periods were evident in increased numbers of particles (especially those below 100 nm in diameter), sulphate, EBC and nitrate, which was evident both in the
10
measurements at sea level and within the cloud itself. The particles in the polluted conditions were also shown to, in part, be generally less hygroscopic, with a fraction exhibiting lower sub-saturated growth factors. This, along with the fact that the most significant amounts of organic matter and EBC were seen during this period, points to the additional Aitken-mode particles being produced by combustion sources upwind.
15
The addition of a primary aerosol is also manifested in lower CCN to CN ratios for particles of a given size and also the overall ratio of CCN to CN being suppressed, although the latter may have more to do with the larger number of small particles under these conditions, as activation is very strongly dependent on size (Dusek et al., 2006). However, the greater number concentrations of larger (>100 nm) interstitial particles
20
in the polluted cases would seem to suggest that size alone was not the governing factor controlling activation within the clouds observed. The measured changes in the cloud microphysics during the polluted cases would seem to suggest that even at the modest mass concentrations observed and in spite of the low hygroscopicity of the particles, the pollution from the upwind islands has a measurable effect on the
25
properties of warm clouds, namely an increase in cloud droplet number concentration, with a corresponding decrease in droplet diameter.
When compared to previous studies, there is a marked difference in the climatology
5
ACPD
7, 12573–12616, 2007Clouds and aerosols in Puerto Rico J. D. Allan et al. Title Page Abstract Introduction Conclusions References Tables Figures ◭ ◮ ◭ ◮ Back Close
Full Screen / Esc
Printer-friendly Version Interactive Discussion
EGU in the very low amounts of organic matter measured during the clean periods. Before
arriving at specific conclusions regarding the reduced amounts of organic carbon com-pared to previous studies, it must first be considered that the disagreement between the measurements made in 1992 and 1995 and the current results are due to differ-ences in the measurement techniques. The previous studies made use of the evolved
5
gas analysis (EGA) of bulk samples collected over 8–12 h, whereas this work relies on the organic matter measurements by the AMS systems on times scales of several minutes. A discrepancy between the analytical techniques themselves is not deemed likely, as previous quantitative comparisons between AMS and similar offline organic measurements have been generally very good (Gilardoni et al., 2007; Takegawa et al.,
10
2005; Topping et al., 2004; Zhang et al., 2005). The AMS is not able to detect refrac-tory materials, which may cause a problem if the organic matter were to be bound in sea salt particles. However, this is not deemed to be the issue in this case, as ther-mograms from previous studies (Kirchstetter et al., 2000; Novakov et al., 1997) have shown the bulk of the organic matter to evolve at temperatures below 400◦C, which is
15
well below the vaporizer temperature of the AMS (550◦C). The fact that the AMS does not measure larger particles is also not deemed to be the source of disagreement, as the 1995 study recorded organic mass concentrations within particles below 0.6 µm in diameter, which is below the upper cutoff of the aerodynamic lens used in the AMS.
A potential source of discrepancy between the OC derived from EGA and the POM
20
derived from both of the AMSs is a positive artefact caused by organic vapours that condense onto the filters during the long collection periods (Kirchstetter et al., 2000). The results for OC mass reported in 1992 for measurements made at El Yunque peak (Novakov and Penner, 1993) were more than a factor of two larger than those reported from the lighthouse in 1995 (Novakov et al., 1997). However, the samples taken in
25
1995 were also analyzed differently than those from 1992, correcting for the positive artefact using estimates of the excess material based on measurements with a backup filter, but as reported by Kirchstetter et al. (2000), in the absence of a denuder in front of the sampler to remove the organic vapours, the amount of condensed vapour may
ACPD
7, 12573–12616, 2007Clouds and aerosols in Puerto Rico J. D. Allan et al. Title Page Abstract Introduction Conclusions References Tables Figures ◭ ◮ ◭ ◮ Back Close
Full Screen / Esc
Printer-friendly Version Interactive Discussion
EGU dominate the sample. This indicates that some of the organic matter previously found
on filter samples may be volatile species condensing onto the substrate. While it is not expected that any such repartitioning should occur within the AMS itself, it is possible that it may occur in the sampling stack or inlet manifold used in this deployment. In the standard NOAA configuration used in this study, the stack sub-sample is heated to
5
remove water from the sampled particles, so it is possible that some of the more volatile components of the organic fraction are being driven off. However, given the fact that a significant fraction reported in the previous studies only evolves at temperatures greater than 250◦C, repartitioning effects generating either positive or negative artefacts can only account for a discrepancy of a factor of around 2, which is not enough to explain
10
the differences observed here.
If technical issues are not the main source of disagreement between the past and current studies, then it must be concluded that the organic fraction previously observed at this location is not totally ubiquitous. The study presented here took place in Decem-ber whereas previous measurements were made in OctoDecem-ber, March, April and May, so
15
it is possible that the production of tropical marine organic aerosols is a seasonal phe-nomenon, in the same way as was concluded by O’Dowd et al. (2004) for the northern Atlantic. Or given that some of the measurements took place 10 or more years apart, it could be indicative of a long-term trend of some description. It is also possible that these organic aerosols are produced in a spatially inhomogeneous manner. Previous
20
studies had assumed that the prevailing source sector was northeasterly, bringing air in along the trade winds, but while the climatological wind direction is northeasterly, this work shows an analysis of the daily circulation pattern is essential to precisely lo-cate the air mass origins. A potentially significant detail about the measurement area is the fact that there are many more inhabited islands to the east and southeast of
25
Puerto Rico, which will be sources of organic aerosols in their own right. HYSPLIT back trajectory analysis, using archived wind field data, does indeed show that the wind was consistently originating from the SE during the 1992 measurements. How-ever, these variations did not seem to affect the mass concentrations of organic carbon
ACPD
7, 12573–12616, 2007Clouds and aerosols in Puerto Rico J. D. Allan et al. Title Page Abstract Introduction Conclusions References Tables Figures ◭ ◮ ◭ ◮ Back Close
Full Screen / Esc
Printer-friendly Version Interactive Discussion
EGU measured in 1995 (Novakov et al., 1997), when air came from both the northeast and
southeast sectors. Also, the influence of anthropogenic emissions was ruled out by Mayol-Bracero et al. (2001), who did not detect any PAHs using GC-MS.
Whereas a major difference with previous studies was observed with respect to the general lack of organic aerosols, many of the other measurements are also
dissim-5
ilar, as shown in Table 4, which lists average CN, CCN, sulphate, organics, droplet concentration, LWC and effective radius from this study and those of the 1992 and 1995 studies. The CN and CCN concentrations measured at the El Yunque site were significantly greater than at the East Peak, whereas the cloud droplet concentrations were smaller. This may be a manifestation of the differences in aerosol composition
10
noted during the studies but differences in the instrumentation may also be a factor. The CN counter used in 1992 (a TSI Model 3022) has a lower size threshold than the TSI 3010 used here and the classical aerosol spectrometer probe (CASP) is an earlier, exclusively ground-based version of the FSSP. In addition, as stated earlier, the ap-proach used to derive the number concentration from the FSSP during this study has
15
an uncertainty of almost 40%.
Novakov et al. (1994) observed that the cloud droplet concentration was insensitive to the sulphate concentration, which is apparently at odds with our CCN measure-ments, which are consistent with sulphate being the dominant component. However, CCN measurements alone cannot conclusively show that sulphate is a significant
con-20
trolling factor in the cloud droplet concentrations. During this study, the changes in cloud microphysical behaviour noted here are entirely attributable to the influence of anthropogenic emissions and there is not enough variability within the clean case to observationally assess the influence of sulphate or any natural organics that may be present. More extensive measurements are needed to fully evaluate this. A
quantita-25
tive closure exercise between aerosol properties and cloud microphysics would also go some way to addressing this and the other issues discussed but unfortunately, the data in this study is not deemed sufficient, owing to the unfortunate lack of a reliable sea salt measurement and the fact that there was no verifiable flow connectivity between the
ACPD
7, 12573–12616, 2007Clouds and aerosols in Puerto Rico J. D. Allan et al. Title Page Abstract Introduction Conclusions References Tables Figures ◭ ◮ ◭ ◮ Back Close
Full Screen / Esc
Printer-friendly Version Interactive Discussion
EGU sites during these measurements. A quantitative closure between the aerosol
compo-sition, hygroscopicity and size-resolved CCN measurements may be possible, but will be highly complex and is considered outside the scope of this paper.
5 Conclusions
The Puerto Rico Aerosol Cloud Interaction Study (PRACS) was an intensive, two-site
5
field experiment that took place during December 2004 with the goal of studying in situ aerosol and cloud properties in a tropical marine environment and attempting to study the linkage between the two in a quasi Lagrangian manner. This built on previ-ous studies that had taken place at this location. Aerosol properties measured at the sea level site included number, size, chemical composition, hygroscopicity and CCN
10
behaviour, and used some of the more recent developments in instrumentation. At the mountain site, cloud base microphysics was studied in situ and droplet and rain water composition was measured using both the offline analysis of bulk samples and on-line instrumentation studying the droplet residuals downstream of a counterflow virtual impactor (CVI).
15
Generally speaking, the majority of the submicron, non sea salt aerosol encountered during the study was exclusively composed of sulphate, with the exception of a period of ESE winds where small amounts of organic matter and black carbon were detected and to a lesser extent, sulphate and nitrate were also enhanced. This extra component was manifested as additional particles mainly below 100 nm in diameter, consistent
20
with urban or industrial primary emissions. These elevated the overall CCN concen-trations, despite the added particles having lower hygroscopicities. The change in air mass origin, from clean to moderately polluted, was also detected in the cloud prop-erties as an increase in droplet concentration and significant decrease in the median volume diameter. Changes also occurred in the interstitial and cloud droplet residual
25
particles, with greater numbers of particles, notably so at larger sizes, not activating and the residual particles increasing in size overall. Increases in the sulphate, nitrate
ACPD
7, 12573–12616, 2007Clouds and aerosols in Puerto Rico J. D. Allan et al. Title Page Abstract Introduction Conclusions References Tables Figures ◭ ◮ ◭ ◮ Back Close
Full Screen / Esc
Printer-friendly Version Interactive Discussion
EGU and insoluble material were also found in the cloud water consistent with anthropogenic
emissions.
Unlike in previous studies, an organic fraction large enough to perturb the CCN prop-erties of the aerosol was not observed in the clean sector and the controlling compo-nent was, if anything, non-sea salt sulphate. While this disagreement may be due to
5
technical issues associated with differences in the methodologies, it is unlikely to be the sole reason. It could be that the organic matter in the region is not ubiquitous and is dependent on either seasonal biological activity or source region.
In order to answer the questions fully, a complete closure between aerosol and cloud measurements would be required, which would be difficult for this dataset and deemed
10
outside of the scope of this paper. However, these observations do highlight many outstanding questions regarding the extent and effect of tropical aerosols on clouds, the organic fraction in particular. A long term sampling project in this environment and a detailed, systematic comparison with wind field analysis would go a long way to addressing the uncertainty of the true extent and origin of organic aerosols (both
15
natural and anthropogenic) within this region. This would ideally be used in tandem with cloud microphysical measurements and models in order to assess what influence these aerosols have on tropical clouds.
Acknowledgements. The authors would like to thank the following: P. Sheridan and J. Ogren of
the National Oceanographic and Atmospheric Administration (NOAA) Earth Systems Research 20
Laboratory for their support with the aerosol measurements at Cape San Juan; J. Collett of Col-orado State University for loan of the cloud water sampler; the Caribbean National Forest and the Federal Aviation Administration for access to the East Peak site and the Conservation Trust of Puerto Rico for access to the Cape San Juan lighthouse site. Coastline data used in the figures was provided by the National Geophysical Data Center, land relief data provided by 25
the U.S. Geological Survey and back trajectories calculated using the NOAA Air Resources Laboratory HYSPLIT service. This project was funded by the Mexican Science Foundation (Conacyt grant #45310), the Royal Society International Joint Projects scheme, the National Science Foundation (grant #0342548) and the Max Planck Society. Special thanks to T. No-vakov, whose critical review and helpful suggestions have greatly improved the manuscript. 30
ACPD
7, 12573–12616, 2007Clouds and aerosols in Puerto Rico J. D. Allan et al. Title Page Abstract Introduction Conclusions References Tables Figures ◭ ◮ ◭ ◮ Back Close
Full Screen / Esc
Printer-friendly Version Interactive Discussion
EGU
References
Allan, J. D., Jimenez, J. L., Williams, P. I., Alfarra, M. R., Bower, K. N., Jayne, J. T., Coe, H., and Worsnop, D. R.: Quantitative sampling using an Aerodyne aerosol mass spectrometer – 1. Techniques of data interpretation and error analysis, J. Geophys. Res.-Atmos., 108, 4090, doi:10.1029/2002JD002358, 2003.
5
Allan, J. D., Bower, K. N., Coe, H., Boudries, H., Jayne, J. T., Canagaratna, M. R., Millet, D. B., Goldstein, A. H., Quinn, P. K., Weber, R. J., and Worsnop, D. R.: Submicron aerosol compo-sition at Trinidad Head, California, during ITCT 2K2: Its relationship with gas phase volatile organic carbon and assessment of instrument performance, J. Geophys. Res.-Atmos., 109, D23S24, doi:10.1029/2003JD004208, 2004a.
10
Allan, J. D., Coe, H., Bower, K. N., Alfarra, M. R., Delia, A. E., Jimenez, J. L., Middlebrook, A. M., Drewnick, F., Onasch, T. B., Canagaratna, M. R., Jayne, J. T., and Worsnop, D. R.: A generalised method for the extraction of chemically resolved mass spectra from Aerodyne aerosol mass spectrometer data, J. Aerosol. Sci., 35, 909–922, 2004b.
Baumgardner, D.: An Analysis and Comparison of 5 Water Droplet Measuring-Instruments, J. 15
Clim. Appl. Meteorol., 22, 891–910, 1983.
Bond, T. C. and Bergstrom, R. W.: Light absorption by carbonaceous particles: An investigative review, Aerosol Sci. Technol., 40, 27–67, 2006.
Bower, K. N., Choularton, T. W., Gallagher, M. W., Colvile, R. N., Beswick, K. M., Inglis, D. W. F., Bradbury, C., Martinsson, B. G., Swietlicki, E., Berg, O. H., Cederfelt, S. I., Frank, G., 20
Zhou, J., Cape, J. N., Sutton, M. A., McFadyen, G. G., Milford, C., Birmili, W., Yuskiewicz, B. A., Wiedensohler, A., Stratmann, F., Wendisch, M., Berner, A., Ctyroky, P., Galambos, Z., Mesfin, S. H., Dusek, U., Dore, C. J., Lee, D. S., Pepler, S. A., Bizjak, M., and Divjak, B.: The Great Dun Fell Experiment 1995: an overview, Atmos. Res., 50, 151–184, 1999.
Canagaratna, M. R., Jayne, J. T., Jimenez, J. L., Allan, J. D., Alfarra, M. R., Zhang, Q., Onasch, 25
T. B., Drewnick, F., Coe, H., Middlebrook, A., Delia, A., Williams, L. R., Trimborn, A. M., Northway, M. J., DeCarlo, P. F., Kolb, C. E., Davidovits, P., and Worsnop, D. R.: Chemical and microphysical characterization of ambient aerosols with the Aerodyne aerosol mass spectrometer, Mass Spectrom. Rev., 26, 185–222, 2007.
Chandler, A. S., Choularton, T. W., Dollard, G. J., Gay, M. J., Gallagher, M. W., Hill, T. A., Jones, 30
B. M. R., Penkett, S. A., Tyler, B. J., and Bandy, B.: A Field-Study of the Oxidation of SO2 in a Cap Cloud at Great Dun Fell, Q. J. Roy. Meteorol. Soc., 115, 397–420, 1989.
ACPD
7, 12573–12616, 2007Clouds and aerosols in Puerto Rico J. D. Allan et al. Title Page Abstract Introduction Conclusions References Tables Figures ◭ ◮ ◭ ◮ Back Close
Full Screen / Esc
Printer-friendly Version Interactive Discussion
EGU
Coe, H., Allan, J. D., Alfarra, M. R., Bower, K. N., Flynn, M. J., McFiggans, G. B., Topping, D. O., Williams, P. I., O’Dowd, C. D., Dall’Osto, M., Beddows, D. C. S., and Harrison, R. M.: Chemical and physical characteristics of aerosol particles at a remote coastal location, Mace Head, Ireland, during NAMBLEX, Atmos. Chem. Phys., 6, 3289–3301, 2006,
http://www.atmos-chem-phys.net/6/3289/2006/. 5
Comarazamy, D. E., Gonzalez, J. E., Tepley, C. A., Raizada, S., and Pandya, R. V. R.: Effects of atmospheric particle concentration on cloud microphysics over Arecibo, J. Geophys. Res.-Atmos., 111, D09205, doi:10.1029/2005JD006243, 2006.
Cubison, M. J., Coe, H., and Gysel, M.: A modified hygroscopic tandem DMA and a data retrieval method based on optimal estimation, J. Aerosol. Sci., 36, 846–865, 2005.
10
DeCarlo, P. F., Slowik, J. G., Worsnop, D. R., Davidovits, P., and Jimenez, J. L.: Particle Morphology and Density Characterization by Combined Mobility and Aerodynamic Diameter Measurements. Part 1: Theory, Aerosol Sci. Technol., 38, 1185–1205, 2004.
Delene, D. J., Deshler, T., Wechsler, P., and Vali, G. A.: A balloon-borne cloud condensation nuclei counter, J. Geophys. Res.-Atmos., 103, 8927–8934, 1998.
15
Delene, D. J. and Deshler, T.: Calibration of a photometric cloud condensation nucleus counter designed for deployment on a balloon package, J. Atmos. Ocean Technol., 17, 459–467, 2000.
Demoz, B. B., Collett, J. L., and Daube, B. C.: On the Caltech Active Strand Cloudwater Col-lectors, Atmos. Res., 41, 47–62, 1996.
20
Dusek, U., Frank, G. P., Hildebrandt, L., Curtius, J., Schneider, J., Walter, S., Chand, D., Drewnick, F., Hings, S., Jung, D., Borrmann, S., and Andreae, M. O.: Size matters more than chemistry for cloud-nucleating ability of aerosol particles, Science, 312, 1375–1378, 2006.
Forster, P., Ramaswamy, V., Artaxo, P., Berntsen, T., Betts, R., Fahey, D. W., Haywood, J., Lean, 25
J., Lowe, D. C., Myhre, G., Nganga, J., Prinn, R., Raga, G., Schulz, M., and Dorland, R. V.: Changes in Atmospheric Constituents and in Radiative Forcing, in: Climate Change 2007: The Physical Science Basis. Contribution of Working Group I to the Fourth Assessment Report of the Intergovernmental Panel on Climate Change, edited by: Solomon, S., Qin, D., Manning, M., Chen, Z., Marquis, M., Averyt, K. B., Tignor, M., and Miller, H. L., pp. 129–234, 30
Cambridge Univ. Press, Cambridge; New York, 2007.
Frank, G., Dusek, U., and Andreae, M. O.: Technical note: A method for measuring size-resolved CCN in the atmosphere, Atmos. Chem. Phys. Discuss., 6, 4879–4895, 2006,
ACPD
7, 12573–12616, 2007Clouds and aerosols in Puerto Rico J. D. Allan et al. Title Page Abstract Introduction Conclusions References Tables Figures ◭ ◮ ◭ ◮ Back Close
Full Screen / Esc
Printer-friendly Version Interactive Discussion
EGU
http://www.atmos-chem-phys-discuss.net/6/4879/2006/.
Frank, G., Dusek, U., and Andreae, M. O.: Technical note: Characterization of a static thermal-gradient CCN counter, Atmos. Chem. Phys., 7, 3071–3080, 2007,
http://www.atmos-chem-phys.net/7/3071/2007/.
Gilardoni, S., Russell, L. M., Sorooshian, A., Flagan, R. C., Seinfeld, J. H., Bates, T. S., Quinn, 5
P. K., Allan, J. D., Williams, B., Goldstein, A. H., Onasch, T. B., and Worsnop, D. R.: Regional variation of organic functional groups in aerosol particles on four US east coast platforms during the International Consortium for Atmospheric Research on Transport and Transforma-tion 2004 campaign, J. Geophys. Res.-Atmos., 112, D10S27, doi:10.1029/2006JD007737, 2007.
10
Gysel, M., Crosier, J., Topping, D. O., Whitehead, J. D., Bower, K. N., Cubison, M. J., Williams, P. I., Flynn, M. J., McFiggans, G. B., and Coe, H.: Closure between measured and mod-elled particle hygroscopic growth during TORCH2 implies ammonium nitrate artefact in the HTDMA measurements, Atmos. Chem. Phys. Discuss., 6, 12 503–12 548, 2006.
Jayne, J. T., Leard, D. C., Zhang, X. F., Davidovits, P., Smith, K. A., Kolb, C. E., and Worsnop, 15
D. R.: Development of an aerosol mass spectrometer for size and composition analysis of submicron particles, Aerosol Sci. Technol., 33, 49–70, 2000.
Kirchstetter, T. W., Novakov, T., Morales, R., and Rosario, O.: Differences in the volatility of organic aerosols in unpolluted tropical and polluted continental atmospheres, J. Geophys. Res.-Atmos., 105, 26 547–26 554, 2000.
20
Kr ¨amer, M., Sch ¨ule, M., and Sch ¨utz, L.: A method to determine rainwater solutes from pH and conductivity measurements, Atmos. Environ., 30, 3291–3300, 1996.
Lance, S., Medina, J., Smith, J. N., and Nenes, A.: Mapping the operation of the DMT Contin-uous Flow CCN counter, Aerosol Sci. Technol., 40, 242–254, 2006.
Maria, S. F., Russell, L. M., Turpin, B. J., and Porcja, R. J.: FTIR measurements of functional 25
groups and organic mass in aerosol samples over the Caribbean, Atmos. Environ., 36, 5185– 5196, 2002.
Mayol-Bracero, O. L., Rosario, O., Corrigan, C. E., Morales, R., Torres, I., and Perez, V.: Chemi-cal characterization of submicron organic aerosols in the tropiChemi-cal trade winds of the caribbean using gas chromatography/mass spectrometry, Atmos. Environ., 35, 1735–1745, 2001. 30
McFiggans, G., Artaxo, P., Baltensperger, U., Coe, H., Facchini, M. C., Feingold, G., Fuzzi, S., Gysel, M., Laaksonen, A., Lohmann, U., Mentel, T. F., Murphy, D. M., O’Dowd, C. D., Snider, J. R., and Weingartner, E.: The effect of physical and chemical aerosol properties on warm
ACPD
7, 12573–12616, 2007Clouds and aerosols in Puerto Rico J. D. Allan et al. Title Page Abstract Introduction Conclusions References Tables Figures ◭ ◮ ◭ ◮ Back Close
Full Screen / Esc
Printer-friendly Version Interactive Discussion
EGU
cloud droplet activation, Atmos. Chem. Phys., 6, 2593–2649, 2006,
http://www.atmos-chem-phys.net/6/2593/2006/.
McMurry, P. H.: A review of atmospheric aerosol measurements, Atmos. Environ., 34, 1959– 1999, 2000.
Mertes, S., Lehmann, K., Nowak, A., Massling, A., and Wiedensohler, A.: Link between aerosol 5
hygroscopic growth and droplet activation observed for hill-capped clouds at connected flow conditions during FEBUKO, Atmos. Environ., 39, 4247–4256, 2005.
Novakov, T. and Penner, J. E.: Large Contribution of Organic Aerosols to Cloud-Condensation-Nuclei Concentrations, Nature, 365, 823–826, 1993.
Novakov, T., Riveracarpio, C., Penner, J. E., and Rogers, C. F.: The Effect of Anthropogenic 10
Sulfate Aerosols on Marine Cloud Droplet Concentrations, Tellus B, 46, 132–141, 1994. Novakov, T., Corrigan, C. E., Penner, J. E., Chuang, C. C., Rosario, O., and Mayol-Bracero,
O. L.: Organic aerosols in the Caribbean trade winds: A natural source?, J. Geophys. Res.-Atmos., 102, 21 307–21 313, 1997.
Novakov, T., Menon, S., Kirchstetter, T. W., Koch, D., and Hansen, J. E.: Aerosol organic 15
carbon to black carbon ratios: Analysis of published data and implications for climate forcing, J. Geophys. Res.-Atmos., 110, D21205, doi:10.1029/2005JD005977, 2005.
O’Dowd, C. D., Facchini, M. C., Cavalli, F., Ceburnis, D., Mircea, M., Decesari, S., Fuzzi, S., Yoon, Y. J., and Putaud, J. P.: Biogenically driven organic contribution to marine aerosol, Nature, 431, 676–680, 2004.
20
Quinn, P. K., Bates, T. S., Miller, T. L., Coffman, D. J., Johnson, J. E., Harris, J. M., Ogren, J. A., Forbes, G., Anderson, T. L., Covert, D. S., and Rood, M. J.: Surface Submicron Aerosol Chemical Composition: What Fraction is Not Sulfate?, J. Geophys. Res.-Atmos., 105, 6785– 6806, 2000.
Roberts, G. C. and Nenes, A.: A continuous-flow streamwise thermal-gradient CCN chamber 25
for atmospheric measurements, Aerosol Sci. Technol., 39, 206–221, 2005.
Rose, D., Frank, G. P., Dusek, U., Gunthe, S. S., Andreae, M. O., and P ¨oschl, U.: Calibra-tion and measurement uncertainties of a continuous-flow cloud condensaCalibra-tion nuclei counter (DMT-CCNC): CCN activation of ammonium sulfate and sodium chloride aerosol particles in theory and experiment, Atmos. Chem. Phys. Discuss., 7, 8193–8260, 2007,
30
http://www.atmos-chem-phys-discuss.net/7/8193/2007/.
Sheridan, P. J., Delene, D. J., and Ogren, J. A.: Four years of continuous surface aerosol mea-surements from the Department of Energy’s Atmospheric Radiation Measurement Program


![[DOC] Cours environnement réseau et active directory](data:image/gif;base64,R0lGODlhAQABAIAAAP///wAAACH5BAEAAAAALAAAAAABAAEAAAICRAEAOw==)