HAL Id: hal-00299120
https://hal.archives-ouvertes.fr/hal-00299120
Submitted on 16 Apr 2004
HAL is a multi-disciplinary open access
archive for the deposit and dissemination of
sci-entific research documents, whether they are
pub-lished or not. The documents may come from
teaching and research institutions in France or
abroad, or from public or private research centers.
L’archive ouverte pluridisciplinaire HAL, est
destinée au dépôt et à la diffusion de documents
scientifiques de niveau recherche, publiés ou non,
émanant des établissements d’enseignement et de
recherche français ou étrangers, des laboratoires
publics ou privés.
Probabilistic high-resolution forecast of heavy
precipitation over Central Europe
C. Marsigli, A. Montani, F. Nerozzi, T. Paccagnella
To cite this version:
C. Marsigli, A. Montani, F. Nerozzi, T. Paccagnella. Probabilistic high-resolution forecast of heavy
precipitation over Central Europe. Natural Hazards and Earth System Science, Copernicus
Publica-tions on behalf of the European Geosciences Union, 2004, 4 (2), pp.315-322. �hal-00299120�
SRef-ID: 1684-9981/nhess/2004-4-315
© European Geosciences Union 2004
and Earth
System Sciences
Probabilistic high-resolution forecast of heavy precipitation over
Central Europe
C. Marsigli, A. Montani, F. Nerozzi, and T. Paccagnella
ARPA-SIM, Bologna, Italy
Received: 20 October 2003 – Revised: 19 December 2003 – Accepted: 28 January 2004 – Published: 16 April 2004 Part of Special Issue “Multidisciplinary approaches in natural hazards”
Abstract. The limited-area ensemble prediction system
COSMO-LEPS has been running operationally at ECMWF since November 2002. Five runs of the non-hydrostatic limi-ted-area model Lokal Modell (LM) are available every day, nested on five selected members of three consecutive 12-h lagged ECMWF global ensembles. The limited-area ensem-ble forecasts range up to 120 h and LM-based probabilistic products are disseminated to several national weather ser-vices. COSMO-LEPS has been constructed in order to have a probabilistic system with high resolution, focussing the at-tention on extreme events in regions with complex orogra-phy. In this paper, the performance of COSMO-LEPS for a heavy precipitation event that affected Central Europe in Au-gust 2002 has been examined. At the 4-day forecast range, the probability maps indicate the possibility of the overcom-ing of high precipitation thresholds (up to 150 mm/24 h) over the region actually affected by the flood. Furthermore, one out of the five ensemble members predicts 4 days ahead a precipitation structure very similar to the observed one.
1 Introduction
The forecast of severe weather events is still a challenging problem. The key role played by mesoscale and orographic-related processes can seriously limit the predictability of in-tense and localised events. Although the use of high-reso-lution limited-area models (LAMs) has improved the short-range prediction of locally intense events, it is sometimes dif-ficult to forecast accurately their space-time evolution, espe-cially for ranges longer than 48 h. In the recent years, many weather centres have given more and more emphasis to the probabilistic approach (Tracton and Kalnay, 1993; Molteni et al., 1996; Houtekamer et al., 1996), which has proved to be an important tool to tackle the predictability problem beyond day 2. Nevertheless, global ensemble systems are usually run at a relatively low horizontal resolution (80 km
Correspondence to: C. Marsigli
at most), this limiting their usefulness when the forecast of severe and localised weather events is concerned. As re-gards the use of limited-area models within ensemble sys-tems, ARPA-SIM (Agenzia Regionale Prevenzione e Ambi-ente – Servizio Idrometeorologico, that is the Regional Hy-drometeorological Service of Emilia-Romagna) developed LEPS (Molteni et al., 2001; Marsigli et al., 2001; Montani et al., 2001, 2003a), the Limited-area Ensemble Prediction System. The LEPS methodology allows to combine the ben-efits of the probabilistic approach (a set of different evolu-tion scenarios is provided to the forecaster) with the high-resolution detail of the LAM integrations, with a limited computational investment. The system is based on the op-erational ensemble system of ECMWF (European Centre for Medium-Range Weather Forecasts), the EPS (Ensemble
Pre-diction System). The EPS uses a TL255L40 version of the
ECWMF model (spectral model with truncation at wavenum-ber 255 and 40 vertical levels), corresponding to a horizontal resolution of about 80 km. The model is integrated 51 times, at 00:00 and 12:00 UTC of every day, starting from slighlty different initial conditions. This generate an “ensemble” of 51 forecasts, each of them being an ensemble “member”. The initial conditions are obtained by perturbing the oper-ational analysis (from which the “control run” starts) with 25 pairs of perturbations, which are selected in order to max-imise their energy growth in the first 48 h of integrations. For further detalis the reader is referred to Molteni et al. (1996) and Buizza et al. (2003).
LEPS methodology is based on the idea of ensemble size reduction (Molteni et al., 2001; Marsigli et al., 2001): first, the global-ensemble members are grouped into clusters and, then, a representative member (RM) is chosen within each cluster. Finally, each RM, which is representative of a pos-sible evolution scenario, provides both initial and boundary conditions for the integrations with the high-resolution LAM, whose runs generate LEPS.
It has been shown (Molteni et al., 2001; Marsigli et al., 2001; Montani et al., 2001, 2003a), over a number of test cases and for several forecast ranges (48–120 h), that LEPS
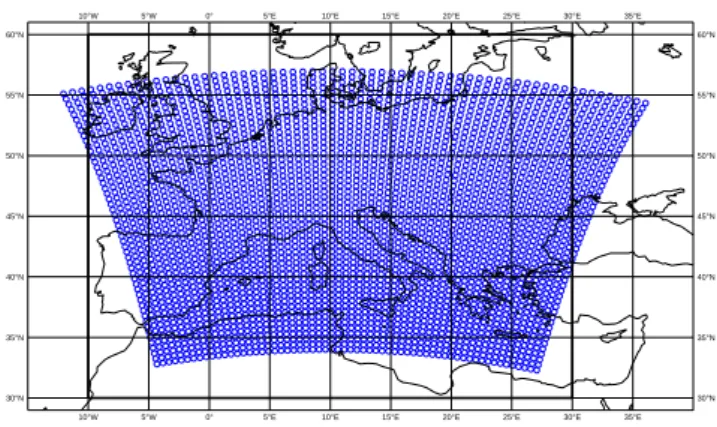
316 C. Marsigli et al.: Probabilistic high-resolution forecast of heavy precipitation 30°N 30°N 35°N 35°N 40°N 40°N 45°N 45°N 50°N 50°N 55°N 55°N 60°N 60°N 10°W 10°W 5°W 5°W 0° 0° 5°E 5°E 10°E 10°E 15°E 15°E 20°E 20°E 25°E 25°E 30°E 30°E 35°E 35°E
Fig. 1. COSMO-LEPS operational domain (small circles) and clustering area (big rectangle).
performs better than EPS concerning the quantitative fore-cast of intense precipitation, as well as the geographical localisation of the regions most likely to be affected by the flood events.
Following the encouraging results of an early experimen-tal phase, the generation of an “experimenexperimen-tal-operational” limited-area ensemble prediction system, the COSMO-LEPS project, has recently started on the ECMWF computer sys-tem under the auspices of COSMO (Montani et al., 2003b). COSMO (COnsortium for Small-scale MOdelling, web site: www.cosmo-model.org) is a consortium involving Germany, Italy, Switzerland, Greece and Poland, which aims to de-velop, improve and maintain the non-hydrostatic limited-area model Lokal Modell (LM). Therefore COSMO-LEPS aims at the development and pre-operational test of a “short to medium-range” (48–120 h) probabilistic forecasting system using LM.
In this work, the performance of COSMO-LEPS system is assessed for the heavy precipitation event which struck Central Europe between 11 and 13 August 2002. The at-tention is focussed over the 24 h between 12 August 2002 at 06:00 UTC and 13 August 2002 at 06:00 UTC, when very heavy precipitation was recorded over Central Europe, par-ticularly over South-Eastern Germany. In order to see what would have been the COSMO-LEPS performance on this case and the extent to which the system could have been of any help in forecasting this event, the operational configura-tion is used (described in Sect 2). The 4-day predictability of the event is investigated. This time range is chosen be-cause some signal of the possible occurrence of heavy pre-cipitation over Europe was already given by the EPS, on which the COSMO-LEPS system is based, but the event was largely misplaced and its intensity underestimated (Grazzini and van der Grijn , 2003). The paper is organised as follows: in Sect. 2 the COSMO-LEPS system is described, while in Sect. 3 the case study is presented. In Sect. 4 the results are discussed, both for COSMO-LEPS and for ECMWF EPS. Finally, conclusions are drawn in Sect. 5.
OLDEST EPS
MIDDLE EPS
YOUNGEST EPS
1 5 3 M E M B E R S
N − 2 N − 1 N N + 1 N + 2 N + 3 N + 4
COSMO−LEPS products ready youngest EPS products ready
+120h +108h +96h Starting of LM integrations Clustering Times +120h +144h +132h 0h 0h 0h +24h +12h 12 12 12 12 12 12 12 00 00 00 00 00 00
Fig. 2. Details of the COSMO-LEPS suite.
2 The COSMO-LEPS operational system
The COSMO-LEPS probabilistic forecasting system uses LM over a domain covering all countries involved in COSMO (Fig. 1).
Thanks to the experience gained during the early exper-imental phase, it was decided to set-up the COSMO-LEPS suite (see Fig. 2) as follows (the suite is referred to day N, the day at which the products are ready in the early morn-ing).
Three successive 12-h-lagged EPS runs (started at 12:00 UTC of day N −2, at 00:00 and 12:00 UTC of
day N −1) are grouped together. Each EPS is made by
51 members, so a 153-member “super-ensemble” is obtained (Montani et al., 2003a). This permits to span a wider part of the unstable phase space and to avoid that the system re-lies on a unique ensemble. A multivariate hierarchical cluster analysis is performed on the 153 members so as to group all of them into 5 clusters (of different populations). The Com-plete Linkage method, using Euclidean distances, has been chosen as the clustering method (Wilks, 1995). The number of clusters is fixed to keep constant the size of the limited-area ensemble, five clusters seeming a reasonable compro-mise between the need to represent all the possible scenarios and the need to reduce computational time for LAM integra-tions. The clustering variables are the two horizontal wind components, the geopotential height and the specific humid-ity at 3 pressure levels (500, 700 and 850 hPa) and at 2 fore-cast time (96 and 120 h for the “youngest” EPS, started at 12:00 UTC of day N −1) (Montani et al., 2001). These fields have been chosen to have a good characterisation of the syn-optic pattern in the middle-lower troposphere together with a characterisation in terms of the specific humidity, the fore-cast of heavy precipitation being the main goal of the
sys-tem. The clustering domain covers the region 30◦N–60◦N,
10◦W–30◦E (rectangle in Fig. 1). Within each cluster, one
representative member (RM) is selected by minimising the ratio between intra and inter-cluster distances: the RM is that member closest to the other members of its own cluster and most distant from the members of the other clusters. This
560 560 560 560 568 568 568 568 568 576 576 576 576 584 584 584 584 592 592 592 35°N 35°N 40°N 40°N 45°N 45°N 50°N 50°N 55°N 55°N 6°W 6°W 1°W 1°W 4°E 4°E 9°E 9°E 14°E 14°E 19°E 19°E 24°E 24°E 29°E 29°E 4 560 568 568 568 568 576 576 576 576 584 584 584 584 592 592 592 35°N 35°N 40°N 40°N 45°N 45°N 50°N 50°N 55°N 55°N 6°W 6°W 1°W 1°W 4°E 4°E 9°E 9°E 14°E 14°E 19°E 19°E 24°E 24°E 29°E 29°E 4 560 560 568 568 568 568 576 576 576 576 584 584 584 584 592 592 592 35°N 35°N 40°N 40°N 45°N 45°N 50°N 50°N 55°N 55°N 6°W 6°W 1°W 1°W 4°E 4°E 9°E 9°E 14°E 14°E 19°E 19°E 24°E 24°E 29°E 29°E 4 560 568 568 568 568 568 576 576 576 576 584 584 584 592 592 592 35°N 35°N 40°N 40°N 45°N 45°N 50°N 50°N 55°N 55°N 6°W 6°W 1°W 1°W 4°E 4°E 9°E 9°E 14°E 14°E 19°E 19°E 24°E 24°E 29°E 29°E 4
Fig. 3. ECMWF analysis of the geopotential height [dam] at 500 hPa on the 11 August at 12:00 UTC, on the 12 August at 00:00 UTC, on the 12 August at 12:00 UTC and on the 13 August at 00:00 UTC, from top to bottom and from left to right. Contour interval is 4 dam.
ratio is calculated on the basis of the same variables and the same metric used for clustering; hence, 5 RMs are selected. Each RM provides initial and boundary conditions for the in-tegrations with LM, which is run 5 times for 120 h, always starting at 12:00 UTC of day N −1 and ending at 12:00 UTC of day N +4. For a discussion on the motivations that led to this set up of the system, the reader is referred to Molteni et al. (2001), Marsigli et al. (2001), Montani et al. (2001), Montani et al. (2003a) and Montani et al. (2003b). The LM has a horizontal resolution 1x'10 km, 33 vertical levels and the time-step used for the integrations is 60 s. Probability maps based on LM runs are generated by assigning to each LM integration a weight proportional to the population of the cluster from which the RM (providing initial and bound-ary conditions) was selected. Deterministic products (that is, the 5 LM scenarios in terms of surface and upper-level fields) are also produced. The products are disseminated to the COSMO community for evaluation. COSMO-LEPS dis-semination started during November 2002 and, at the time of writing (December 2003), the system is being tested to as-sess its usefulness in met-ops rooms, particularly in terms of
the assistance given to forecasters in cases of extreme events. An objective probabilistic verification of the system is also being carried on.
3 The August 2002 flood over Central Europe
During August 2002 several Atlantic systems passed across Europe, leading to cyclogenesis over the Mediterranean Sea. A sharp trough over the British Isles developed into a cut-off upper-air low on 10 August, which triggered surface cy-clogenesis over the Mediterranean Sea. On 11 and 12 Au-gust the cut-off low moved slowly north-eastward (Fig. 3), advecting warm and moist Mediterranean air with a south-easterly flow into central Europe. Enhanced instability due to convegence of this air, together with colder maritime air advancing from the west, reinvigorated the surface low as it moved north-eastward. This process was further enhanced due to orographic lifting on mountain ridges of Central Eu-rope (Grazzini and van der Grijn , 2003).
318 C. Marsigli et al.: Probabilistic high-resolution forecast of heavy precipitation 45°N 45°N 49°N 49°N 53°N 53°N 6°E 6°E 10°E 10°E 14°E 14°E 18°E 18°E 22°E 22°E 0.2 10 20 50 75 100 150 200
Fig. 4. Observed precipitation [mm] recorded by the SYNOP sta-tions between 12 August 2002 at 06:00 UTC and 13 August 2002 at 06:00 UTC.
Precipitation exceeding 100 mm/24 h was recorded by
several raingauges in the area between 12–16◦E and
47–51.5◦N, with precipitation exceeding 300 mm/24 h over
the Ore Mountains. The maximum recorded value
(313 mm/24 h at 13.75◦E, 50.73◦N) is the highest ever
recorded 24 h precipitation amount in Germany. Further-more, measured values are very close to what is assumed to be the maximum areal precipitation for that region. In Fig. 4 it is shown a map with the precipitation observed in this pe-riod, obtained by interpolating SYNOP data kindly provided by U. Damrath.
As for ECMWF deterministic forecast of this event, a cut-off low over Europe was actually present a few days ahead, but its position was not correctly forecast earlier than three days before the event. As a consequence, high amounts of precipitation were predicted but mostly on the southern side of the Alps. Almost the same holds for the operational EPS forecasts, only a weak signal over Central Europe being pre-sent staring from the run of the 9 August (Grazzini and van der Grijn , 2003). Note that the EPS of the 9 August is the “youngest” ensemble making up the “super-ensemble” for this case study.
4 Results
For this experiment, the COSMO-LEPS integrations start at 12:00 UTC of the 9 August 2002, in order to investigate the predictability of the event at the 4-day forecast range. Three consecutive 51-member EPS sets have been re-run in a con-figuration identical to the operational one, in order to archive the EPS forecast fields which provide initial and bound-ary conditions to the limited-area model: EPS starting at 12:00 UTC of the 8 August 2002, EPS starting at 00:00 UTC of the 9 August 2002 and EPS starting at 12:00 UTC of the 9 August 2002. These 153 runs have been grouped so as to generate the so-called “super-ensemble” and the operational COSMO-LEPS Cluster Analysis has been applied.
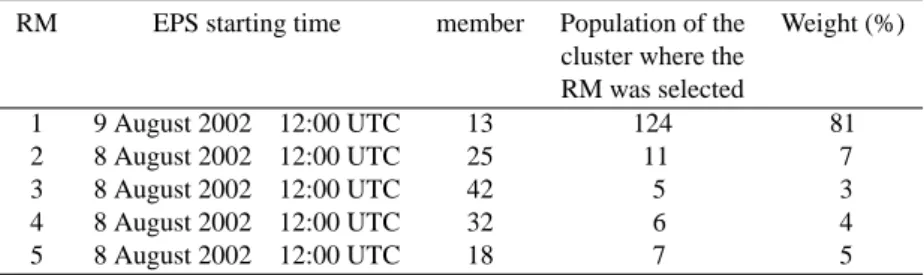
The five selected members (Table 1) provide initial and boundary conditions for the five LM runs.
45°N 45°N 49°N 49°N 53°N 53°N 6°E 6°E 10°E 10°E 14°E 14°E 18°E 18°E 22°E 22°E 10 30 60 90 100 45°N 45°N 49°N 49°N 53°N 53°N 6°E 6°E 10°E 10°E 14°E 14°E 18°E 18°E 22°E 22°E 10 30 60 90 100
Fig. 5. COSMO-LEPS weighted probability maps of 24 h precipi-tation exceeding 20 mm (top panel) and 50 mm (bottom panel) be-tween 06:00 UTC of 12 August and 06:00 UTC of 13 August, at 4-day forecast range (66–90 h).
4.1 COSMO-LEPS performance
In Fig. 5 the COSMO-LEPS probability maps are shown, computed as in the operational configuration, by weight-ing each member accordweight-ing to its own cluster population relative to the total number of super-ensemble members. The top (bottom) panel shows the probability of exceeding 20 mm/24 h (50 mm/24 h).
The region which is indicated as the most likely to be af-fected by intense precipitation is not the one where heavy precipitation was actually observed (Fig. 4): probability of exceeding 20 and 50 mm/24 h is forecast too much to the east. Furthermore, probability values are rather high, this assigning a high degree of confidence to this forecast. Prob-ability values exceed 60% over almost all the area where the occurrence of intense precipitation is forecast. This is due to the very high population of the first cluster (Table 1), whose RM is given a weight of about 80% when probability maps are computed. Problems occur because this member is not providing a skillful forecast and, to a lesser extent, the whole most populated cluster is not providing a good forecast too. This is clearly related to the error in the positioning of the precipitating structure in the “youngest” EPS runs, already underlined in Sect. 3, whose members are almost all gath-ered in the first cluster (not shown). In Fig. 6 the five dif-ferent scenarios of precipitation forecast by COSMO-LEPS
Table 1. Cluster Analysis results: RM number (first column), starting date and time of the EPS to which the selected member belongs (second column), number of the member (third column), population of the cluster represented by that member (fourth column), weight given to the RM on the basis of the cluster population (fifth column).
RM EPS starting time member Population of the Weight (%) cluster where the
RM was selected 1 9 August 2002 12:00 UTC 13 124 81 2 8 August 2002 12:00 UTC 25 11 7 3 8 August 2002 12:00 UTC 42 5 3 4 8 August 2002 12:00 UTC 32 6 4 5 8 August 2002 12:00 UTC 18 7 5
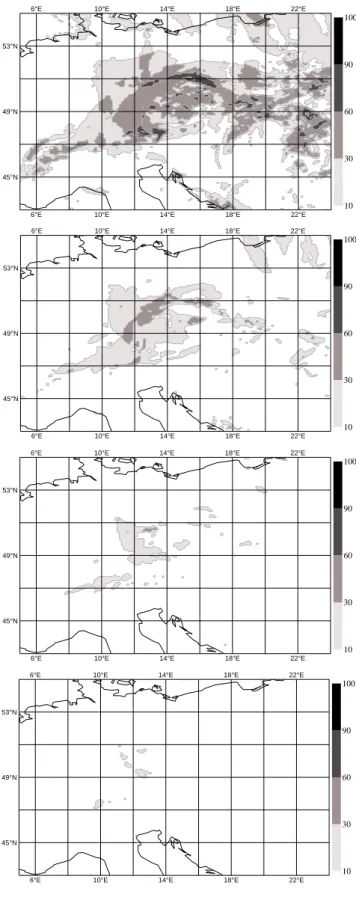
(66–90 h forecast range) are shown: the 5 LM integrations are referred to as LM1, LM2, LM3, LM4 and LM5, re-spectively. The precipitation pattern forecast by LM1 (top panel) determines to a great extent the high-probabilty pat-tern shown in Fig. 5. This structure is different from the ob-served one, due to the misplacement of the cut-off low in the LM1 forecast (top panel of Fig. 7). While both LM2 and LM3 (second and third panel of Fig. 6) forecast almost no heavy precipitation over Central Europe, the two left
mem-bers provide more accurate precipitation forecasts. LM4
forecasts a precipitation pattern very similar to the one actu-ally observed, but the whole structure is shifted to the west by about one degree of longitude. The skill of the pattern is re-lated to the rather good positioning and depth of the cyclone forecast by this member (Fig. 7, fourth panel). Finally, LM5 forecast in terms of geopotential height is not particularly ac-curate, the shape of the cut-off low being stretched in the NE-to SW-direction with respect NE-to the analysed one (Fig. 3, bot-tom right panel). The forecast precipitation structure suffers from the same kind of mispositioning, but still has some skill over Germany. Precipitation exceeding 100 mm/24 h is
cor-rectly forecast in the area between 12–14◦E and 50–51◦N,
where the maximum of precipitation was observed. Also the spot of heavy precipitation recorded over the Alps, at about
10◦E–47◦N, is captured, even if the whole structure in this
area is overestimated. Precipitation over Austria is almost missing.
It has to be underlined that both LM4 and LM5 forecasts are obtained by nesting the limited-area model on members belonging to the “oldest” EPS, the one starting on 8 August at 12:00 UTC. In this case, the “youngest” EPS members all almost all gathered in cluster 1, descrbing a wrong scenario. The use of older members permits to recover different and, in this case, more correct information. The skill of the precipi-taton forecast by LM4 and LM5 is not reflected in the proba-bility maps, because the two members are given little weight (Table 1). The probability maps obtained giving the same weight to each of the 5 members (Fig. 8) could have been more helpful to forecast this event. Probability of precipi-tation exceeding 50 mm/24 h (second panel from the top) ex-ceeds 10% over a broad region, but higher probabilities (over 30%) concentrate over the region of South-Eastern Germany
actually affected by the heavy rainfall (between 12–14◦E
and 50–52◦N, see Fig. 4). This region is also indicated as
the most likely to be affected by precipitation exceeding the 100 mm/24 h threshold. Probability values are slightly above 10% over the whole region but increase to over 40% in the flooded area. A weaker signal is also present in the proba-bility map relative to the 150 mm/24 h threshold. It has to be pointed out that we are investigating the 4-day predictabil-ity of this weather event. Therefore we are not aiming at a very detailed forecast in terms of both localisation and inten-sity, but at the detection of the possible occurrence of heavy precipitation in the correct area.
4.2 EPS performance
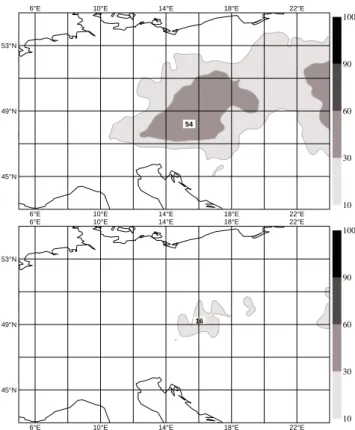
In order to evaluate the added value brought about by the COSMO-LEPS probabilistic forecast for this case, its per-formance is compared to the operational ECMWF EPS ones as well as to the ones of the super-ensemble forecast on which the COSMO-LEPS system is based, obtained without any added cost with respect to EPS. The probability maps of the operational EPS starting at 12:00 UTC of the 09 Au-gust 2003 are shown in Fig. 9, for the 20 (top panel) and 50 mm/24 h (bottom panel) thresholds. The possible occur-rence of precipitation exceeding 20 mm/24 h is forecast over a broad area too much shifted to the east, confirming the al-ready underlined tendency of the EPS for this case to forecast intense precipitation over the wrong area. The occurrence of higher precipitation is given a small probability only over an area between Austria and Czech Republic, to the east of the region where the highest precipitation occurred. No signal in the probability maps is present over the area actually af-fected by heavy precipitation in South-Eastern Germany, nor is reported any signal for higher precipitation thresholds (not shown).
In the probability maps obtained with the super-ensemble on which COSMO-LEPS is based (Fig. 10), the broad area where precipitation exceeding 20 mm/24 h is forecast with a over −10% probability, extends a little to the west, reach-ing the flooded region, but the area showreach-ing higher proba-bilities is largely reduced. The same holds for the precipi-tation exceeding 50 mm/24 h, only a small probability over one of the regions (Austria) where heavy precipitation actu-ally occurred being forecast. The signal over Germany is still missing and no probability at higher threshold is forecast.
320 C. Marsigli et al.: Probabilistic high-resolution forecast of heavy precipitation 45°N 45°N 49°N 49°N 53°N 53°N 6°E 6°E 10°E 10°E 14°E 14°E 18°E 18°E 22°E 22°E 0.2 10 20 50 75 100 150 200 45°N 45°N 49°N 49°N 53°N 53°N 6°E 6°E 10°E 10°E 14°E 14°E 18°E 18°E 22°E 22°E 0.2 10 20 50 75 100 150 200 45°N 45°N 49°N 49°N 53°N 53°N 6°E 6°E 10°E 10°E 14°E 14°E 18°E 18°E 22°E 22°E 0.2 10 20 50 75 100 150 200 45°N 45°N 49°N 49°N 53°N 53°N 6°E 6°E 10°E 10°E 14°E 14°E 18°E 18°E 22°E 22°E 0.2 10 20 50 75 100 150 200 45°N 45°N 49°N 49°N 53°N 53°N 6°E 6°E 10°E 10°E 14°E 14°E 18°E 18°E 22°E 22°E 0.2 10 20 50 75 100 150 200
Fig. 6. COSMO-LEPS forecast precipitation [mm] between 06:00 UTC of 12 August and 06:00 UTC of 13 August, at 4-day forecast range (66-90 h), relative to the 5 LM integrations (from top to bottom). 568 568 576 576 576 576 584 584 584 592 592 592 35°N 35°N 40°N 40°N 45°N 45°N 50°N 50°N 55°N 55°N 6°W 6°W 1°W 1°W 4°E 4°E 9°E 9°E 14°E 14°E 19°E 19°E 24°E 24°E 29°E 29°E 4 552 552 560 560 568 568 568 568 576 576 576 584 584 584 592 592 592 35°N 35°N 40°N 40°N 45°N 45°N 50°N 50°N 55°N 55°N 6°W 6°W 1°W 1°W 4°E 4°E 9°E 9°E 14°E 14°E 19°E 19°E 24°E 24°E 29°E 29°E 4 552 560 560 568 568 568 576 576 576 576 584 584 584 584 592 592 592 35°N 35°N 40°N 40°N 45°N 45°N 50°N 50°N 55°N 55°N 6°W 6°W 1°W 1°W 4°E 4°E 9°E 9°E 14°E 14°E 19°E 19°E 24°E 24°E 29°E 29°E 4 560 560 568 568 568 568 568 576 576 576 584 584 584 592 592 35°N 35°N 40°N 40°N 45°N 45°N 50°N 50°N 55°N 55°N 6°W 6°W 1°W 1°W 4°E 4°E 9°E 9°E 14°E 14°E 19°E 19°E 24°E 24°E 29°E 29°E 4 576 576 576 576 576 576 584 584 584 584 592 592 35°N 35°N 40°N 40°N 45°N 45°N 50°N 50°N 55°N 55°N 6°W 6°W 1°W 1°W 4°E 4°E 9°E 9°E 14°E 14°E 19°E 19°E 24°E 24°E 29°E 29°E 4
Fig. 7. COSMO-LEPS forecast of geopotential height [dam] at 500 hPa at 00:00 UTC of 13 August (84 h forecast range), relative to the 5 LM integrations (from top to bottom). Contour interval is 4 dam.
5 Conclusions
COSMO-LEPS has been designed in order to have a tool for the prediction of heavy precipitation events in a prob-abilistic environment. It provides a set of weather scenar-ios at high spatial resolution as well as probability maps for the main surface parameters. On a case study basis, it has been proved to be successful in the prediction of intense rainfall events (Montani et al., 2003b). The case examined in this work was remarkable both for the gravity of its ef-fects and for the little predictability of the event, as forecast by ECMWF systems (both deterministic and probabilistic) and by the operational forecasts of the affected countries
(U. Damrath, personal communication). Being
COSMO-LEPS based on ECMWF EPS, the missing of the event by the global probabilistic forecast system penalises to a cer-tain extent the limited-area one. Nevertheless, this case has been chosen to test if our ensemble-reduction methodology would have been able to provide sufficiently different sce-narios in order to have a sufficiently broad spectrum of what could have happened with the mesoscale features added by the limited-area model. It has been shown that, out of the five COSMO-LEPS members, one run (LM4) proved to be skill-ful in forecasting 4 days ahead the precipitation structure that was actually observed, although with a small misplacement error. This error led to a different distribution of the intense precipitation over Central Europe: a maximum is still present in the Elbe river basin, even if it is concentrated in its south-ern part, but precipitation is also extending southwards and westwards, affecting also part of the Danube basin. In addi-tion to this, also another member (LM5) forecasts heavy pre-cipitation over the area actually affected by the flood. Proba-bility maps indicate the possiProba-bility of the overcoming of high precipitation thresholds (up to 150 mm/24 h) over the region actually affected by the flood. This is especially true in the not-weighted configuration, because the most skillful mem-bers are not the ones to which more weight would be usually given by the operational COSMO-LEPS configuration, due to the great fraction of EPS members which forecast a syn-optic pattern rather different to the observed one. In this case, as it has been observed in other cases with low predictabil-ity (Marsigli et al., 2001), weighting the ensemble members according to the cluster population reduces the signal of the extreme event. This result suggests to look at all the five sce-narios provided by the system. This is possible thanks to the small size of the ensemble and could be, at this stage, more helpful rather than to consider only the probability maps. The objective probabilistic verification, which is being carried out at ARPA-SIM, will provide more solid information on the proper use of the weighting procedure. It is important to re-mind that the COSMO-LEPS suite is an experimental one and that objective and subjective verification by forecasters will be useful in order to ameliorate the system and under-stand its usefulness and limitations.
45°N 45°N 49°N 49°N 53°N 53°N 6°E 6°E 10°E 10°E 14°E 14°E 18°E 18°E 22°E 22°E 10 30 60 90 100 45°N 45°N 49°N 49°N 53°N 53°N 6°E 6°E 10°E 10°E 14°E 14°E 18°E 18°E 22°E 22°E 10 30 60 90 100 45°N 45°N 49°N 49°N 53°N 53°N 6°E 6°E 10°E 10°E 14°E 14°E 18°E 18°E 22°E 22°E 10 30 60 90 100 45°N 45°N 49°N 49°N 53°N 53°N 6°E 6°E 10°E 10°E 14°E 14°E 18°E 18°E 22°E 22°E 10 30 60 90 100
Fig. 8. COSMO-LEPS not-weighted probability maps of 24 h pre-cipitation exceeding 20 mm, 50 mm, 100 mm and 150 mm (from top to bottom) between 06:00 UTC of 12 August and 06:00 UTC of 13 August, at 4-day forecast range (66–90 h).
322 C. Marsigli et al.: Probabilistic high-resolution forecast of heavy precipitation 54 45°N 45°N 49°N 49°N 53°N 53°N 6°E 6°E 10°E 10°E 14°E 14°E 18°E 18°E 22°E 22°E 10 30 60 90 100 16 45°N 45°N 49°N 49°N 53°N 53°N 6°E 6°E 10°E 10°E 14°E 14°E 18°E 18°E 22°E 22°E 10 30 60 90 100
Fig. 9. EPS probability maps of precipitation exceeding 20 mm/24 h and 50 mm/24 h between 06:00 UTC of 12 August and 06:00 UTC of 13 August, at 4-day forecast range (66–90 h).
Acknowledgements. The authors thank U. Damrath for the data
provided and for his and G. Doms help in defining the time range to investigate. We also thank F. Grazzini for useful discussions. We are grateful to two anonymous referees, whose comments greatly helped in improving the manuscript.
Edited by: T. Glade Reviewed by: two referees
References
Buizza, R., Richardson, D. S., and Palmer, T. N.: Benefits of in-creased resolution in the ECMWF ensemble system and com-parison with poor-man’s ensembles, Quart. J. Roy. Meteor. Soc., 129, 1269–1288, 2003.
Grazzini, F. and van der Grijn, G.: Central European floods during summer 2002, ECMWF Newsletter, 96, 18–28, 2003.
Houtekamer, P. L., Derome, J., Ritchie, H., and Mitchell, H. L.: A system simulation approach to ensemble prediction, Mon. Wea. Rev., 124, 1225–1242, 1996.
Marsigli, C., Montani, A., Nerozzi, F., Paccagnella, T., Tibaldi, S., Molteni, F., Buizza, R.: A strategy for High-Resolution Ensem-ble Prediction, Part II: Limited-area experiments in four Alpine flood events, Quart. J. Roy. Meteor. Soc., 127, 2095–2115, 2001.
42 45°N 45°N 49°N 49°N 53°N 53°N 6°E 6°E 10°E 10°E 14°E 14°E 18°E 18°E 22°E 22°E 10 30 60 90 100 11 45°N 45°N 49°N 49°N 53°N 53°N 6°E 6°E 10°E 10°E 14°E 14°E 18°E 18°E 22°E 22°E 10 30 60 90 100
Fig. 10. Super-ensemble probability maps of precipitation exceed-ing 20 mm/24 h, 50 mm/24 h between 06:00 UTC of 12 August and 06:00 UTC of 13 August, at 4-day forecast range (66–90 h).
Molteni, F., Buizza, R., Palmer, T. N., Petroliagis, T.: The ECMWF Ensemble Prediction System: Methodology and vali-dation, Quart. J. Roy. Meteor. Soc., 122, 73–119, 1996. Molteni, F., Buizza, R., Marsigli, C., Montani, A., Nerozzi, F., and
Paccagnella, T.: A strategy for High-Resolution Ensemble Pre-diction, Part I: Definition of Representative Members and Global Model Experiments, Quart. J. Roy. Meteor. Soc., 127, 2069– 2094, 2001.
Montani, A., Marsigli, C., Nerozzi, F., Paccagnella, T., and Buizza, R.: Performance of ARPA–SMR Limited–area Ensem-ble Prediction System: two flood cases Nonl. Pr. Geo., 8, 387– 399, 2001.
Montani, A., Marsigli, C., Nerozzi, F., Paccagnella, T., Tibaldi, S., and Buizza, R.: The Soverato flood in Southern Italy: perfor-mance of global and limited–area ensmeble forecasts, Nonl. Pr. Geo., 10, 261–274, 2003a.
Montani, A., Capaldo, M., Cesari, D., Marsigli, C., Modigliani, U., Nerozzi, F., Paccagnella, T., Patruno, P., and Tibaldi, S.: Opera-tional limited–area ensmeble forecasts based on the Lokal Mod-ell, ECMWF Newsletter Summer 2003, 98, 2–7, 2003b. Tracton, M. S. and Kalnay, E.: Operational ensemble prediction at
the National Meteorological Centre: Practical Aspects, Wea. and Forecasting, 8, 379–398, 1993.
Wilks, D. S.: Statistical Methods in the Atmospheric Sciences, Aca-demic Press, New York, 467, 1995.
![Fig. 3. ECMWF analysis of the geopotential height [dam] at 500 hPa on the 11 August at 12:00 UTC, on the 12 August at 00:00 UTC, on the 12 August at 12:00 UTC and on the 13 August at 00:00 UTC, from top to bottom and from left to right](https://thumb-eu.123doks.com/thumbv2/123doknet/14787297.599387/4.892.84.812.101.647/ecmwf-analysis-geopotential-height-august-august-august-august.webp)
![Fig. 4. Observed precipitation [mm] recorded by the SYNOP sta- sta-tions between 12 August 2002 at 06:00 UTC and 13 August 2002 at 06:00 UTC.](https://thumb-eu.123doks.com/thumbv2/123doknet/14787297.599387/5.892.459.817.92.518/fig-observed-precipitation-recorded-synop-tions-august-august.webp)
![Fig. 7. COSMO-LEPS forecast of geopotential height [dam] at 500 hPa at 00:00 UTC of 13 August (84 h forecast range), relative to the 5 LM integrations (from top to bottom)](https://thumb-eu.123doks.com/thumbv2/123doknet/14787297.599387/7.892.92.406.88.1035/cosmo-forecast-geopotential-height-august-forecast-relative-integrations.webp)