HAL Id: hal-03033957
https://hal.sorbonne-universite.fr/hal-03033957
Submitted on 1 Dec 2020HAL is a multi-disciplinary open access
archive for the deposit and dissemination of sci-entific research documents, whether they are pub-lished or not. The documents may come from teaching and research institutions in France or abroad, or from public or private research centers.
L’archive ouverte pluridisciplinaire HAL, est destinée au dépôt et à la diffusion de documents scientifiques de niveau recherche, publiés ou non, émanant des établissements d’enseignement et de recherche français ou étrangers, des laboratoires publics ou privés.
formation of the North West Atlantic Deep Water
Markus Weinbauer, Christian Griebler, Hendrik van Aken, Gerhard Herndl
To cite this version:
Markus Weinbauer, Christian Griebler, Hendrik van Aken, Gerhard Herndl. Viral infection of prokary-otic plankton during early formation of the North West Atlantic Deep Water. Aquatic Microbial Ecology, Inter Research, 2020, 84, pp.175-189. �10.3354/ame01934�. �hal-03033957�
Copy-edited by LD Todd
1 2
Viral infection of prokaryotic plankton during early formation of the
3North West Atlantic Deep Water
45
Markus G. Weinbauer1,*, Christian Griebler2, Hendrik M. van Aken3, Gerhard J. Herndl4,5 6
7
1Sorbonne Universités, UPMC Univ Paris 06, CNRS, Laboratoire d’Océanographie de Villefranche 8
(LOV), 181 Chemin du Lazaret, 06230 Villefranche-sur-Mer, France
9
2Department of Limnology & Bio-Oceanography, University of Vienna, Althanstrasse 14, 1090 10
Vienna, Austria
11
3Department of Physical Oceanography, Royal Netherlands Institute for Sea Research (NIOZ), 12
1790 AB Den Burg, The Netherlands
13
4Department of Marine Biology, University of Vienna, Althanstrasse 14, 1090 Vienna, Austria 14
5Department of Biological Oceanography, Royal Netherlands Institute for Sea Research (NIOZ), 15
1790 AB Den Burg, The Netherlands
16 17
*Corresponding author: [email protected]
18
Running head: Weinbauer et al.: Viruses in the North Atlantic Deep Water
19 20
ABSTRACT: Viral abundance was assessed in different water masses of the NW Atlantic, and the
21
development of viral abundance, lytic viral infection and lysogeny was followed for the first ca.
22
5000 km (corresponding to ca. 50 yr in the oceanic conveyor belt) of the western branch of the
23
North Atlantic Deep Water (NADW). Viral abundance was significantly higher in the 100 m layer
24
than in the NADW (2400–2700 m depth) and the Denmark Strait Overflow Water (2400–3600 m
25
depth). The virus-to-prokaryote ratio (VPR) increased with depth, ranging from 32–43 for different
26
water masses of the bathypelagic ocean, thus corroborating the enigma of high viral abundance in
27
the dark ocean. The O2-minimum layer (250–600 m) also showed high viral abundance and VPRs. 28
Viral abundance, a viral subgroup and VPRs decreased in a non-linear form with distance from the
29
NADW origin. Viral production (range: 0.2–2.4 × 10⁷ viruses l–1) and the fraction of lytically 30
NADW. Conservative estimations of virus-mediated mortality of prokaryotes in the NADW
32
averaged 20 ± 12%. The fraction of the prokaryotic community with lysogens (i.e. harboring a
33
functional viral DNA) in the NADW averaged 21 ± 14%. Hence, we conclude that (1) viral
34
abundance and subgroups differ between water masses, (2) virus-mediated mortality of prokaryotes
35
as well as lysogeny are significant in the dark ocean and (3) the lysogenic life strategy becomes
36
more important than the lytic life style during the early formation of the NADW.
37
KEY WORDS: NADW ∙ Thermohaline circulation ∙ Dark ocean ∙ Viral production ∙ Lysogeny ∙
38
Microorganisms
39
1. INTRODUCTION
40It is now well accepted that viruses represent the most abundant ‘life forms’ in the ocean and
41
that viral lysis is a major mortality factor for marine microorganisms in the upper ocean (e.g.
42
(Wommack & Colwell 2000, Weinbauer 2004, Winter et al. 2010, Zimmerman et al. 2020). Lysis
43
not only causes cell death but also releases the cell contents as dissolved organic matter (DOM) and
44
converts cell walls into small detritus; this viral shunt plays an important role in the cycling of
45
carbon and nutrients (Gobler et al. 1997, Wilhelm & Suttle 1999, Brussaard et al. 2008, Weinbauer
46
et al. 2009b) and in carbon export by the biological pump (Weinbauer et al. 2009a, Yamada et al.
47
2018).
48
During the last 1–2 decades, viral ecology of the dark ocean has been increasingly studied.
49
Data sets are available on viral abundance (VA) and production (VP) in the water column of the
50
dark realm of the Atlantic Ocean (Parada et al. 2007, De Corte et al. 2010, 2012, 2016, Muck et al.
51
2014, Winter et al. 2018), Pacific and Southern Ocean (Li et al. 2014, Yang et al. 2014),
52
Mediterranean Sea (Winter et al. 2009, Umani et al. 2010) and from a circumnavigation expedition
53
(Lara et al. 2017). Some of these studies reported that prokaryotic abundance (PA) decreased faster
54
with depth than VA, thus resulting in a high virus-to-prokaryote ratio (VPR) in the bathypelagic and
55
abyssopelagic ocean; however, there are also exceptions (Winter et al. 2009, Lara et al. 2017). This
56
presents an enigma, since host abundances are 1–2 orders of magnitude lower in deep than in
57
surface waters, which should—according to theory—result in a reduced contact rate between
58
viruses and hosts and thus in reduced viral infection and production (Murray & Jackson 1992).
59
However, it has been demonstrated that lytic VP is a major source of prokaryotic mortality in the
60
dark ocean. Data on viral production and virus-mediated mortality in the dark ocean are available
61
for the Chukchi Sea (Steward et al. 1996), Mediterranean Sea (Weinbauer et al. 2003, Winter et al.
2009, Umani et al. 2010), Atlantic Ocean (Parada et al. 2007, De Corte et al. 2010, 2012, Muck et
63
al. 2014) and Pacific Ocean (Li et al. 2014, Yang et al. 2014).
64
Lysogeny, i.e. the phenomenon that prokaryotic cells can harbour a provirus (viral DNA)
65
which can be induced by specific environmental conditions, has also been studied in the dark ocean
66
(Weinbauer et al. 2003, De Corte et al. 2010, 2012). It is believed that lysogeny is established when
67
the encounter rate between phages and host cells is low or when viral decay rates are high, i.e. in
68
conditions unfavourable to hosts (e.g. Stewart & Levin 1984, Weinbauer 2004). Using isolates, it
69
has been argued that a high host density destabilizes the interaction between a lytic phage and its
70
host (Bohannan & Lenski 1997). Therefore, development of lysogeny would stabilize this
71
interaction and support the survival of the phage line (Williams 1994). In this case, lysogeny might
72
also be beneficial in high host-density environments (Weinbauer 2004). Indeed, it has been
73
suggested that lysogeny can dominate when host abundance and production is high, i.e. in
74
conditions favourable for hosts (‘piggyback-the-winner’ model; Knowles et al. 2016). Metagenomic
75
studies suggest that provirus gene induction, and thus lysogeny, is the predominant life strategy in
76
the deep sea (Williamson et al. 2008, Mizuno et al. 2016). Some studies have reported that lysogeny
77
and inducible lysogenic VP typically increase with water depth compared to lytic VP; however,
78
other studies have also reported the inverse trend. The inducing agents of lysogenic bacteria are not
79
known for the dark ocean but it has been suggested that mixing of water masses can cause provirus
80
induction (Winter et al. 2018).
81
Depth-related variations in prokaryotic biomass and production have been summarized (e.g.
82
Nagata et al. 2000, Arístegui et al. 2009). In contrast to such depth trends, the functioning of the
83
global ocean is primarily explained by the lateral transport of physically distinct water masses
84
(thermohaline circulation) (Broecker 1997). Thermohaline circulation begins in the Greenland–
85
Iceland–Norwegian (GIN) Sea. Differences in prokaryotic activity and community composition
86
were investigated in distinct water masses of this North Atlantic Deep Water (NADW) during
87
several cruises (Reinthaler et al. 2006, Teira et al. 2006, Agogué et al. 2011). Here, we investigated
88
VA and distinct viral groups as assessed by flow cytometry in the different water masses and
89
followed the development of VA, VP, lytic viral infection and lysogeny in the western branch of the
90
NADW during the TRNSAT-II cruise. The water mass was sampled from close to its formation for
91
about 5500 km, thus covering approximately the first 50 yr of the NADW in the oceanic conveyor
92
belt system.
93
2. MATERIALS AND METHODS
942.1. Study site and sampling
95The western branch of the NADW was followed with the R/V ‘Pelagia’ from near its source
96
of origin in the GIN Sea for over ca. 5000 km ( ). The TRANSAT-II cruise (May 2003)
97
followed a track from 62.5° N, 30.3° W to 37.7° N, 69.7° W in the western basin of the North
98
Atlantic, covering 34 stations (Fig. 1). The distance of the stations from the origin of the NADW
99
was calculated using Ocean Data View (http://odv.awi.de). Water was collected with a CTD rosette
100
sampler holding twenty four 12 l no oxygen exchange (NOEX) bottles. Samples were taken from
101
100 m depth (subsurface layer [SSL]), the oxygen minimum zone and the main deep water masses
102
encountered during the cruise. The main water masses sampled were the Labrador Sea Water
103
(LSW), the NADW and the Denmark Strait Overflow Water (DSOW). These specific water masses
104
were identified based on their temperature and salinity characteristics (see Table 1) and their
105
oxygen concentrations, using a Seabird SBE43 oxygen sensor mounted on the CTD frame. For
106
more details of the sampling and water mass characterization, see Reinthaler et al. (2006) and Teira
107
et al. (2006). From these water masses, seawater samples were collected for physical–chemical
108
parameters, PA, VA and VP and to estimate lytic and lysogenic infection.
109
2.2. Methods for data used from previous publications
110The following data were obtained from previous publications on the TRANSAT-II cruise.
111
For details and references see Reinthaler et al. (2006) and Teira et al. (2006). Briefly, apparent
112
oxygen utilization (AOU) was calculated as the difference between the saturation oxygen
113
concentration and the observed oxygen concentration. The concentrations of inorganic nutrients
114
(NH4, NO3, NO2 and PO4) were determined immediately after sample collection and gentle 115
filtration through 0.2 mm filters (Acrodisc; Gelman Science) in a TRAACS autoanalyzer system.
116
NH4 was detected with the indo-phenol blue method (pH 10.5) at 630 nm. NO2 was determined 117
after diazotation with sulfanilamide and N-(1-naphtyl)-ethylene diammonium-dichloride as the
118
reddish-purple dye complex at 540 nm. NO3 was reduced in a copper cadmium coil to NO2 (with 119
imidazole as a buffer) and then measured as NO2. PO4 was determined via the molybdenum blue 120
complex at 880 nm.
121
For enumeration of heterotrophic prokaryotes, samples (1 ml) of unfiltered seawater were
122
fixed with 37% 0.2 mm filtered (Acrodisc; Gelman) formaldehyde (2% final concentration), stained
123
with 0.5 ml of SYBR Green I (Molecular Probes) at room temperature in the dark for 15 min and
124
subsequently analyzed on a FACSCalibur flow cytometer (BD Biosciences). Counts were
125
performed with an argon laser at 488 nm set at an energy output of 15 mW. Prokaryotic cells were
126
enumerated according to their right-angle light scatter and green fluorescence measured at 530 nm.
Prokaryotic heterotrophic production (PHP) in seawater was measured by 3H-leucine 128
incorporation (specific activity: 595.7 3 1010 Bq mmol–1; final concentration: 10 nmol l–1). Two 129
10–40 ml samples and 1 blank were incubated in the dark. The blank was fixed with concentrated
130
0.2 mm filtered formaldehyde (4% final concentration, v/v) 10 min prior to adding the tracer. After
131
incubating the samples and the blank at in situ temperature for 4–12 h, depending on the expected
132
activity, the samples were fixed with formaldehyde (4% final concentration), filtered onto 0.2 mm
133
nitrocellulose filters (Millipore HA; 25 mm diameter) and rinsed twice with 5 ml ice-cold 5%
134
trichloroacetic acid (Sigma Chemicals) for 5 min. The filters were dissolved in 1 ml ethylacetate,
135
and after 10 min, 8 ml of scintillation cocktail (Insta-Gel Plus; Canberra Packard) was added. The
136
radioactivity incorporated into cells was counted in a liquid scintillation counter (Model 1212; LKB
137
Wallac). Leucine incorporated into prokaryotic biomass was converted to carbon production using
138
the theoretical conversion factor of 3.1 kg C mol–1 Leu, assuming a two-fold isotope dilution. 139
2.3. Enumeration of viruses
140Water samples for viral enumeration were preserved with glutaraldehyde (0.5% final
141
concentration) at 4°C for 30 min, then flash-frozen in liquid nitrogen and stored at –80°C until
142
analysis. Virus samples were diluted 20-fold in autoclaved and 0.2 m prefiltered TE buffer (10
143
mmol l–1 Tris, 1 mmol l–1 EDTA, pH 8.0) and stained with SYBR Green I (Molecular Probes) (at a 144
-fold dilution of the stock solution) in an 80°C water bath for 10 min before counting. Viruses
145
were detected by their signatures in a side-scatter-versus-green-fluorescence (530 nm wavelength,
146
fluorescence channel 1 of the instrument) plot and counted by flow cytometry (FACSCalibur; BD
147
Biosciences) following the protocol of Brussaard et al. (2010). Data analysis was performed using
148
BD Cell Quest Pro software version 4.0.2 (BD Biosciences). Viral subgroups V1, V2 and V3 were
149
distinguished by increasing fluorescence intensity with settings for the different subgroups that were
150
identical for all analyzed samples. The difference between replicates was typically better than 10%.
151
2.4. Burst size
152To assess in situ burst size (BS; i.e. the number of viruses released upon cell lysis), 50 ml of
153
the prokaryotic concentrates (see below) were preserved in glutaraldehyde (0.5% final
154
concentration), kept briefly at 4°C and then stored at –80°C until analysis. Prokaryotic cells in
155
thawed samples were collected by centrifugation onto formvar-coated transmission electron
156
microscope (TEM) grids (copper, 400 mesh size) and stained with uranyl acetate (Weinbauer &
157
Suttle 1999). Duplicate grids were used for each sample. The minimum BS (BSmin) was estimated
158
as the average from >20 visibly infected cells grid–1. This number is a conservative estimate 159
because viruses could still be assembled in the cells; therefore, a conversion was used to calculate
160
maximum BS (BSmax): BSmax = 1.41 × BSmin + 0.87 (Parada et al. 2006). 161
2.5. VP and infection of prokaryotic plankton
162VP, the fraction of infected cells (FIC) and the fraction of lysogenic cells (FLC) were
163
estimated with a dilution technique (Wilhelm et al. 2002) using a modification described elsewhere
164
(virus-reduction approach [VRA]: Weinbauer et al. 2002, 2010). Large water samples (150–200 l)
165
were filtered through 0.8 mm pore-size polycarbonate filters (142 mm diameter; Millipore) and
166
prokaryotes were concentrated using a Pellicon (Millipore) tangential flow filtration system
167
equipped with a 0.2 m filter cartridge (Durapore; Millipore) as described in (Weinbauer et al.
168
2009b). The first 20 l of the 0.2 m filtrate were processed with a 100 kDa cutoff polysulfone
169
cartridge (Prep-Scale/TFF; Millipore: 0.23 m2 nominal filter area, operated by a peristaltic pump at 170
Pa) to produce free water. Aliquots of the prokaryote concentrate were added to
virus-171
free water to obtain roughly in situ abundance assuming (based on previous findings) that half of
172
the prokaryotes were lost during the prefiltration and ultrafiltration steps. This procedure reduces
173
contact rates between viruses and hosts and thus new infection. Incubations were performed in the
174
dark at in situ temperature (3.0°C) in duplicate 50 ml sterile conical tubes for 24 h. Samples were
175
taken at incubation times (t) 0, 6, 12, 18 and 24 h. VP was calculated as:
176
VP = (VA2 – VA1) / (t2 – t1) (1)
177
where VA1 and VA2 are the viral abundances at incubation times t1 and t2, respectively. Note that 178
individual incubations were treated separately and values at the start of incubations were not always
179
used for calculations. Rather, the lowest viral abundance served as VA1 (Weinbauer et al. 2009b). 180
Thus, VA1 and VA2 are the minimum and maximum of viral abundance in the incubation. VP was 181
corrected for the changes in PA at the start of the experiment compared to in situ abundances.
182
Dividing the number of produced viruses by the BS yields the number of lysed cells and
183
thus gives an estimate of FIC (Weinbauer et al. 2002), which was calculated by:
184
FIC = 100(VA2 – VA1) / BS / PA (2)
185
where PA is the prokaryotic abundance at the start of the experiment (t1). Virus-mediated mortality 186
of prokaryotes (VMMP) was either calculated as:
187
VMMPVP = 100(VP / BS / PHP) (3)
188
or using FIC values and the model of Binder (1999) (VMMPFIC). 189
The FIC treatment also served as a control in the lysogeny bioassays. To induce the lytic
190
cycle in lysogenic cells (containing a prophage), samples were treated with mitomycin C (Sigma
Chemicals; final concentration: 0.5 g ml–1; Paul & Weinbauer 2010). The difference in VA 192
between this treatment and the control is the number of induced viruses, which is divided by the BS
193
to estimate the number of induced cells and thus the FLC. FLC was calculated as percentage by:
194
FLC = 100(VAMC – VAC) / BS / PA (4)
195
where VAMC and VAC are the maximum difference in viral abundance at corresponding time points 196
in mitomycin C and control treatments, respectively. Induced VP (VPi) was calculated analogous to 197
VP after by subtracting VAC from VAMC. 198
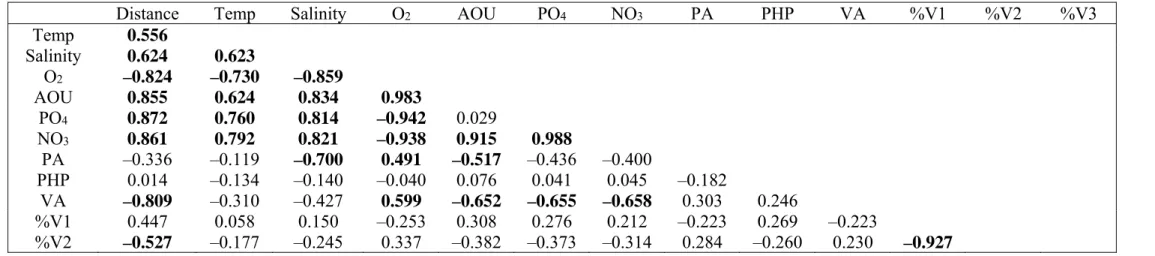
2.6. Statistics
199Spearman rank correlations were used to assess the covariation of parameters, since some
200
variables did not comply with normality even after logarithmic transformation. The non-parametric
201
Kruskal-Wallis and Mann-Whitney tests were used for comparing specific parameters obtained in
202
different water masses, since normality was not always attained; p < 0.05 (after applying a
203
Bonferroni correction) was considered significant. To test a potential change of viral parameters
204
with distance from the GIN Sea, regressions with linear, logarithmic, exponential and power
205
functions were calculated; p < 0.05 was considered significant. Statistics were performed with
206
Aabel_3.
207
3. RESULTS
2083.1. Characterization of water masses
209Some basic physical–chemical characteristics of the main water masses sampled during the
210
study are given in . More details can be found elsewhere (Teira et al. 2006). The LSW,
211
characterized by low salinity, was clearly identifiable at depths between 700 and 2100 m, except
212
between 40 and 45° N. The NADW (2000–3000 m) was identifiable by its salinity maximum
213
(34.90–34.95) south of 60° N. The DSOW underlying the NADW, with seawater temperature
214
between 0.8 and 2.4°C and salinity < 34.90, was detected at all stations between 45 and 65° N. A
215
local moderate oxygen minimum (ca. 30% less than in overlaying and underlaying water) was
216
found between ca. 200 and 700 m depth in the southern part of the transect (from 40–50° N). Data
217
were only used when these water masses could be clearly identified.
218
3.2. VA and PA in different water masses; depth relationships
219The distribution of PA is shown in . PA decreased with depth by ca. an order of
220
magnitude ( ), and this decrease was exponential (Reinthaler et al. 2006). The various
deep-221
water masses exhibited some differences in PA. PA was highest in the SSL (>100 m depth),
intermediate in the oxygen minimum zone and lowest in the bathypelagic water masses. These
223
differences were significant (Kruskal-Wallis and Mann-Whitney tests, p < 0.05; Table 2).
224
VA (Fig. 2) showed a local maximum in the oxygen minimum zone at ca. 54° N, 47° W (ca.
225
500 m water depth) and was slightly higher close to the GIN Sea. VA decreased significantly with
226
depth ( ) and was, on average, highest in the SSL (3.1 ± 1.8 × 10⁹ l–1) and oxygen minimum 227
zone (2.7 ± 2.9 × 10⁹ l–1) and lowest in the NADW (1.2 ± 0.9 × 10⁹ l–1) (Table 2). Significant 228
differences were found between the SSL and the NADW/DSOW (Kruskal-Wallis and
Mann-229
Whitney tests, p < 0.05); however, differences between depth layers were less pronounced than for
230
PA and were a maximum of 3.3-fold. The VPR also showed a local maximum in the oxygen
231
minimum zone at 47.6° W, 53.5°W and was also highest towards the GIN Sea. In addition, VPR
232
increased significantly with depth (Table 3). VPR was lowest in the SSL and highest in the DSOW;
233
VPR was significantly lower in the SSL than in bathypelagic waters (Kruskal-Wallis and
Mann-234
Whitney tests, p < 0.05; Table 2).
235
There was a tendency that %V3 (the viral subgroup with the highest fluorescence) was
236
highest in surface water, whereas %V1 was lower and %V2 was higher in the bathypelagic ocean
237
than in surface water ( , Table 2). A local maximum of %V1 and a local minimum of %V2 and
238
%V3 was found at the oxygen minimum at 47.6° W, 53.5°W. Significant differences between some
239
water masses were found for all 3 viral flow cytometer groups (Kruskal-Wallis and Mann-Whitney
240
tests, p < 0.05; Table 2). Significant differences with depth were only found for %V1 and %V2
241
(Table 3).
242
Co-variation of physico-chemical and biological parameters was assessed across water
243
masses (Table 3). PA and VA increased with temperature and decreased with AOU, PO4 and NO3. 244
There were positive correlations between PA, VA and PHP.
245
3.3. Viral and microbial parameters in the NADW
246In order to assess potential changes of parameters with the formation and ageing of the
247
NADW, the distance of stations from the GIN Sea was calculated as a proxy for the length of the
248
NADW (Fig. 1). Temperature and salinity increased significantly with distance from the GIN Sea.
249
PO4 and NO3 concentrations increased also with distance. Oxygen concentrations decreased 250
significantly with distance, whereas AOU increased ( ). VA and VPR decreased significantly
251
with distance, but in a non-linear way (see also Fig. 3). The %V1 increased (from the 2 stations
252
closest to the GIN Sea) and V2 decreased significantly with distance (Table 4, Fig. 3).
253
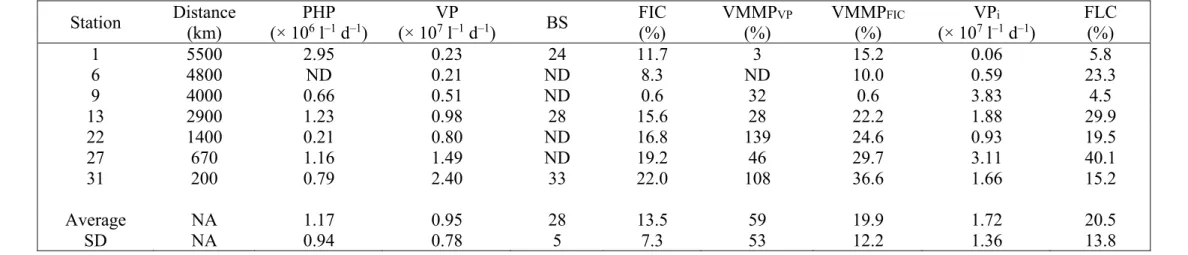
BS was assessed at Stns 1, 13 and 31, averaging 28 ± 5 (range: 24–33 for the 3 samples)
254
after correction to BSmax. For VP measurements, VA in the incubations was reduced by 77 ± 13% 255
compared to in situ VA, whereas PA was 69 ± 16% of in situ abundance. VP averaged 0.95 ± 0.78
256
× 104 viruses l–1 d–1 ( ). FIC averaged 14 ± 7%, mean VMMP
VP was 59 ± 52% and VMMPFIC 257
20 ± 12%. VPi averaged 1.7 ± 1.4 × 10⁷ viruses l–1 d–1, while FLC averaged 21 ± 14%. VP and FIC 258
decreased with distance from the GIN Sea, whereas for VPi and FLC no significant relationship was 259
found ( ).
260
Co-variation of parameters was also assessed within the NADW (Table 4). PA was
261
positively related to oxygen concentration and negatively related to salinity and AOU. VA was
262
negatively related to AOU, PO4 and NO3 concentrations and positively to oxygen. 263
4. DISCUSSION
264The data presented here indicate that different water masses maintain specific viral
265
characteristics during their early lateral flow in the oceanic conveyor belt. Nevertheless, for the
266
NADW, successional changes with distance from the origin could be observed for VA, subgroups,
267
infection and lytic production.
268
4.1. Depth distribution of viruses
269The decrease of VA with depth during early formation of the NADW was much less
270
pronounced than for PA (Fig. 1, Table 2). Similar trends were found for the Atlantic (Parada et al.
271
2007, De Corte et al. 2010, 2012, 2016, Muck et al. 2014, Winter et al. 2018) and the Pacific (Li et
272
al. 2014, Yang et al. 2014). Vertical transport of sinking particles is probably not always
273
responsible for the high VPRs in the dark ocean as previously suggested (Hara et al. 1996), since
274
very high VPRs were found in bathypelagic areas where sinking particle fluxes are generally low
275
(Yang et al. 2014). However, since viruses can enhance aggregate formation and export into the
276
dark ocean (i.e. viral shuttle; Peduzzi & Weinbauer 1993, Sullivan et al. 2017, Yamada et al. 2018,
277
Boeuf et al. 2019), viral lysis can also contribute to the sinking of viruses attached to aggregates.
278
Among the main causes for viral decay in the absence of sunlight are high temperatures,
279
high molecular weight DOM and microscopic (inorganic) particles (Suttle & Chen 1992, Cottrell &
280
Suttle 1995, Noble & Fuhrman 1997). One of the obvious reasons for the high abundances of
281
viruses in bathypelagic waters could be low decay due to low temperatures (Parada et al. 2007).
282
This is supported by the finding that the VPR was lower and water temperature ca. 13°C higher in
283
the bathypelagic zone of the Mediterranean Sea (Magagnini et al. 2007, Winter et al. 2009) than in
284
the Atlantic Ocean.
285
While the low DOM concentrations in the dark ocean (e.g. Arístegui et al. 2009) likely mean
286
reduced decay, large microscopic particles are plentiful (Bochdansky et al. 2010, 2016, Boeuf et al.
2019) and could thus be a significant cause of viral decay. However, since there is evidence that
288
organic particles (marine snow) are viral factories rather than viral traps (Weinbauer et al. 2009a,
289
Bettarel et al. 2016), the particles in the dark ocean could protect viruses against decay and even
290
foster VP. If the emerging notion holds that deep-sea prokaryotes are preferentially
particle-291
attached (e.g. DeLong et al. 2006, Baltar et al. 2009, Swan et al. 2011), these particles might be
292
hotspots of viral infection by increasing contact rates and, hence, abundance (De Corte et al. 2012).
293
It has often been assumed that there is a trade-off for prokaryotes between competition for
294
nutrients and resistance against viral infection (Thingstad 2000, Winter et al. 2010). From a fitness
295
perspective (Thingstad et al. 2014, Thingstad & Våge 2019), one could argue that—as the supply
296
with organic material is low in the deep-sea (Arístegui et al. 2009)—favouring DOM uptake
297
abilities should occur at the expense of defence against viral infection. This should result in higher
298
VP, especially when contact rates remain high in cases where the viruses and microbes are mainly
299
particle-attached (see paragraph above), and thus in a high VPR in the deep-sea.
300
There is no simple relationship between fluorescence intensity and genome size of viruses.
301
However, as viruses do not have their own metabolism, the staining intensity with dyes such as
302
SYBR Green does not vary for specific types of viruses. Therefore, changes in the relative
303
proportion of viral subgroups indicate changes of viral community composition (Brussaard et al.
304
2010). Consequently, the variation of the viral subgroups between depth layers (Table 2) suggests
305
differences in viral community composition. Such differences between viral subgroups have also
306
been found in other studies (De Corte et al. 2010, Muck et al. 2014) and were confirmed by using
307
pulsed-field gel electrophoresis (Parada et al. 2007), randomly amplified polymorphic DNA-PCR 308
(RAPD-PCR; De Corte et al. 2010, Winter & Weinbauer 2010, Muck et al. 2014) and
309
metagenomics (Mizuno et al. 2016, Winter et al. 2018, Gregory et al. 2019, Liang et al. 2019).
310
Using viral subgroups, the strongest differences were found between the SSL and bathypelagic
311
water masses, suggesting that specific viral communities are inhabiting these environments. A
312
likely reason for the differences in viral community composition is differences in host activity and
313
community structure diversity in these water masses as assessed during the same cruise (Teira et al.
314
2004, Reinthaler et al. 2006).
315
4.2. Lysogeny in the NADW
316FLC in the NADW data ranged from 4.5–40.1%, which is similar to another study from the
317
deep ocean using the VRA approach (10.1–27.3%; Muck et al. 2014). Using a whole seawater
318
approach, FLC values were found to be highest in the bathypelagic zone of the Mediterranean Sea
(73.2%; Weinbauer et al. 2003). Using the VRA approach, FLC values from the NADW were
320
higher than FIC values (Fig. 4, Table 5).
321
FLC and lysogenic VP did not vary significantly with distance from the GIN Sea (Fig. 4b,d,
322
Table 5). Also, FLC and lysogenic VP did not vary significantly with PHP (Spearman rank
323
correlation, ρ < 0.65, p > 0.15). In other studies of the Atlantic Ocean, inducible VP did not change
324
(or changed little) with depth from the epipelagic to the abyssopelagic zone, whereas PA, PHP and
325
lytic VP decreased strongly with depth (De Corte et al. 2010, 2012, Muck et al. 2014).
326
Metagenomic data indicate that lysogeny is the predominant life strategy in the deep ocean
327
(Williamson et al. 2008, Mizuno et al. 2016). Thus, these data support the general idea that
328
lysogeny dominates when the encounter rate between phages and host cells is low (Stewart & Levin
329
1984, Weinbauer et al. 2003, Weinbauer 2004). However, in the Malaspina Circumnavigation
330
Experiment, Lara et al. (2017) found that lysogeny dominated in surface water and lytic VP became
331
more important in deep water, hence supporting both hypotheses, i.e. promotion of lysogeny by low
332
growth rates and low nutrient conditions (‘classic’ explanation) and promotion at high host
333
abundance (‘piggyback-the-winner’ model) (Knowles et al. 2016). This indicates that the lytic–
334
lysogenic switch is likely more complex than previously thought, which calls for further studies
335
(Lara et al. 2017). Independent of the lytic–lysogeny switch argument, all studies show that
336
lysogeny is significant in the deep sea. It has been hypothesized that marine prophages directly
337
contribute to host survival in unfavourable environments by suppressing superfluous metabolic
338
activities (Paul 2008), which could be particularly important in the carbon-limited dark ocean.
339
4.3. VA and infection during the formation of the NADW
340VA, VPR, lytic VP and FIC decreased with distance from the GIN sea. Among the factors
341
which could have influenced these parameters during the early formation of the NADW are (1)
342
physical factors (temperature or mixing of the NADW with adjacent water masses), (2) sinking of
343
particles from surface water into the interior of the ocean (export of viruses or stimulation of host
344
activity) and (3) successional (i.e. internal temporal changes such as changes in community
345
composition or resistance).
346
VA decreased in the NADW and temperature increased with distance from its formation
347
(Fig. 3, Table 4). It is possible that the ca. 50 yr transport into warming water resulted in an
348
increased decay and contributed to losses of viruses. The increase in temperature and salinity in the
349
NADW with distance from its formation (Table 4) is caused by mixing with adjacent water masses
350
such as the overlying LSW, which is warmer and lower in salinity than the NADW (van Aken
351
2000a,b). Since VA was higher in the LSW than in the NADW, one would expect VA to increase
with distance in the NADW; however, they decreased, instead indicating that other factors were
353
more important than direct mixing processes. Mixing of deep sea water masses can cause an
354
increase in prokaryotic production and hence VP (Muck et al. 2014) e.g. by induction of lysogens
355
(Winter et al. 2018). Our data set did not allow us to evaluate this possibility for the NADW.
356
General distribution patterns of chlorophyll a (chl a) during the TRANSAT-II cruise suggest
357
a potentially decreasing sinking particle flux and thus a potentially decreasing viral export flux with
358
distance from the GIN Sea (Teira et al. 2004, Reinthaler et al. 2006). If sinking particles are a
359
source of viruses for the dark ocean, such a pattern could contribute to the finding of a decrease in
360
VA and VPR with age of the NADW (but see discussion on transport of viruses on particles in
361
Section 4.1). Release of viruses from sinking particles could for example explain local maxima of
362
viral parameters as detected in this study (Fig. 2). The decrease of VA, VPR, VP and FIC with
363
distance from the GIN Sea was not accompanied by a change in PA and PHP (Table 4). Thus, there
364
is no support for the hypothesis that sinking aggregates (transporting viruses and prokaryotes) or the
365
supply of organic matter into the NADW caused the observed viral (and prokaryotic) patterns with
366
distance from the GIN Sea.
367
Assuming a conservative prokaryotic turnover time of ca. 1 mo in the NADW (Reinthaler et
368
al. 2006) and an investigated time frame for the formation of the NADW of 50 yr, prokaryotes
369
produced ca. 600 generations of offspring. Correlation analysis indicates that (micro)organisms
370
consume oxygen and remineralize PO4 and NO3 during this transport (Table 4). It is possible that 371
prokaryotic community composition changed during these 600 generations. Changes in community
372
composition of hosts can affect the community composition of virioplankton (e.g. Winter et al.
373
2010). Such a mechanism could explain the finding that viral community composition, as indicated
374
by the relative abundance of viral groups, changed significantly with age of the NADW. Since the
375
BS of viruses is quite variable (Børsheim 1993), changes in the community composition to virus–
376
host systems with lower BSs could contribute to the decrease of VA and VPR with distance from
377
the GIN Sea. The few data on BS support this idea (Table 5).
378
In a 2 yr pressure incubation (corresponding to pressure at 3000 m water depth) with various
379
phage isolates and a natural virus community, it was found that small and low fluorescence viruses
380
decayed slower than larger or high fluorescence viruses (Tian et al 2020). The finding that the
381
proportion of the V1 group (low fluorescence) became more important with distance from the GIN
382
Sea compared to V2 and V3 groups (higher fluorescence) (Fig. 3b,c) could therefore be explained
383
by lower decay rates. Thus, variable decay rates between different types of viruses could change the
384
virus community and hence infection patterns.
Resistance against infection is a well known phenomenon from studies with isolates (Avrani
386
et al. 2012). Among the more recently detected resistance mechanisms is CRISPR (Barrangou et al.
387
2007). CRISPR is a sort of immune system for prokaryotes in the sense that it confers resistance to
388
bacterial and archaea cells against mobile genetic elements such as viruses (e.g. Barrangou et al.
389
2007, Vestergaard et al. 2008). Exposure of prokaryotes to viruses for 600 generations and
390
development of resistance is therefore another possible cause for the decrease of VA and lytic
391
infection with ageing NADW. If the resistance hypothesis holds, viral types belonging to the V2
392
group would be the loser in the arms-race with prokaryotic hosts compared to type V1, which
393
decrease in relative abundance with distance from the GIN Sea.
394
Applying the reasoning of a fitness penalty in a low-nutrient environment (see Section 4.1),
395
it can be argued that the fitness costs of resistance should increase with distance from the GIN Sea,
396
i.e. with the ageing of NADW. Hence, a strategy towards competitive traits with high susceptibility
397
to viral infection could be anticipated. However, there is no evidence that viral infection or VPR
398
increased; on the contrary, these parameters decreased with distance from the GIN Sea. Overall,
399
VPR was very high at the origin of the GIN Sea, and despite the decline with ageing of the NADW
400
it remained higher than in surface water. It is possible that the high VPR values in origin water
401
masked fitness-related trends. In this context, it is important to mention that temperature increased
402
in the NADW with distance from the GIN Sea. Alternatively, the origin water could have been
403
already characterized by conditions favouring competitive over defence traits.
404
4.4. VP, mortality and carbon release in the NADW
405Lytic VP ranged from 2.2–2.5 × 10⁷ l–1 d–1. These values are slightly lower than the lytic VP 406
estimated in other bathy- and abyssopelagic environments (3.6 × 17– 8.4 × 10⁹ l–1 d–1 (De Corte et 407
al. 2010 2012, Umani et al. 2010, Li et al. 2014, Muck et al. 2016, Lara et al. 2017, Winter et al.
408
2018). The FIC (0.6–22.0%) was at the lower range compared to other studies (15–143%; Muck et
409
al. 2014, Winter et al. 2018).
410
Using 2 different methods for estimating the role of viral lysis for prokaryotic mortality,
411
estimates based on VMMPVP were on average 2.7 higher than estimates based on VMMPFIC (Table 412
5). It is a well known but poorly understood phenomenon that different methods for estimating
413
VMMP are not always fully congruent (Winter et al. 2004, Helton et al. 2005, Winget et al. 2005,
414
Weinbauer et al. 2009b). Nevertheless, data from both methods suggest significant mortality due to
415
viral lysis in the NADW (on average 20% by VMMPFIC and 59% by VMMPVP, respectively). 416
Finally, viruses have been detected within cells (Weinbauer et al. 2003, this study). This finding
417
supports that of Li et al. (2014) that there is an autochthonous active virus community in the deep
sea. Also, endemic deep-sea virus communities have been documented by metagenomics (Winter et
419
al. 2014, 2018, Mizuno et al. 2016, Gregory et al. 2019, Liang et al. 2019).
420
Using a conversion factor of 12.4 fg cell–1 for the dark ocean (Fukuda et al. 1998) and data 421
from Table 5, the carbon release by viral lysis of prokaryotes would be 8.6 ± 5.5 ng C l–1 d–1 using 422
VMMPVP and 2.9 ± 1.4 ng C l–1 d–1 using VMMPFIC. This is lower than the 0.03–0.69 g C l–1 d–1 423
estimated by Li et al. (2014). The majority of DOM in the deep sea is characterized by low turnover
424
times and is either too recalcitrant or too diluted to be used by prokaryotes (Jiao et al. 2011, Arrieta
425
et al. 2015). Viral lysis products consist of cell contents and wall cell debris such as DNA, RNA,
426
carbohydrates, amino acids, glucosamine and diaminopimelic acid (Weinbauer et al. 1993,
427
Weinbauer & Peduzzi 1995, Middelboe & Jorgensen 2006) and are rapidly degraded, hence
428
belonging to the pool of labile DOM (Noble & Fuhrman 1999, Middelboe & Lyck 2002). This may
429
relieve the carbon limitation of the growth of deep-sea prokaryotes. Also, organic matter from cells
430
shunted into the DOM pool by viral lysis is hardly accessible to higher trophic levels, thus resulting
431
in a slower transfer of organic matter towards higher trophic levels (Fuhrman 1999). This process
432
could sustain a high prokaryotic biomass and provide an important contribution to prokaryotic
433
metabolism, allowing the system to cope with the severe organic resource limitation of deep-sea
434
ecosystems as has been demonstrated for benthic and pelagic communities (Danovaro et al. 2008,
435
Lara et al. 2017). Moreover, viral lysis may prime the biological pump and the microbial carbon
436
pump and hence carbon sequestration in the ocean, which has significant global consequences
437
(Suttle 2007, Brussaard et al. 2008, Jiao et al. 2011, Guidi et al. 2016).
438
Acknowledgements. We thank the captain and crew of the R/V ‘Pelagia’ for their support at sea, and 439
K. Bakker, J. Hegeman, S. Gonzalez and A. Smit for help during sample processing. The comments
440
of 2 reviewers improved a former version of the manuscript. This work was supported by a grant of
441
the Dutch Science Foundation Earth and Life Sciences (NWO-ALW, project # 811.33.004) to G.J.H
442
and the French Science Ministry (ANR grant AQUAPHAGE) to M.G.H.
443
LITERATURE CITED
444<jrn>Agogué H, Lamy D, Neal PR, Sogin ML, Herndl GJ (2011) Water mass‐specificity of
445
bacterial communities in the North Atlantic revealed by massively parallel sequencing. Mol
446
Ecol 20:258–274 PubMeddoi:10.1111/j.1365-294X.2010.04932.x</jrn>
447
<jrn>Arístegui J, Gasol JM, Duarte CM, Herndl GJ (2009) Microbial oceanography of the dark
448
ocean’s pelagic realm. Limnol Oceanogr 54:1501–1529 doi:10.4319/lo.2009.54.5.1501</jrn>
<jrn>Arrieta JM, Mayol E, Hansman RL, Herndl GJ, Dittmar T, Duarte CM (2015) Dilution limits
450
dissolved organic carbon utilization in the deep ocean. Science 348:331–333 PubMed 451
doi:10.1126/science.1258955</jrn>
452
<jrn>Avrani S, Schwartz DA, Lindell D (2012) Virus-host swinging party in the oceans:
453
incorporating biological complexity into paradigms of antagonistic coexistence. Mob Genet
454
Elements 2:88–95 PubMeddoi:10.4161/mge.20031</jrn>
455
<jrn>Baltar F, Arístegui J, Gasol JM, Sintes E, Herndl GJ (2009) Evidence of prokaryotic
456
metabolism on suspended particulate organic matter in the dark waters of the subtropical North
457
Atlantic. Limnol Oceanogr 54:182–193 doi:10.4319/lo.2009.54.1.0182</jrn>
458
<jrn>Barrangou R, Fremaux C, Deveau H, Richards M and others (2007) CRISPR provides
459
acquired resistance against viruses in prokaryotes. Science 315:1709–1712 PubMed 460
doi:10.1126/science.1138140</jrn>
461
<jrn>Bettarel Y, Motegi C, Weinbauer MG, Mari X (2016) Colonization and release processes of
462
viruses and prokaryotes on artificial marine macroaggregates. FEMS Microbiol Lett 363:fnv216
463
PubMeddoi:10.1093/femsle/fnv216</jrn>
464
<jrn>Binder B (1999) Reconsidering the relationship between virally induced bacterial mortality
465
and frequency of infected cells. Aquat Microb Ecol 18:207–215 doi:10.3354/ame018207</jrn>
466
<jrn>Bochdansky AB, van Aken HM, Herndl GJ (2010) Role of macroscopic particles in deep-sea
467
oxygen consumption. Proc Natl Acad Sci USA 107:8287–8291 PubMed 468
doi:10.1073/pnas.0913744107</jrn>
469
<jrn>Bochdansky AB, Clouse MA, Herndl GJ (2016) Dragon kings of the deep sea: Marine
470
particles deviate markedly from the common number-size spectrum. Sci Rep 6:22633 PubMed 471
doi:10.1038/srep22633</jrn>
472
<jrn>Boeuf D, Edwards BR, Eppley JM, Hu SK and others (2019) Biological composition and
473
microbial dynamics of sinking particulate organic matter at abyssal depths in the oligotrophic
474
open ocean. Proc Natl Acad Sci USA 116:11824–11832 PubMed</jrn>
475
<jrn>Bohannan BJM, Lenski RE (1997) Effect of resource enrichment on a chemostat community
476
of bacteria and bacteriophage. Ecology 78:2303–2315 doi:10.1890/0012-477
9658(1997)078[2303:EOREOA]2.0.CO;2</jrn>
478
<jrn>Børsheim KY (1993) Native marine bacteriophages. FEMS Microbiol Ecol 102:141–159
479
doi:10.1016/0378-1097(93)90197-A</jrn>
<jrn>Broecker WS (1997) Thermohaline circulation, the Achilles heel of our climate system: Will
481
man-made CO2 upset the current balance? Science 278:1582–1588 PubMed 482
doi:10.1126/science.278.5343.1582</jrn>
483
<jrn>Brussaard CPD, Wilhelm SW, Thingstad F, Weinbauer MG and others (2008) Global-scale
484
processes with a nanoscale drive: the role of marine viruses. ISME J 2:575–578 PubMed 485
doi:10.1038/ismej.2008.31</jrn>
486
<edb>Brussaard CPD, Payet JP, Winter C, Weinbauer MG (2010) Quantification of aquatic viruses
487
by flow cytometry. In: Wilhelm SW, Weinbauer MG, Suttle C (eds) Manual of aquatic viral
488
ecology. American Society of Limnology and Oceanography, Waco, TX, p 102–109</edb>
489
<jrn>Cottrell MT, Suttle CA (1995) Dynamics of a lytic virus infecting the photosynthetic marine
490
picoflagellate Micromonas pusilla. Limnol Oceanogr 40:730–739
491
doi:10.4319/lo.1995.40.4.0730</jrn>
492
<jrn>Danovaro R, Dell’Anno A, Corinaldesi C, Magagnini M, Noble R, Tamburin C, Weinbauer
493
MG (2008) Major viral impact on the functioning of benthic deep-sea ecosystems. Nature
494
454:1084–1087 PubMeddoi:10.1038/nature07268</jrn>
495
<jrn>De Corte D, Sintes E, Winter C, Yokokawa T, Reinthaler T, Herndl GJ (2010) Links between
496
viral and prokaryotic communities throughout the water column in the (sub)tropical Atlantic
497
Ocean. ISME J 4:1431–1442 PubMeddoi:10.1038/ismej.2010.65</jrn>
498
<jrn>De Corte D, Sintes E, Yokokawa T, Reinthaler T, Herndl GJ (2012) Links between viruses
499
and prokaryotes throughout the water column along a North Atlantic latitudinal transect. ISME J
500
6:1566–1577 PubMeddoi:10.1038/ismej.2011.214</jrn>
501
<jrn>De Corte D, Sintes E, Yokokawa T, Lekunberri I, Herndl GJ (2016) Large-scale distribution
502
of microbial and viral populations in the South Atlantic Ocean. Environ Microbiol Rep 8:305–
503
315 PubMeddoi:10.1111/1758-2229.12381</jrn>
504
<jrn>DeLong EF, Preston CM, Mincer T, Rich V and others (2006) Community genomics among
505
stratified microbial assemblages in the ocean’s interior. Science 311:496–503 PubMed 506
doi:10.1126/science.1120250</jrn>
507
<jrn>Fuhrman JA (1999) Marine viruses and their biogeochemical and ecological effects. Nature
508
399:541–548 PubMeddoi:10.1038/21119</jrn>
509
<jrn>Fukuda R, Ogawa H, Nagata T, Koike I (1998) Direct determination of carbon and nitrogen
510
contents of natural bacterial assemblages in marine environments. Appl Environ Microbiol
511
64:3352–3358 PubMeddoi:10.1128/AEM.64.9.3352-3358.1998</jrn>
<jrn>Gobler CJ, Hutchins DA, Fisher NS, Cosper EM, Sañudo-Wilhelmy SA (1997) Release and
513
bioavailability of C, N, P, Se and Fe following viral lysis of a marine chrysophyte. Limnol
514
Oceanogr 42:1492–1504 doi:10.4319/lo.1997.42.7.1492</jrn>
515
<jrn>Gregory AC, Zayed AA, Conceicao-Neto N, Temperton B and others (2019) Marine DNA
516
viral macro- and microdiversity from pole to pole. Cell 177:1109–1123 PubMed 517
doi:10.1016/j.cell.2019.03.040</jrn>
518
<jrn>Guidi L, Chaffron S, Bittner L, Eveillard D and others (2016) Plankton networks driving
519
carbon export in the oligotrophic ocean. Nature 532:465–470 PubMed 520
doi:10.1038/nature16942</jrn>
521
<jrn>Hara S, Koike I, Terauchi K, Kamiya H, Tanoue E (1996) Abundance of viruses in deep
522
oceanic waters. Mar Ecol Prog Ser 145:269–277 doi:10.3354/meps145269</jrn>
523
<jrn>Helton RR, Cottrell MT, Kirchman DL, Wommack KE (2005) Evaluation of incubation-based
524
methods for estimating virioplankton production in estuaries. Aquat Microb Ecol 41:209–219
525
doi:10.3354/ame041209</jrn>
526
<jrn>Jiao N, Herndl GJ, Hansell DA, Benner R and others (2011) The microbial carbon pump and
527
the oceanic recalcitrant dissolved organic matter pool. Nat Rev Microbiol 9:555
528
doi:10.1038/nrmicro2386-c5</jrn>
529
<jrn>Knowles B, Silveira CB, Bailey BA, Barott K and others (2016) Lytic to temperate switching
530
of viral communities. Nature 531:466–470 PubMeddoi:10.1038/nature17193</jrn>
531
<jrn>Lara E, Vaqué D, Sà EL, Boras JA and others (2017) Unveiling the role and life strategies of
532
viruses from the surface to the dark ocean. Sci Adv 3:e1602565 PubMed 533
doi:10.1126/sciadv.1602565</jrn>
534
<jrn>Li Y, Luo T, Sun J, Cai L, Liang Y, Jiao N, Zhang R (2014) Lytic viral infection of
535
bacterioplankton in deep waters of the Western Pacific Ocean. Biogeosciences 11:2531–2542
536
doi:10.5194/bg-11-2531-2014</jrn>
537
<jrn>Liang Y, Wang L, Wang Z, Zhao J and others (2019) Metagenomic analysis of the diversity of
538
DNA viruses in the surface and deep sea of the South China Sea. Front Microbiol 10:1951
539
PubMeddoi:10.3389/fmicb.2019.01951</jrn>
540
<jrn>Middelboe M, Jorgensen NOG (2006) Viral lysis of bacteria: an important source of dissolved
541
amino acids and cell wall compounds. J Mar Biol Assoc UK 86:605–612
542
doi:10.1017/S0025315406013518</jrn>
<jrn>Middelboe M, Lyck PG (2002) Regeneration of dissolved organic matter by viral lysis in
544
marine microbial communities. Aquat Microb Ecol 27:187–194 doi:10.3354/ame027187</jrn>
545
<jrn>Mizuno CM, Ghai R, Saghai A, Lopez-Garcia P, Rodriguez-Valera F (2016) Genomes of
546
abundant and widespread viruses from the deep ocean. MBio 7:e00805-16 PubMed 547
doi:10.1128/mBio.00805-16</jrn>
548
<jrn>Muck S, Griessler T, Köstner N, Klimiuk A, Winter C, Herndl GJ (2014) Fracture zones in the
549
Mid Atlantic Ridge lead to alterations in prokaryotic and viral parameters in deep-water masses.
550
Front Microbiol 5:264 PubMeddoi:10.3389/fmicb.2014.00264</jrn>
551
<jrn>Murray AG, Jackson GA (1992) Viral dynamics: a model of the effects of size, shape, motion
552
and abundance of single-celled planktonic organisms and other particles. Mar Ecol Prog Ser
553
89:103–116 doi:10.3354/meps089103</jrn>
554
<jrn>Nagata T, Fukuda H, Fukuda R, Koike I (2000) Bacterioplankton distribution and production
555
in deep Pacific waters: large-scale geographic variations and possible coupling with sinking
556
particle fluxes. Limnol Oceanogr 45:426–435 doi:10.4319/lo.2000.45.2.0426</jrn>
557
<jrn>Noble RT, Fuhrman JA (1997) Virus decay and its causes in coastal waters. Appl Environ
558
Microbiol 63:77–83 PubMeddoi:10.1128/AEM.63.1.77-83.1997</jrn>
559
<jrn>Noble RT, Fuhrman JA (1999) Breakdown and microbial uptake of marine viruses and other
560
lysis products. Aquat Microb Ecol 20:1–11 doi:10.3354/ame020001</jrn>
561
<jrn>Parada V, Herndl GJ, Weinbauer MG (2006) Viral burst size of heterotrophic prokaryotes in
562
aquatic systems. J Mar Biol Assoc UK 86:613–621 doi:10.1017/S002531540601352X</jrn>
563
<jrn>Parada V, Sintes E, van Aken HM, Weinbauer MG, Herndl GJ (2007) Viral abundance, decay
564
and diversity in the meso- and bathypelagic waters of the North Atlantic. Appl Environ
565
Microbiol 73:4429–4438 PubMeddoi:10.1128/AEM.00029-07</jrn>
566
<jrn>Paul JH (2008) Prophages in marine bacteria: Dangerous molecular time bombes or key to the
567
survival in the seas? ISME J 2:579–589 PubMeddoi:10.1038/ismej.2008.35</jrn>
568
<edb>Paul JH, Weinbauer MG (2010) Detection of lysogeny in marine environments. In: Wilhelm
569
SW, Weinbauer MG, Suttle C (eds) Manual of aquatic viral ecology. American Society of 570
Limnology and Oceanography, Waco, TX, p 30–33</edb>
571
<jrn>Peduzzi P, Weinbauer MG (1993) Effect of concentrating the virus-rich 2-200 nm size
572
fraction of seawater on the formation of algal flocs (marine snow). Limnol Oceanogr 38:1562–
573
1565 doi:10.4319/lo.1993.38.7.1562</jrn>
<jrn>Reinthaler T, van Aken H, Veth C, Arístegui J, Robinson C, Williams PJL (2006) Prokaryotic
575
respiration and production in the meso-and bathypelagic realm of the eastern and western North
576
Atlantic basin. Limnol Oceanogr 51:1262–1273 doi:10.4319/lo.2006.51.3.1262</jrn>
577
<jrn>Steward GF, Smith DC, Azam F (1996) Abundance and production of bacteria and viruses in
578
the Bering and Chukchi Seas. Mar Ecol Prog Ser 131:287–300 doi:10.3354/meps131287</jrn>
579
<jrn>Stewart FM, Levin BR (1984) The population biology of bacterial viruses: why be temperate.
580
Theor Popul Biol 26:93–117 PubMeddoi:10.1016/0040-5809(84)90026-1</jrn>
581
<jrn>Sullivan MB, Weitz JS, Wilhelm S (2017) Viral ecology comes of age. Environ Microbiol
582
Rep 9:33–35 PubMeddoi:10.1111/1758-2229.12504</jrn>
583
<jrn>Suttle CA (2007) Marine viruses—major players in the global ecosystem. Nat Rev Microbiol
584
5:801–812 PubMeddoi:10.1038/nrmicro1750</jrn>
585
<jrn>Suttle CA, Chen F (1992) Mechanisms and rates of decay of marine viruses in seawater. Appl
586
Environ Microbiol 58:3721–3729 PubMeddoi:10.1128/AEM.58.11.3721-3729.1992</jrn>
587
<jrn>Swan BK, Martinez-Garcia M, Preston CM, Sczyrba A and others (2011) Potential for
588
chemolithoautotrophy among ubiquitous bacteria lineages in the dark ocean. Science 333:1296–
589
1300 PubMeddoi:10.1126/science.1203690</jrn>
590
<jrn>Teira E, Reinthaler T, Pernthaler A, Pernthaler J, Herndl GJ (2004) Combining catalyzed
591
reporter deposition-fluorescence in situ hybridization and microautoradiography to detect
592
substrate utilization by Bacteria and Archaea in the deep ocean. Appl Environ Microbiol
593
70:4411–4414 PubMeddoi:10.1128/AEM.70.7.4411-4414.2004</jrn>
594
<jrn>Teira E, Lebaron P, van Aken H, Herndl GJ (2006) Distribution and activity of Bacteria and
595
Archaea in the deep water masses of the North Atlantic. Limnol Oceanogr 51:2131–2144
596
doi:10.4319/lo.2006.51.5.2131</jrn>
597
<jrn>Thingstad TF, Våge S (2019) Host-virus-predator coexistence in a grey-box model with
598
dynamic optimization of host fitness. ISME J 13:3102–3111 PubMed doi:10.1038/s41396-019-599
0496-7</jrn>
600
<jrn>Thingstad TF, Våge S, Storesund JE, Sandaa RA, Giske J (2014) A theoretical analysis of
601
how strain-specific viruses can control microbial species diversity. Proc Natl Acad Sci USA
602
111:7813–7818 PubMeddoi:10.1073/pnas.1400909111</jrn>
603
Tian Y, Cai L, Xu Y, Luo T and others (2020) Stability and infectivity of
604allochthonous viruses in deep sea: A long-term high pressure simulation
605experiment.
606Deep Sea Res Part I: 103302 (in press) doi:10.1016/j.dsr.2020.103302
607<jrn>Umani SF, Malisana E, Focaracci F, Magagnini M, Corinaldesi C, Danovaro R (2010)
608
Disentangling the effect of viruses and nanoflagellates on prokaryotes in bathypelagic waters of
609
the Mediterranean Sea. Mar Ecol Prog Ser 418:73–85 doi:10.3354/meps08803</jrn>
610
<jrn>Våge S, Bratbak G, Egge J, Heldal M and others (2018) Simple models combining
611
competition, defence and resource availability have broad implications in pelagic microbial food
612
webs. Ecol Lett 21:1440–1452 PubMeddoi:10.1111/ele.13122</jrn>
613
<jrn>van Aken HM (2000a) The hydrography of the mid-latitude Northeast Atlantic Ocean. I: the
614
deep water masses. Deep Sea Res I 47:757–788 doi:10.1016/S0967-0637(99)00092-8</jrn>
615
<jrn>van Aken HM (2000b) The hydrography of the mid-latitude Northeast Atlantic Ocean. II: the
616
intermediate water masses. Deep Sea Res I 47:789–824 doi:10.1016/S0967-0637(99)00112-617
0</jrn>
618
<jrn>Vestergaard G, Shah SA, Bize A, Reitberger W and others (2008) Stygiolobus rod-shaped
619
virus and the interplay of crenarchaeal rudiviruses with the CRISPR antiviral system. J Bacteriol
620
190:6837–6845 PubMeddoi:10.1128/JB.00795-08</jrn>
621
<jrn>Weinbauer MG (2004) Ecology of prokaryotic viruses. FEMS Microbiol Rev 28:127–181
622
PubMeddoi:10.1016/j.femsre.2003.08.001</jrn>
623
<jrn>Weinbauer MG, Peduzzi P (1995) Effect of virus-rich high molecular weight concentrates of
624
seawater on the dynamics of dissolved amino acids and carbohydrates. Mar Ecol Prog Ser
625
127:245–253 doi:10.3354/meps127245</jrn>
626
<jrn>Weinbauer MG, Suttle CA (1999) Lysogeny and prophage induction in coastal and offshore
627
bacterial communities. Aquat Microb Ecol 18:217–225 doi:10.3354/ame018217</jrn>
628
<jrn>Weinbauer MG, Fuks D, Peduzzi P (1993) Distribution of viruses and dissolved DNA along a
629
coastal trophic gradient in the northern Adriatic Sea. Appl Environ Microbiol 59:4074–4082
630
PubMeddoi:10.1128/AEM.59.12.4074-4082.1993</jrn>
631
<jrn>Weinbauer MG, Winter C, Höfle MG (2002) Reconsidering transmission electron microscopy
632
based estimates of viral infection of bacterioplankton using conversion factors derived from
633
natural communities. Aquat Microb Ecol 27:103–110 doi:10.3354/ame027103</jrn>
634
<jrn>Weinbauer MG, Brettar I, Höfle MG (2003) Lysogeny and virus-induced mortality of
635
bacterioplankton in surface, deep, and anoxic waters. Limnol Oceanogr 48:1457–1465
636
doi:10.4319/lo.2003.48.4.1457</jrn>
<jrn>Weinbauer MG, Bettarel Y, Cattaneo R, Luef B and others (2009a) Viral ecology of organic
638
and inorganic particles in aquatic systems: avenues for further research. Aquat Microb Ecol
639
57:321–341 PubMeddoi:10.3354/ame01363</jrn>
640
<jrn>Weinbauer MG, Arrieta JM, Griebler C, Herndl GJ (2009b) Enhanced viral production and
641
infection of bacterioplankton during an iron-induced phytoplankton bloom in the Southern
642
Ocean. Limnol Oceanogr 54:774–784 doi:10.4319/lo.2009.54.3.0774</jrn>
643
<edb>Weinbauer MG, Rowe JM, Wilhelm SW (2010) Determining rates of virus production in
644
aquatic systems by the virus reduction approach. In: Wilhelm SW, Weinbauer MG, Suttle C
645
(eds) Manual of aquatic viral ecology. American Society of Limnology and Oceanography, 646
Waco, TX, p 1–8</edb>
647
<jrn>Wilhelm SW, Suttle CA (1999) Viruses and nutrient cycles in the sea. BioScience 49:781–788
648
doi:10.2307/1313569</jrn>
649
<jrn>Wilhelm SW, Brigden SM, Suttle CA (2002) A dilution technique for the direct measurement
650
of viral production: a comparison in stratified and tidally mixed coastal waters. Microb Ecol
651
43:168–173 PubMeddoi:10.1007/s00248-001-1021-9</jrn>
652
<edb>Williams ST (1994) Bacteriophages in soils. In: Webster RG, Granoff A (eds) Encyclopedia
653
of virology. Academic Press, London, p 121–126</edb>
654
<jrn>Williamson SJ, Cary SC, Williamson KE, Helton RR, Bench SR, Winget D, Wommack KE
655
(2008) Lysogenic virus-host interactions predominate at deep-sea diffuse-flow hydrothermal
656
vents. ISME J 2:1112–1121 PubMeddoi:10.1038/ismej.2008.73</jrn>
657
<jrn>Winget DM, Williamson KE, Helton RR, Wommack KE (2005) Tangential flow diafiltration:
658
an improved technique for estimation of virioplankton production. Aquat Microb Ecol 41:221–
659
232 doi:10.3354/ame041221</jrn>
660
<jrn>Winter C, Herndl GJ, Weinbauer MG (2004) Diel cycles in viral infection of bacterioplankton
661
in the North Sea. Aquat Microb Ecol 35:207–216 doi:10.3354/ame035207</jrn>
662
<jrn>Winter C, Kerros ME, Weinbauer MG (2009) Seasonal and depth-related dynamics of
663
prokaryotes and viruses in surface and deep waters of the northwestern Mediterranean Sea.
664
Deep Sea Res I 56:1972–1982 doi:10.1016/j.dsr.2009.07.003</jrn>
665
<jrn>Winter C, Bouvier T, Weinbauer MG, Thingstad TF (2010) Trade-offs between competition
666
and defense specialists in unicellular planktonic organisms – the ‘killing the winner’ hypothesis
667
revisited. Microbiol Mol Biol Rev 74:42–57 PubMeddoi:10.1128/MMBR.00034-09</jrn>
<jrn>Winter C, Köstner N, Kruspe CP, Urban D, Muck S, Reinthaler T, Herndl GJ (2018) Mixing
669
alters the lytic activity of viruses in the dark ocean. Ecology 99:700–713 PubMed 670
doi:10.1002/ecy.2135</jrn>
671
<jrn>Wommack KE, Colwell RR (2000) Virioplankton: viruses in aquatic ecosystems. Microbiol
672
Mol Biol Rev 64:69–114 PubMeddoi:10.1128/MMBR.64.1.69-114.2000</jrn>
673
<jrn>Yamada Y, Tomaru Y, Fukuda H, Nagata T (2018) Aggregate formation during the viral lysis
674
of a marine diatom. Front Mar Sci 5:167 doi:10.3389/fmars.2018.00167</jrn>
675
<jrn>Yang Y, Yokokawa T, Motegi C, Nagata T (2014) Large-scale distribution of viruses in deep
676
waters of the Pacific and Southern Oceans. Aquat Microb Ecol 71:193–202
677
doi:10.3354/ame01677</jrn>
678
<jrn>Zimmerman AE, Howard-Varona C, Needham DM, John SG and others (2020) Metabolic and
679
biogeochemical consequences of viral infection in aquatic ecosystems. Nat Rev Microbiol 680
18:21–34 PubMed</jrn>
Table 1. Averaged water layer properties of selected physico-chemical parameters in the western North Atlantic basin. T: temperature; στ: water 682
density. SSL: subsurface layer; O2-min: oxygen minimum zone; LSW: Labrador Sea Water; NADW: North Atlantic Deep Water; DSOW: Denmark 683
Strait Overflow Water. Values in parentheses: SD 684
Water mass samples No. of Depth (m) Depth range (m) (°C) T (kg mστ –3) (mol kgOxygen –1)
SSL 33 100 90–110 8.7 (4.74) 27.20 (0.489) 260 (38.4) O2-min 15 402 180–740 7.9 (2.39) 27.32 (0.194) 187 (51.2) LSW 32 1324 710–2090 3.4 (0.32) 27.77 (0.031) 279 (7.3) NADW 23 2537 1980–3250 3.0 (0.19) 27.84 (0.014) 272 (6.5) DSOW 22 3031 1220–3870 1.9 (0.42) 27.91 (0.24) 288 (12.7) 685
Table. 2. Prokaryotic and viral parameters in the western North Atlantic basin. PA: prokaryotic abundance; VA: viral abundance; V1: viral subgroup 1; 686
V2: viral subgroup 2; V3: viral subgroup 3; VPR: virus-to-prokaryote ratio. SSL: subsurface layer; O2-min: oxygen minimum zone; LSW: Labrador 687
Sea Water; NADW: North Atlantic Deep Water; DSOW: Denmark Strait Overflow Water. PHP and PA data are from Reinthaler et al. (2006). 688
Numbers in parentheses: SD; letters in parentheses: Mann-Whitney tests of pairs of water masses (levels not connected by same letter are significantly 689
different [p < 0.05]). 690
Water mass samples No. of (× 108PA cells l–1) (× 109 particles lVA –1) (%) V1 (%) V2 (%) V3 VPR SSL 33 3.58 (0.94) (A) 3.1 (1.8) (A) 73.1 (4.0) (A) 20.3 (4.1) (A) 6.5 (1.5) (A) 9.8 (5.6) (A) O2-min 15 1.27 (0.49) (B) 2.7 (2.9) (A,B) 78.3 (9.1) (A,B) 17.2 (7.8) (A) 4.5 (1.6) (B) 27.0 (38.9) (A) LSW 32 0.50 (0.17) (C) 1.5 (0.8) (A,B) 66.3 (7.3) (B,C) 28.8 (7.5) (A) 4.8 (1.7) (B) 32.4 (21.3) (A) NADW 25 0.30 (0.06) (C) 1.2 (0.9) (B) 69.0 (5.8) (B,C) 26.4 (5.1) (B) 4.6 (2.0) (B) 40.8 (26.5) (A,B) DSOW 22 0.43 (0.26) (C) 2.3 (2.1) (B) 69.2 (8.1) (C) 26.1 (7.3) (B) 4.6 (1.7) (B) 42.9 (18.2) (B) Kruskal-Wallis (p-value) <0.0001 <0.0001 <0.0001 <0.0001 <0.0001 <0.0001 691