HAL Id: hal-00299212
https://hal.archives-ouvertes.fr/hal-00299212
Submitted on 1 Nov 2004
HAL is a multi-disciplinary open access
archive for the deposit and dissemination of
sci-entific research documents, whether they are
pub-lished or not. The documents may come from
teaching and research institutions in France or
abroad, or from public or private research centers.
L’archive ouverte pluridisciplinaire HAL, est
destinée au dépôt et à la diffusion de documents
scientifiques de niveau recherche, publiés ou non,
émanant des établissements d’enseignement et de
recherche français ou étrangers, des laboratoires
publics ou privés.
Analysis of the ULF electromagnetic emission related to
seismic activity, Teoloyucan geomagnetic station,
1998-2001
A. Kotsarenko, R. Pérez Enríquez, J. A. López Cruz-Abeyro, S. Koshevaya, V.
Grimalsky, F. R. Zúñiga
To cite this version:
A. Kotsarenko, R. Pérez Enríquez, J. A. López Cruz-Abeyro, S. Koshevaya, V. Grimalsky, et al..
Analysis of the ULF electromagnetic emission related to seismic activity, Teoloyucan geomagnetic
station, 1998-2001. Natural Hazards and Earth System Science, Copernicus Publications on behalf of
the European Geosciences Union, 2004, 4 (5/6), pp.679-684. �hal-00299212�
Natural Hazards and Earth System Sciences (2004) 4: 679–684 SRef-ID: 1684-9981/nhess/2004-4-679
© European Geosciences Union 2004
Natural Hazards
and Earth
System Sciences
Analysis of the ULF electromagnetic emission related to seismic
activity, Teoloyucan geomagnetic station, 1998–2001
A. Kotsarenko1, R. P´erez Enr´ıquez1, J. A. L´opez Cruz-Abeyro1, S. Koshevaya2, V. Grimalsky3, and F. R. Z ´u ˜niga1
1Centro de Geociencias, Juriquilla, UNAM, Apdo Postal 1-742, Centro Queretaro, Quer´etaro, Mexico, C.P. 76001, Mexico 2UAEM, Cuernavaca, Morelos, Mexico
3INAOE, Tonantzintla, Puebla, Mexico
Received: 30 April 2004 – Revised: 27 October 2004 – Accepted: 28 October 2004 – Published: 1 November 2004 Part of Special Issue “Precursory phenomena, seismic hazard evaluation and seismo-tectonic electromagnetic effects”
Abstract. Results of ULF geomagnetic measurements at station Teoloyucan (Central Mexico, 99.11035.73500W,
19.44045.10000N, 2280 m height) in relation to seismic ac-tivity in the period 1998–2001 and their analysis are pre-sented. Variations of spectral densities for horizontal and vertical components, polarization densities and spectrograms of magnetic field, their derivatives are analyzed as a part of traditional analysis in this study. Values of spectral density were calculated for 6 fixed frequencies f =1, 3, 10, 30, 100 and 300 mHz. Fractal characteristics of spectra were ana-lyzed in the conception of SOC (Self-Organized Criticality). 2 nighttime intervals, 0–3 and 3–6 h by local time have been used to decrease the noise interference in row data. In or-der to exclude the intervals with a high geomagnetic activ-ity from analysis we referred to Ap indices, calculated for corresponding time intervals. The contribution of seismic events to geomagnetic emission was estimated by seismic index ks=100.75Ms/10D, where Ms is the amplitude of the
earthquake and D is the distance from its epicenter to the sta-tion.
1 Introduction
Different long-term observatories in Japan (Hayakawa, 1999), Russia (Molchanov, 2001, 2003), USA (Fraser-Smith, 1990, 1993), prove that the ULF EM band is very promising for monitoring of EM emission generated in the period pre-ceding strong earthquakes and volcano eruptions. The ULF part of electromagnetic emission, generated by the earth-quake, can be recorded at the Earth’s surface by magne-tometers without significant attenuation, if they are generated at typical earthquake nucleation depths (∼10 km). Higher frequencies would have smaller skin depths and therefore, greater attenuation before reaching the Earth’s surface. In addition to that, the ULF geomagnetic equipment does not
Correspondence to: A. Kotsarenko
require complicated maintenance. Finally, the existing pow-erful methods of the data processing, such as spectral and polarization analysis (Hayakawa, et al., 2002), gradient me-tering and triangulation analysis (Ismaguilov et al., 2001, 2003), blind de-convolution technique (PCA analysis, Go-toh, Hayakawa et al., 2001, 2003; Kotsarenko, 2001), multi-fractal analysis (Smirnova et al., 2001) give a variety of ap-plication of mentioned methods of data processing and anal-ysis of the results. The main aim of our study was to analyze the geomagnetic data observed at the station Teoloyucan dur-ing the period 1998–2001 and to find a statistical correlation between observed ULF EM emission and strong earthquakes occurred during that period of time.
2 Experiment and methodology
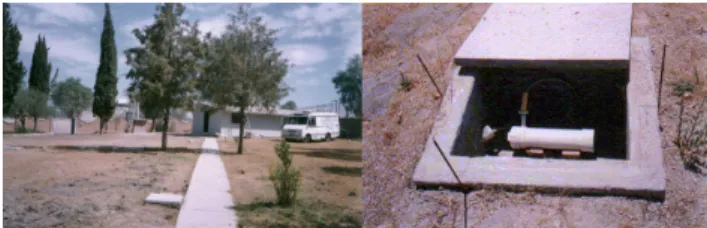
The geomagnetic data were collected at the station Teoloyu-can (99.11035.73500W, 19.44045.10000N, 2280 m height) by 3-coordinate fluxgate magnetometer designed at UCLA, op-erated at 1 Hz sampling rate frequency, equipped by a GPS system for data synchronization (Fig. 1).
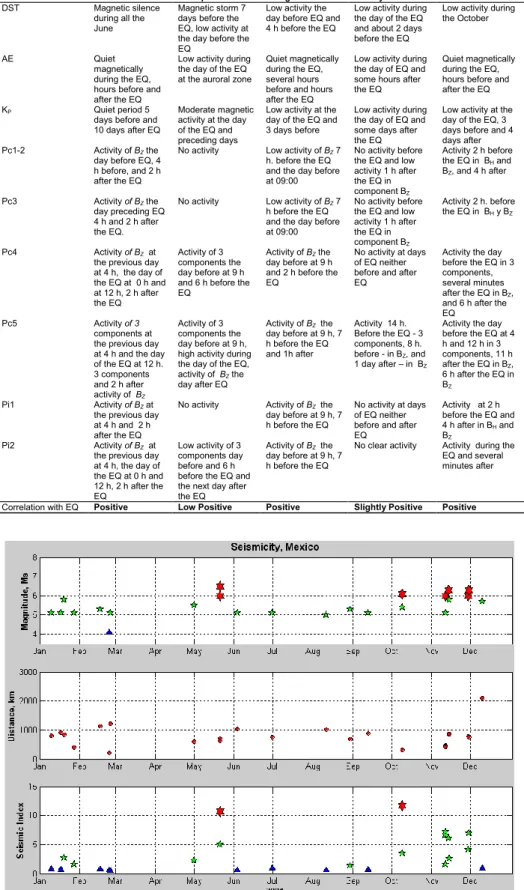
Seismic data have been classified by 3 criteria: magnitude of earthquake Ms, distance from epicenter of EQ D, and the seismic index (Molchanov et al., 2003) ks=100.75Ms/10D,
which was the main one (Fig. 2).
As well we referred to Ap indices, calculated for corre-sponding time intervals of seismic events in order to exclude from our analysis the events occurred during high geomag-netic activity Finally, there were only 5 earthquakes with ks>10 occurring under quiet geomagnetic conditions. Their
characteristics, the map of the epicenters and the station lo-cation are shown at the Table 1 and in a Fig. 3.
The obtained results are distributed in three main blocks according to their applied technique.
680 A. Kotsarenko et al.: Analysis of the ULF electromagnetic emission
Fig. 1. Teoloyucan magnetic station and 3-component ULF
magne-tometer.
2.1 Spectral and polarization analysis
We have chosen 2 nighttime intervals, 0–3 and 3–6 h by local time to decrease the noise interference in row data. Prelimi-nary data processing includes filtering by running averaging with 2σ screening and de-spike procedure in order to exclude spike-like noise (instrumental errors and human activity) and de-trended procedure to relieve local disturbances from the slow diurnal variation.
We calculated spectral values SZ and SG (where
G2=H2+D2, G – total horizontal component), by PSD al-gorithm in 6 frequency sub-bands: f =1, 3, 10, 30, 100 and 300 mHz, with NFFT=10 800 (3 h); constructed polarization ratios R=SZ/SG, and their derivatives R(1f1)/R(1f2);
cal-culated 5400 daily values for SZ and SG and R (with the
same NFFT=10 800) for a construction of the annual spec-trograms; and combined all the mentioned results with corre-sponding variation of Ap with a purpose to isolate EM emis-sions generated by seismic sources from global geomagnetic disturbances such as magnetic storms.
2.2 The fractal analysis
This procedure requires the graph of daily PSD SH, G=SH, G(f ) to be presented with a logarithmic
scale for both x- and y-axes. Mentioning the frequency dependence as S∼f−β, we calculated the exponent β by linear fit of the plotted dependence using least-squares. The shape of the PSD graphs was a quite different for the different 3-time intervals of data.
Some fractures and bends at definite frequencies appeared at most of noon and evening spectra, so the same 0–3 and 3–6 local time intervals have been used for this analysis. 2.3 The retrospective analysis of geomagnetic
micropulsa-tions in relation to seismic activity
We analyzed 5 seismic events, mentioned before, for a possi-ble correlation with geomagnetic micropulsations, both con-tinued and irregular ones, which occurred at the day of the earthquake, days before and after earthquake. Exception was the earthquake occurred on 30 September 1999, apparently none of the observed micropulsation has relation with geo-magnetic activity and most probably they have been gener-ated locally.
Table 1. The 5 strong and moderate earthquakes chosen for
analy-sis.
Date, GMT time Magnitude, Ms Depth, km 15 June 1999, 20:42 7.0 69 30 September 1999, 16:31 7.5 16 9 August 2000, 11:41 6.5 16 19 May 2001, 23:21 6.5 20 7 October 2001, 21:39 6.1 10
We have used Matlab-based software (© Hannes Schwarzl, UCLA University) to filtrate data in correspond-ing frequency sub-band, related to proper geomagnetic pul-sations, process and analyze them using powerful a interface. As well we referred to the data of other geomagnetic sta-tions in order to verify the character of the observed effects, global or local ones.
3 Description analysis of the obtained results
The analysis of the temporal dynamics of spectral densitiesSZ,G, polarization ratios R = SZ/SG, their
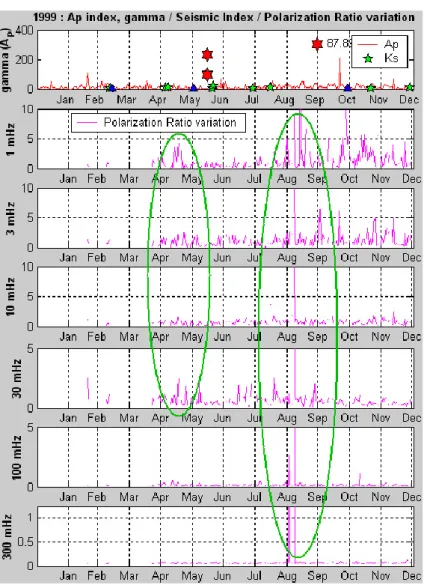
deriva-tives and annual spectrograms reveals following features: no-ticeable increase for the values of most of the mentioned characteristics in periods about 14–30 days before 3 of 5 earthquakes: moderate increase expressed at lower frequen-cies for the earthquake occurred on 15 June 1999, and high, multispike-like increase at all frequency sub-bands for earth-quakes occurred on 30 September 1999 and 19 May 2001 (Fig. 4), especially clearly seen in the polarization ratio vari-ations. Almost all the mentioned changes in spectra and po-larization took place during quiet local geomagnetic activity (Ap low). These events have duration from 1 to 2 weeks, corresponding change of values are: up to tens nano Tesla in absolute values, up to tens of nT2/Hz for spectral values and up to 10 time in polarization ratio. Such a feature can be in-terpreted as a possible ULF geomagnetic emission generated in the earthquake preparation site. There was no noticeable event observed for the other 2 earthquakes. All other changes in spectral variation can be explained by moderate and high magnetospheric activity.
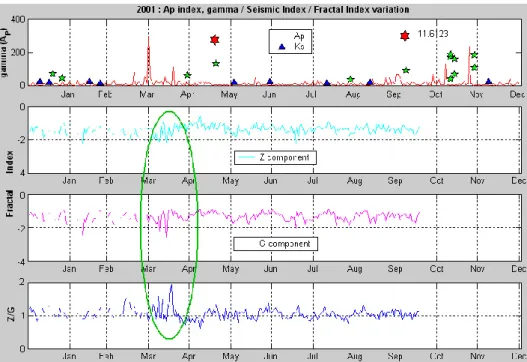
Variations of fractal indices for the vertical (Z) and total horizontal (G) components and their ratio (Z/G), calculated for 3 years, reveal only 1 significant change in their dynam-ics, related to earthquake occurred on 19 May 2001. Notice-able noise-like behavior with slight increase in Z-component and some drops in G-component occurred in about 1 month before that earthquake with approximate duration about 20 days (Fig. 5).
The example of observed micropulsations related to the earthquake occurred on 15 June 1999 at 20:42 GMT is pre-sented at Fig. 6. The complete description of the observed events one can see in the Table 2.
A. Kotsarenko et al.: Analysis of the ULF electromagnetic emission 681
Table 2. The geomagnetic activity (Pc1-5, Pi1,2) during 5 strong and moderate earthquakes chosen for analysis. DATE 15 June 1999 30 Sept. 1999 9 Aug. 2000 19 May 2001 7 Oct. 2001
DST Magnetic silence during all the June
Magnetic storm 7 days before the EQ, low activity at the day before the EQ
Low activity the day before EQ and 4 h before the EQ
Low activity during the day of the EQ and about 2 days before the EQ
Low activity during the October
AE Quiet
magnetically during the EQ, hours before and after the EQ
Low activity during the day of the EQ at the auroral zone
Quiet magnetically during the EQ, several hours before and hours after the EQ
Low activity during the day of EQ and some hours after the EQ
Quiet magnetically during the EQ, hours before and after the EQ KP Quiet period 5
days before and 10 days after EQ
Moderate magnetic activity at the day of the EQ and preceding days
Low activity at the day of the EQ and 3 days before
Low activity during the day of EQ and some days after the EQ
Low activity at the day of the EQ, 3 days before and 4 days after Pc1-2 Activity of BZ the
day before EQ, 4 h before, and 2 h after the EQ
No activity Low activity of BZ 7
h. before the EQ and the day before at 09:00
No activity before the EQ and low activity 1 h after the EQ in component BZ Activity 2 h before the EQ in BH and BZ, and 4 h after Pc3 Activity of BZ the day preceding EQ 4 h and 2 h after the EQ.
No activity Low activity of BZ 7
h before the EQ and the day before at 09:00
No activity before the EQ and low activity 1 h after the EQ in component BZ Activity 2 h. before the EQ in BH y BZ Pc4 Activity of BZ at
the previous day at 4 h, the day of the EQ at 0 h and at 12 h, 2 h after the EQ Activity of 3 components the day before at 9 h and 6 h before the EQ
Activity of BZ the
day before at 9 h and 2 h before the EQ
No activity at days of EQ neither before and after EQ
Activity the day before the EQ in 3 components, several minutes after the EQ in BZ,
and 6 h after the EQ
Pc5 Activity of 3 components at the previous day at 4 h and the day of the EQ at 12 h. 3 components and 2 h after activity of BZ Activity of 3 components the day before at 9 h, high activity during the day of the EQ, activity of BZ the day after EQ Activity of BZ the day before at 9 h, 7 h before the EQ and 1h after Activity 14 h. Before the EQ - 3 components, 8 h. before - in BZ, and 1 day after – in BZ
Activity the day before the EQ at 4 h and 12 h in 3 components, 11 h after the EQ in BZ, 6 h after the EQ in BZ Pi1 Activity of BZ at
the previous day at 4 h and 2 h after the EQ
No activity Activity of BZ the
day before at 9 h, 7 h before the EQ
No activity at days of EQ neither before and after EQ
Activity at 2 h before the EQ and 4 h after in BH and
BZ
Pi2 Activity of BZ at
the previous day at 4 h, the day of the EQ at 0 h and 12 h, 2 h after the EQ Low activity of 3 components day before and 6 h before the EQ and the next day after the EQ
Activity of BZ the
day before at 9 h, 7 h before the EQ
No clear activity Activity during the EQ and several minutes after Correlation with EQ Positive Low Positive Positive Slightly Positive Positive
Fig. 2. Seismicity in Mexico in 2001. Ms are magnitudes of the EQs; distances from the epicenter D and seismic index kSare calculated for Teoloyucan geomagnetic station.
682 A. Kotsarenko et al.: Analysis of the ULF electromagnetic emission
Fig. 3. Map of epicenters (stars) of earthquakes discussed and Teoloyucan magnetic station (triangle).
Fig. 4. Temporal variation of polarization ratio calculated for 6 frequency sub-bands, upper panel – seismic activity (kSindex) and geomag-netic activity (AP index) dynamics, 1999.
A. Kotsarenko et al.: Analysis of the ULF electromagnetic emission 683
Fig. 5. Temporal variation of fractal index, upper panel – seismic activity (kSindex) and geomagnetic activity (AP index) dynamics, 2001.
Fig. 6. Micropulsations, observed on 15 June 1999 in component Z. Upper panel – BZ time series, second panel – PC4 sub-band, third panel – PC5 sub-band, lower panel – daily spectrogram for PC5. The earthquake time is marked with a violet mark.
Generally all the observed evens can be classified in 3 blocks due to their occurrence time: pre-seismic (before the earthquake), co-seismic (at the exact time of the earthquake and during it) and post-seismic events observed at different sub-bands. Most of events, classified in the table, have no re-lation neither with global nor with local geomagnetic activity, which was proven by checking with DST , KP and AE
geo-magnetic indices and by comparing obtained results with the results based on the data of another geomagnetic stations.
Moreover, observed micropulsations normally do not oc-cur at all during the days with absent or low geomagnetic
activity. For these reasons we can testify the probable rela-tion of the observed events with the effects of the prepararela-tion of the earthquakes.
4 Conclusions
In this paper we have studied geomagnetic data performing analysis in 3 different conceptions. The traditional one, such as construction of spectral long time series (SZ SG,
684 A. Kotsarenko et al.: Analysis of the ULF electromagnetic emission for different ULF sub-bands; Fractal analysis and
multi-analysis of geomagnetic micropulsation data corresponding to 5 strong and moderate earthquakes with magnitudes greater than 6.0, that occurred in Mexico during 1999–2001. We found the following:
1. In the case of 3 of the mentioned events studied within the concept of traditional analysis, most characteristics show noticeable increase, taking place from 14 to 30 days in almost all frequencies, mainly at the lower ones. 2. For the fractal analysis, there was only one significant change with 20 days duration, that occurred in about one month prior to the corresponding earthquake. 3. Some micropulsations not associated to magnetospheric
activity were present before, during and after some ma-jor earthquakes, some of them shown in all three com-ponents of the magnetic field.
We are aware that these results are still with the possibility of improvement with more extended network observations and therefore, with the possibility of applying other ad-vanced techniques.
Edited by: P. F. Biagi Reviewed by: one referee
References
Fraser-Smith, A. C., Bernardy, A., McGill, P. R., Ladd, M. E., Hel-liwell, R. A., and Villard Jr., O. G.: Low frequency magnetic field measurements near the epicenter of the Ms 7.1 Loma Prieta earthquake, Geophys. Res. Lett., 17, 1465–1468, 1990. Fraser-Smith, A. C.: Analysis of low-frequency electromagnetic
field measurements near the epicenter, Loma Prieta, California, Earthquake of 17 October 1989, Preseismic observations, U.S. Geol. Survey Prof. Paper 1550-C, C 17-C251, 1993.
Gotoh K., Hayakawa, M., and Smirnova, N.: Fractal analysis of the ULF geomagnetic data obtained at Izu Peninsula, Japan in relation to the nearby earthquake swarm of June–August 2000, Nat. Haz. Earth Syst. Sci., 3, 229–236, 2003,
SRef-ID: 1684-9981/nhess/2003-3-229.
Hattori, K., Gotoh, K., Hayakawa, M. et al.: ULF geomagnetic anomaly associated with earthquakes around Izu islands, Japan 2000, Proceedings of URSI General Assembly, 2002.
Hayakawa, M., Ito, T., and Smirnova, N.: Fractal analysis of ULF geomagnetic data associated with the Guam earthquake on 8 Au-gust 1993, Geophys. Res. Lett., 26, 2797–2800, 1999.
Ismaguilov, V., Kopytenko, Yu., Hattori, K., Voronov, P., Molchanov, O., and Hayakawa, M.: ULF magnetic emissions connected with under sea bottom earthquakes. Nat. Haz. Earth Syst. Sci., 1, 23–31, 2001,
SRef-ID: 1684-9981/nhess/2001-1-23.
Ismaguilov, V., Kopytenko, Yu., Hattori, K., and Hayakawa, M.: Variations of phase velocity and gradient values of ULF geomag-netic disturbances connected with the Izu strong earthquakes, Nat. Haz. Earth Syst. Sci., 3, 211–215, 2003,
SRef-ID: 1684-9981/nhess/2003-3-211.
Kotsarenko, A., Hayakawa, M., Molchanov, O., Koshova, S., and Grimalsky, V.: Results of the ULF magnetic field measurements during the seismic period at Izu peninsula, Japan, Puerto Vallarta, Jal., Mexico, Uni´on Geof´ısica Mexicana, 21 N 3, 170, 2001. Kotsarenko A., Molchanov, O., Hayakawa, M., Koshevaya, S.,
Grimalsky, V., P´erez Enr´ıquez, R., and L´opez Cruz-Abeyro, J. A.: Investigation of ULF magnetic anomaly during Izu earth-quake swarm and Miyakejima volcano eruption at summer 2000, Japan, the IEEE 2003 International Symposium on Electromag-netic Compatibility (EMC), Istanbul, Turkey, MO-A-P1, N 11, 2003.
Molchanov, O., Schekotov, A., Fedorov, E., Belyaev, G., and Gordeev, E.: Preseismic ULF electromagnetic effect from ob-servation at Kamchatka, Nat. Haz. Earth Syst. Sci., 3, 203–209, 2003,
SRef-ID: 1684-9981/nhess/2003-3-203.
Molchanov, O. A., Schekotov, A. Yu., Fedorov, E., and Hayakawa, M.: Ionospheric Alfv´en resonance at middle latitudes: results of observations at Kamchatka, Phys. Chem. Earth, 29, 649–655, 2004.
Smirnova, N., Hayakawa, M., Gotoh, K., and Volobuev, D.: Scal-ing characteristics of ULF geomagnetic fields at the Guam seis-moactive area and their dynamics in relation to the earthquake, Nat. Haz. Earth Syst. Sci., 1, 119–126, 2001,