HAL Id: hal-00317643
https://hal.archives-ouvertes.fr/hal-00317643
Submitted on 23 Sep 2004
HAL is a multi-disciplinary open access
archive for the deposit and dissemination of
sci-entific research documents, whether they are
pub-lished or not. The documents may come from
teaching and research institutions in France or
abroad, or from public or private research centers.
L’archive ouverte pluridisciplinaire HAL, est
destinée au dépôt et à la diffusion de documents
scientifiques de niveau recherche, publiés ou non,
émanant des établissements d’enseignement et de
recherche français ou étrangers, des laboratoires
publics ou privés.
Longitudinal differences observed in the ionospheric
F-region during the major geomagnetic storm of 31
March 2001
Y. Sahai, P. R. Fagundes, F. Becker-Guedes, J. R. Abalde, G. Crowley, X. Pi,
K. Igarashi, G. M. Amarante, A. A. Pimenta, J. A. Bittencourt
To cite this version:
Y. Sahai, P. R. Fagundes, F. Becker-Guedes, J. R. Abalde, G. Crowley, et al.. Longitudinal differences
observed in the ionospheric F-region during the major geomagnetic storm of 31 March 2001. Annales
Geophysicae, European Geosciences Union, 2004, 22 (9), pp.3221-3229. �hal-00317643�
Annales Geophysicae (2004) 22: 3221–3229 SRef-ID: 1432-0576/ag/2004-22-3221 © European Geosciences Union 2004
Annales
Geophysicae
Longitudinal differences observed in the ionospheric F-region
during the major geomagnetic storm of 31 March 2001
Y. Sahai1, P. R. Fagundes1, F. Becker-Guedes1, J. R. Abalde1, G. Crowley2, X. Pi3, K. Igarashi4, G. M. Amarante5, A. A. Pimenta6, and J. A. Bittencourt6
1Universidade do Vale do Paraiba (UNIVAP), 12244-000 S˜ao Jos´e dos Campos, SP, Brazil 2Southwest Research Institute, San Antonio, TX 78238-5166, USA
3Jet Propulsion Laboratory, California Institute of Technology, Pasadena, CA 91109, USA 4Communications Research Laboratory, Koganei-shi, Tokyo 184-8795, Japan
5The Abdus Salam ICTP, Strada Costeira 11, 34014 Trieste, Italy
6Instituto Nacional de Pesquisas Espaciais (INPE), 12201-970 S˜ao Jos´e dos Campos, SP, Brazil
Received: 3 October 2003 – Revised: 19 May 2004 – Accepted: 9 June 2004 – Published: 23 September 2004 Part of Special Issue “Equatorial and low latitude aeronomy”
Abstract. A new ionospheric sounding station using a
Cana-dian Advanced Digital Ionosonde (CADI) was established for routine measurements by the “Universidade do Vale do Paraiba (UNIVAP)” at S˜ao Jos´e dos Campos (23.2◦S,
45.9◦W), Brazil, in August 2000. A major geomagnetic
storm with gradual commencement at about 01:00 UT was observed on 31 March 2001. In this paper, we present and discuss salient features from the ionospheric sounding mea-surements carried out at S. J. Campos on the three con-secutive UT days 30 March (quiet), 31 March (disturbed) and 1 April (recovery) 2001. During most of the storm pe-riod, the foF2 values showed negative phase, whereas dur-ing the two storm-time peaks, large F-region height varia-tions were observed. In order to study the longitudinal dif-ferences observed in the F-region during the storm, the si-multaneous ionospheric sounding measurements carried out at S. J. Campos, El Arenosillo (37.1◦N, 6.7◦W), Spain, Ok-inawa (26.3◦N, 127.8◦E), Japan and Wakkanai (45.5◦N, 141.7◦E), Japan, during the period 30 March–1 April 2001,
have been analyzed. A comparison of the observed iono-spheric parameters (h0F and foF2) in the two longitudinal
zones (1. Japanese and 2. Brazilian-Spanish) shows both sim-ilarities and differences associated with the geomagnetic dis-turbances. Some latitudinal differences are also observed in the two longitudinal zones. In addition, global iono-spheric TEC maps from the worldwide network of GPS re-ceivers are presented, showing widespread TEC changes dur-ing both the main and recovery phases of the storm. The ionospheric sounding measurements are compared with the ASPEN-TIMEGCM model runs appropriate for the storm
Correspondence to: Y. Sahai
conditions. The model results produce better agreement dur-ing the quiet period. Durdur-ing the disturbed period, some of the observed F-region height variations are well reproduced by the model results. The model foF2 and TEC results differ considerably during the recovery period and indicate much stronger negative phase at all the stations, particularly at the low-latitude ones.
Key words. Ionosphere (ionospheric disturbances;
mod-elling and forecasting) – Magnetospheric physics (storms and substorms)
1 Introduction
The response of the coupled magnetosphere-ionosphere-thermosphere system during major geomagnetic storms is one of the key issues related to space weather studies. In the recent years, considerable interest has been evinced in investigations related to disturbances in the mid- and/or low-latitude ionosphere associated with geomagnetic storms (e.g. Sobral et al., 1997; Bust et al., 1997; Foster and Rich, 1998; Musman et al., 1998; Ho et al., 1998; Pi et al., 2000; Kel-ley et al., 2000; Shiokawa et al., 2000, 2002; Sahai et al., 2001; Basu et al., 2001a, b; Lee et al., 2002; Lee, J. J. et al., 2002; Sastri et al., 2002). As remarked by Kelley et al. (2000) many more people live in these latitude belts than at high latitudes and these investigations assume great impor-tance because ionospheric disturbances or storms may cause operational problems in space communication and naviga-tion systems affecting everyday human activity. Recently, Buonsanto (1999) has provided an excellent review on iono-spheric storms. During geomagnetic storms, the disturbed
3222 Y. Sahai et al.: Longitudinal differences observed in the ionospheric F-region
Table 1. Details of the observing sites.
Location Symbol used Geog. Lat. Geog. Long. Dip Lat. S˜ao Jos´e dos Campos, Brazil SJC 23.2◦S 45.9◦W 17.6◦S
Vassouras, Brazil VAS 22.4◦S 34.6◦W 18.5◦S
Okinawa, Japan OKI 26.3◦N 127.8◦E 21.2◦N
El Arenosillo, Spain ELA 37.1◦N 6.7◦W 31.2◦N
Wakkanai, Japan WAK 45.5◦N 141.7◦E 41.2◦N
0 3 6 9 Kp 0 1000 2000 3000 A E (nT) -360 -240 -120 0 D st (nT) 0 4 8 12 16 20 200 nT H-C O M P O N E N T VA S S O U R A S 0 4 8 12 16 20 UNIVERSAL TIME 0 4 8 12 16 20 24
30 MARCH 2001 31 MARCH 2001 01 APRIL 2001
Figure 1
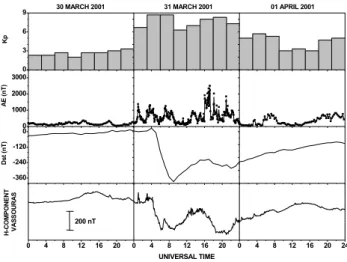
Fig. 1. Time variations of the Kp, AE and Dstgeomagnetic indices
for the period 30 March–1 April 2001. Also, the geomagnetic field H-component variations observed at Vassouras, Brazil are shown. solar wind-magnetosphere interactions could affect the mid-and low-latitude F-region due to intense transient magne-tospheric (prompt or direct penetration) convective electric fields (Sastri et al., 1992; Foster and Rich, 1998) and neu-tral wind (ionospheric disturbance dynamo). Joule heating at high latitude also results in traveling atmospheric dis-turbances (Burns and Killeen, 1992; Hocke and Schlegel, 1996). As pointed out by Danilov and Morozova (1985), the characteristics of ionospheric storms are studied primar-ily in terms of deviations of the F-region critical frequency (foF2) from the median value for the same time of day (pos-itive (increase in electron density) and negative (decrease in electron density) storms or phases) and changes in the height of the F-region (either minimum virtual height (h0F) or peak height (hpF2 (virtual height at 0.834foF2) or hmF2). Accord-ing to Danilov and Morozova (1985), after the commence-ment of the magnetic disturbance (sudden or gradual) the positive phase appears first at high latitudes and is replaced by the negative phase after several hours (the negative phase develops from high toward middle latitudes). Danilov and Morozova (1985) also point out that the mechanisms associ-ated with the development of the positive and negative phases are related to different magnetosphere-ionosphere interaction channels.
A major geomagnetic storm with gradual commencement at about 01:00 UT was observed on 31 March 2001. The
storm on 31 March was associated with the coronal mass ejection (CME) on 29 March (Srivastava and Venkatakr-ishnan, 2002) and on 31 March a fast solar wind transient with strong southward interplanetary magnetic field Bz
pro-duced a strong geomagnetic storm (Skoug et al., 2003). Figure 1 shows the time variations of the Kp (intensity of
storms; 3-hourly values), Dst (intensity of the ring current;
hourly values) and AE (intensity of the auroral electrojet; every 15 min on 30 March and 1 April, and every 5 min or less on 31 March) geomagnetic indices. The geomagnetic storm had a double-peaked main phase, the first peak with
Kp=9− between 03:00–09:00 UT and |Dst|max=387 nT at
09:00 UT and second with Kp=8+ between 18:00–21:00 UT
and |Dst|max=284 nT at 22:00 UT.
On 31 March, the AE index had a very rapid rise to 1317 nT at 00:58 UT and then during the first and second peaks attained maximum values of 1310 nT at 03:39 UT and 2508 nT at 17:12 UT, respectively. The AE index varia-tions presented in Fig. 1 were downloaded from the web-site – http://swdcdb.kugi.kyoto-u.ac.jp/wdc/Sec3.html. As remarked by Akasofu (1970), the AE index is particularly useful in providing information on the occurrence and in-tensity of substorms (AE of the order of 500 nT is rather common). Figure 1 also shows the geomagnetic field H-component variations (every min) observed at Vassouras (hereafter referred as VAS), Brazil, located close to the iono-spheric sounding station at S˜ao Jos´e dos Campos. Table 1 gives the details of all the observing sites from which data have been used in the present investigation.
A new ionospheric sounding station was established by the “Universidade do Vale do Paraiba (UNIVAP)” at S˜ao Jos´e dos Campos (hereafter referred as SJC), Brazil, in August 2000, utilizing a Canadian Advanced Digital Ionosonde (CADI) (Grant et al., 1995) and some of the ini-tial ionospheric sounding results were presented by Abalde et al. (2001). In this paper we present and discuss several important features from the ionospheric sounding measure-ments at SJC during the period 30 March (quiet), 31 March (disturbed) and 1 April (recovery) 2001 (UT days). SJC is a new low-latitude site located in Brazil under the equatorial ionospheric anomaly crest and inside the Brazilian magnetic anomaly region.
In order to study the longitudinal differences during the intense space weather event on 31 March for both mid and low latitudes, the ionospheric measurements obtained on the
Y. Sahai et al.: Longitudinal differences observed in the ionospheric F-region 3223 0 4 8 12 16 20 S. J. CAMPOS 30 MARCH 2001 31 MARCH 2001 0 4 8 12 16 20 RANGE SPREAD F SPORADIC E 01 APRIL 2001 0 4 8 12 16 20 0 4 8 12 16 20OKINAWA fo F 2 (M Hz) - m o d el foF2 ( M H z) fo F 2 (M H z) - m o d el foF2 ( M H z) 0 4 8 12 16 20 UNIVERSAL TIME 0 4 8 12 16 20 240 4 8 12 16 20 Figure 2a
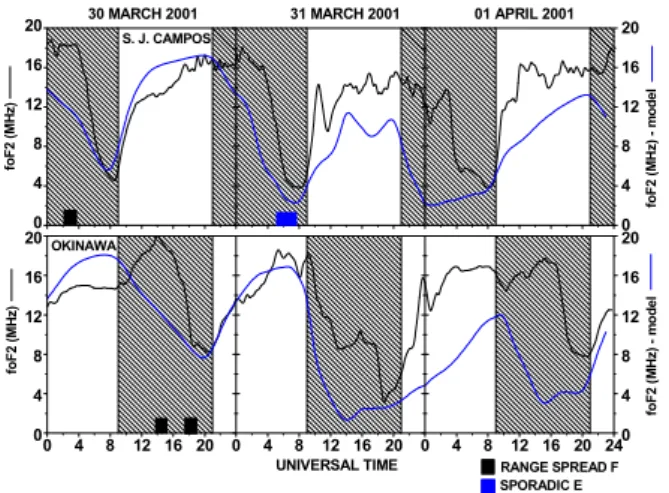
Fig. 2a. F-region critical frequency (foF2) variations (black) ob-served at low-latitude stations S˜ao Jos´e dos Campos and Okinawa during the period 30 March–1 April 2001. The hatched portions in-dicate the local nighttime (18:00–06:00 LT) periods. The black and blue horizontal bars indicate the presence of range spread-F and sporadic E, respectively. Peak F-region critical frequency (foF2) variations obtained from the ASPEN-TIMEGCM model runs are also shown (blue).
same UT days (30 March to 1 April) in 3 longitude sectors (2 mid latitude and 2 low latitude) have been analyzed and presented in this paper. It should be mentioned that the iono-spheric sounding stations SJC and El Arenosillo (hereafter referred as ELA), Spain, differ by 3 h in local time, whereas Okinawa (hereafter referred as OKI) and Wakkanai (here-after referred as WAK), both in Japan, have the same local time. In addition, global ionospheric TEC maps (e.g. Man-nucci et al., 1998; Iijima et al., 1999) from the worldwide net-work of GPS receivers are presented which show widespread TEC changes during both the main and recovery phases of the storm. The ionospheric sounding measurements obtained at all of the four stations during the period studied are com-pared with the ASPEN-TIMEGCM model results (Roble and Ridley, 1994) appropriate for the storm conditions.
2 Results and discussion
As mentioned earlier, the data used in this study relates to the ionospheric observations on three consecutive UT days, i.e. 30 March to 1 April 2001. The ionograms recorded ev-ery 15 min at SJC were scaled to obtain the ionospheric pa-rameters (h0F, foF2, spread-F and sporadic E) presented in this study. The virtual heights at 0.834foF2 (hpF2) presented from SJC were obtained every hour. The scaled ionospheric parameters (h0F, foF2, hpF2 or hmF2, spread-F) from the Spanish (ELA – every hour) and Japanese (WAK and OKI – every 15 min except hpF2 – every hour) stations presented here were kindly provided by the respective operating agen-cies. 200 400 600 800 hpF2 ( km ) hpF2 ( km ) h´ F ( km ) h´ F ( km ) S. J. CAMPOS 30 MARCH 2001 31 MARCH 2001 200 400 600 800 01 APRIL 2001 0 4 8 12 16 20 200 400 600 800 SPORADIC E RANGE SPREAD F OKINAWA hm F 2 ( km ) m ode l hmF2 ( km ) m o d el 0 4 8 12 16 20 UNIVERSAL TIME 0 4 8 12 16 20 24 200 400 600 800 Figure 2b
Fig. 2b. F-region minimum virtual height (h0F – red) and hpF2 (black) variations observed at low-latitude stations S˜ao Jos´e dos Campos and Okinawa during the period 30 March–1 April 2001. The hatched portions indicate the local nighttime (18:00–06:00 LT) periods. The black and blue horizontal bars indicate the presence of range spread-F and sporadic E, respectively. Peak F-region height (hmF2) variations obtained from the ASPEN-TIMEGCM model runs are also shown (blue).
2.1 Response of the F-region at SJC
Figure 2a shows the time variations of the ionospheric pa-rameter foF2 and Fig. 2b shows the time variations of the ionospheric parameters h0F and hpF2 obtained at SJC (UT=LT+3 h) and Okinawa (UT=LT−9 h) during the period 30 March to 1 April. The hatched portions in Figs. 2 and 4 indicate the local nighttime periods (18:00–06:00 LT) at the different ionospheric sounding stations. A comparison of the foF2 values observed on 30 March, with those ob-served on 31 March and 1 April, indicates that starting soon after the onset of the geomagnetic storm at about 01:00 UT (22:00 LT) on 31 March, the foF2 values show negative phase up to about 12:00 UT (09:00 LT) on 1 April. Also, the vari-ations in foF2 at SJC show wave-like disturbances between about 10:00 (31 March) to 02:00 (1 April) UT, mostly dur-ing the daytime period. Turunen and Mukunda Rao (1980) have also reported wave-like disturbances during the daytime at an equatorial station associated with geomagnetic distur-bances. The observed wave-like disturbances are possibly associated with substorms, as evidenced by a large increase in the AE index (Fig. 1), when additional energy is injected at high latitudes. As pointed out by numerous authors, this additional energy can launch a traveling atmospheric distur-bance (TAD), which propagates with high velocity (Crow-ley and Williams, 1987; Crow(Crow-ley et al., 1987; Rice et al., 1988; Crowley and McCrea, 1988). Sometimes TIDs with velocities in excess of 1200 m/s are generated (e.g. Killeen et al., 1984; Hajkowicz, 1990). Immel et al. (2001) simulated large-scale TADS launched simultaneously in conjugate au-roral zones, which coalesced near the equator. Prolss (1993) indicated that, at low latitudes, the energy dissipation of the two TIDs launched in both hemispheres causes an increase in the upper atmosphere temperature and in the gas densities.
3224 Y. Sahai et al.: Longitudinal differences observed in the ionospheric F-region
Figure 3
Fig. 3. Ionograms obtained at S˜ao Jos´e dos Campos between 06:00 and 07:30 UT (03:00–04:30 LT) on 31 March showing the presence of intense sporadic E at the time of the unusual uplifting of the F-region.
The h0F variations at SJC (Fig. 2b) show a rapid and large
uplifting of the F-region at about 06:00 UT (03:00 LT) on 31 March, with h0F reaching more than 550 km. This unusual and rapid uplifting (disturbance drift) is possibly associated with the prompt penetration of the storm-induced magneto-spheric electric field to the middle latitude and equatorial re-gions, resulting in an enhanced eastward electric field in the F-region (e.g. Fejer and Scherliess, 1995; Sahai et al., 1998; Pi et al., 2000). As pointed out by VanZandt et al. (1971), the most direct and easily observed effects of electromag-netic drift are changes in the height of the F-layer. The geo-magnetic H-component variations observed at VAS (Fig. 1) show a maximum in negative excursion at about 05:00 UT (the time of sudden increase in the F-region height), possibly caused by a westward ring current (VanZandt et al., 1971). The rapid uplifting of the equatorial ionospheric F-region is one of the important conditions for the onset and growth of the range type spread-F (e.g. Mendillo et al., 1992; Bitten-court et al., 1997). We do not have ionospheric sounding data obtained in this longitudinal sector close to the mag-netic equator, during the period of the unusual uplifting, to indicate if range spread-F developed or not in the equatorial region. However, no range spread-F was observed at SJC but we did see intense sporadic E-layer. Figure 3 shows four
ionograms obtained at SJC between 03:00–04:30 LT. The ionograms show the presence of strong sporadic E-layer be-tween 03:00–04:00 LT. Recently, Stephan et al. (2002) have presented studies of the suppression of equatorial spread-F by sporadic E-layer. With the presence of sporadic E-layer, the Pedersen conductivity in the E-layer will increase and therefore, the rate of evolution of the irregularities causing F will decrease. Possibly the absence of range spread-F at SJC following the rapid uplifting of the spread-F-region is as-sociated with the near simultaneous occurrence of sporadic E-layer.
The F-region height (h0F) oscillations observed on
31 March–1 April between about 21:00 UT (18:00 LT) and 09:00 UT (06:00 LT) are possibly caused by the global ther-mospheric wind circulation associated with the Joule heat-ing in the auroral zone. As pointed out by Fuller-Rowell et al. (1997), during geomagnetic disturbances, large-scale waves propagate efficiently from the remote high-latitude source region, and the strongest and most penetrating waves arise on the nightside, where they are less hindered by drag from the low ion densities. The uplifting of h0F to about 450 km at about 08:30 UT (02:30 LT) on 1 April may also be a manifestation of strong equatorward winds at SJC.
Y. Sahai et al.: Longitudinal differences observed in the ionospheric F-region 3225 0 4 8 12 16 20 ARENOSILLO 30 MARCH 2001 31 MARCH 2001 0 4 8 12 16 20 01 APRIL 2001 0 4 8 12 16 20 0 4 8 12 16 20 WAKKANAI fo F 2 (M H z) m o de l fo F 2 (M H z) fo F 2 (M H z) m o d el foF 2 (M H z) 0 4 8 12 16 20 UNIVERSAL TIME 0 4 8 12 16 20 240 4 8 12 16 20 RANGE SPREAD F Figure 4a
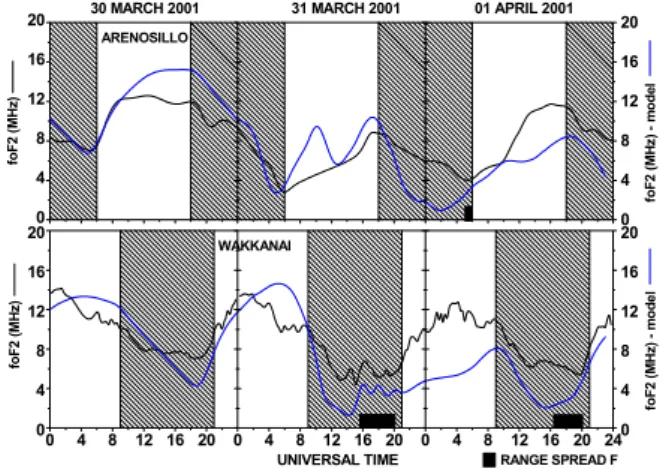
Fig. 4a. Same as in Fig. 2a, but for mid-latitude stations El Arenosillo and Wakkanai.
2.2 Response of the F-region at OKI, ELA and WAK At the outset it should be mentioned that during the first peak of the storm both the Brazilian and Spanish sectors were in the nightside and the Japanese sector was in the dayside, whereas during the second peak of the storm the situation was vice versa. The Brazilian and Spanish sectors differ only by 3 h in local time.
OKI
Figures 2a and b also show the time variations of the ionospheric parameters foF2, h0F and hpF2 obtained at OKI (UT=LT−9 h) during the period 30 March to 1 April. A comparison of the foF2 values observed on 30 March with those observed on 31 March and 1 April, indicates that soon after the onset of the storm at about 01:00 UT (10:00 LT) on 31 March, the foF2 values show positive phase (unlike SJC, where negative phase was observed virtually through out the disturbed period) up to about 10:00 UT (19:00 LT). However, after this a strong negative phase (foF2 at 14:00 UT on 31 March was about 8 MHz, whereas at 14:00 UT on 30 March it was about 20 MHz) was observed and continued up to about 00:00 UT on 1 April. The foF2 values on 1 April are thereafter somewhat close to those observed on 30 March. Also, the variations in h0F show large height changes during the nighttime on 31 March– 1 April, possibly caused by the global thermospheric wind circulation associated with the Joule heating in the auroral zone. At OKI no spread-F was observed on 31 March and 1 April, although range spread was observed prior to the storm on 30 March.
ELA
Figures 4a and b show the time variations of the iono-spheric parameters foF2, h0F and hmF2 obtained at ELA (UT=LT) during the period 30 March to 1 April. Both the
h0F and foF2 changes at ELA and SJC are strikingly similar
200 400 600 800 hpF 2 ( km ) h´ F ( km) h´ F ( km ) hmF 2 ( km ) ARENOSILLO 30 MARCH 2001 31 MARCH 2001 200 400 600 800 01 APRIL 2001 0 4 8 12 16 20 200 400 600 800 WAKKANAI hm F 2 ( km ) m ode l hm F 2 ( km ) m ode l 0 4 8 12 16 20 UNIVERSAL TIME 0 4 8 12 16 20 24 200 400 600 800 RANGE SPREAD F Figure 4b
Fig. 4b. Same as in Fig. 2b, but for mid-latitude stations El Arenosillo and Wakkanai, except hmF2 at El Arenosillo.
(both the negative phase and height changes) during the storm period. However, the unusual uplifting (02:00 UT) of the F-region at ELA is about 4 h before the sudden uplifting observed at SJC on 31 March. No spread-F was observed at ELA on 31 March. It should be pointed out that the wave-like disturbances detected at SJC (Fig. 2a) during the daytime on 31 March were not observed at ELA (Fig. 4a). WAK
Figures 4a and b also show the time variations of the iono-spheric parameters foF2, h0F and hpF2 obtained at WAK
(UT=LT−9 h) during the period 30 March to 1 April. A com-parison of the foF2 values on 31 March at WAK, with OKI, shows that at WAK unlike OKI no positive phase was ob-served. However, the occurrence time and duration of the negative phase at WAK was fairly similar to that at OKI. The h0F variations also show large height changes during the nighttime on 31 March–1 April, similar to OKI. Spread-F (range type) was observed at WAK on both 31 March (dis-turbed) and 1 April (recovery). Since the low-latitude station OKI in the same longitude region had no spread-F on these two nights, ionospheric irregularities during the disturbance period were possibly limited to the mid-latitude region (see, e.g. Kelley et al., 2000; Sahai et al., 2001).
2.3 A comparative study of response of the F-region at SJC, ELA, OKI and WAK
In order to carry out a comparative study related to the re-sponse of the F-region at SJC, ELA, OKI and WAK, during the storm (UT day 31 March) and recovery phases (UT day 1 April) , we present the principal storm-time characteristics observed, compared with the observations in the quiet condi-tions (UT day 30 March and a part of 31 March), in the vari-ations in foF2 and h0F values in Table 2. A perusal of foF2 columns in Table 2 shows that, in general, all the stations had negative phase after about 4–6 h of the storm onset, except OKI which first had a positive phase during the daytime for
3226 Y. Sahai et al.: Longitudinal differences observed in the ionospheric F-region
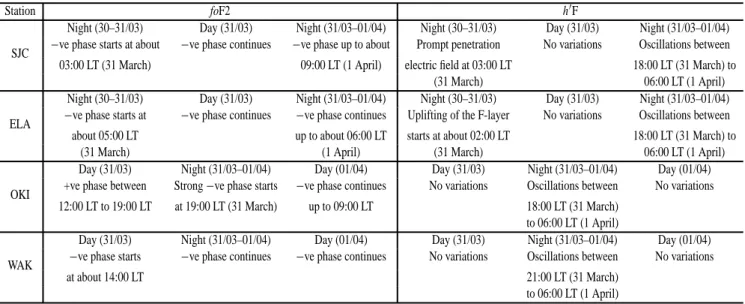
Table 2. Principal characteristics related to the response of the F-region at SJC, ELA, OKI and WAK observed during the major geomagnetic storm with gradual commencement at 01:00 UT and a double-peak main phase at 09:00 UT and 22:00 UT on 31 March 2001.
Station foF2 h0F
Night (30–31/03) Day (31/03) Night (31/03–01/04) Night (30–31/03) Day (31/03) Night (31/03–01/04) SJC −ve phase starts at about −ve phase continues −ve phase up to about Prompt penetration No variations Oscillations between 03:00 LT (31 March) 09:00 LT (1 April) electric field at 03:00 LT 18:00 LT (31 March) to
(31 March) 06:00 LT (1 April)
Night (30–31/03) Day (31/03) Night (31/03–01/04) Night (30–31/03) Day (31/03) Night (31/03–01/04) ELA −ve phase starts at −ve phase continues −ve phase continues Uplifting of the F-layer No variations Oscillations between about 05:00 LT up to about 06:00 LT starts at about 02:00 LT 18:00 LT (31 March) to
(31 March) (1 April) (31 March) 06:00 LT (1 April)
Day (31/03) Night (31/03–01/04) Day (01/04) Day (31/03) Night (31/03–01/04) Day (01/04) OKI +ve phase between Strong −ve phase starts −ve phase continues No variations Oscillations between No variations
12:00 LT to 19:00 LT at 19:00 LT (31 March) up to 09:00 LT 18:00 LT (31 March) to 06:00 LT (1 April)
Day (31/03) Night (31/03–01/04) Day (01/04) Day (31/03) Night (31/03–01/04) Day (01/04) WAK −ve phase starts −ve phase continues −ve phase continues No variations Oscillations between No variations
at about 14:00 LT 21:00 LT (31 March)
to 06:00 LT (1 April)
about 7 h and then had a strong negative phase. The nega-tive phase at all the stations continued in the recovery phase. The negative phase is linked to Joule heating in the auroral zone, whereas several mechanisms have been proposed for the positive phase (Danilov and Morozova, 1985). The h0F columns in Table 2 show that during the daytime none of the stations showed any variations. The variations in h0F at the low-latitude station SJC (which was in the nightside during the onset and first main phase peak) show prompt penetration of disturbance electric field at about 06:00 UT (31 March), whereas the other low-latitude station OKI was in the day-side at this time and did not show any effect associated with the disturbance electric field. As pointed out by Fejer and Kelley (1980) during the daytime the highly conducting E-region can short out the disturbance electric field. During the second main phase peak, OKI was in the nighttime and we do see rather two sharp enhancements in the h0F variations at about 13:00 UT and 18:00 UT. However, at this time there could be the competing influences of the prompt and delayed electric fields.
Another important aspect evident from the variations in
h0F at all the stations is the presence of an oscillatory na-ture during the nighttime, associated with the storm-related transient processes, such as TAD and meridional wind cir-culation. As pointed out by Fuller-Rowell et al. (1997), the strongest and most penetrating waves arise on the nightside, where they are hindered least from the low ion densities. Among the four stations studied, only the mid-latitude sta-tions WAK showed the presence of spread-F (range type). Since the low-latitude station OKI, in the same sector, had no spread-F at that time, possibly enhanced storm-time iono-spheric irregularities were confined to the mid-latitude in the Japanese sector (see, e.g. Sahai et al., 2001). It is noted that both similarities and dissimilarities are observed at the four
stations related to the response of the F-region during the storm.
2.4 Comparison with the ASPEN-TIMEGCM model The TIME-GCM model (Roble and Ridley, 1994) has been in wide use over the last ten years. Recently, the TIME-GCM code was ported to SwRI (Southwest Research Insti-tute), where it now runs in a distributed parallel computing environment on the SwRI Beowulf system, known as the Ad-vanced SPace ENvironment (ASPEN) model. For the March 2001 runs presented here, the ASPEN inputs included the appropriate F10.7 for the day. The size of the auroral oval and particle fluxes were driven by Hemispheric Power esti-mates from the DMSP and NOAA satellites on a cadence of about 15 min. The cross-cap potential was represented by a Heelis et al. (1982) model driven by the IMF By
compo-nent. The cross-cap potential difference was obtained from the Weimer empirical potential model (Weimer, 1996) driven by solar wind inputs. The ASPEN-TIMEGCM model results (blue line) obtained for the different ionospheric sounding stations are shown in Figs. 2 and 4 with the respective sta-tions. A comparison of the observed foF2 with the ASPEN-TIMEGCM model runs shows reasonable agreement only during quiet conditions. However, the large foF2 enhance-ment (∼20 MHz at Okinawa at about 14:00 UT (23:00 LT)) during the nighttime on 30–31 March, is not reproduced by the model. The model foF2 results differ considerably during the storm and recovery periods and indicate much stronger negative phase at all the stations, particularly at the low-latitude stations (Fig. 2a).
It should be mentioned that, in Figs. 2 and 4, the F-region height variations obtained by the model are hmF2 (F-region peak height), whereas the observed F-region height varia-tions are hpF2, except for ELA for which we have hmF2.
Y. Sahai et al.: Longitudinal differences observed in the ionospheric F-region 3227 It should be mentioned that the determination of the peak
F-layer height (hmF2) using hpF2 is less reliable during the daytime (the altitude hpF2 is overestimated with respect to the true altitude of the maximum of the layer hmF2) than at nightime, where hpF2≈hmF2 (Danilov and Morozova, 1985). It is observed that there is a reasonable agreement between the variations of hmF2 from the model and the mea-sured hpF2/hmF2 during the quiet times. During the dis-turbed period, some of the observed F-region height varia-tions are well reproduced by the model results. During the disturbed period sometimes the model hmF2 is even lower than h0F (e.g. Fig. 2b (OKI) around 00:00 UT 1 April and Fig. 4b (ELA and WAK) between 12:00–18:00 UT. This is because the auroral inputs to the model extend to lower lati-tudes than those which possibly occurred in the storm. When the model hmF2 reaches about 200 km, it means we have au-roral precipitation at that location.
The discrepancies noted above indicate that possibly some of the model input parameters may need a re-evaluation. The low-latitude ionosphere is subject to winds, and to electric fields both from the dynamo and penetrating from high lati-tudes. The model includes winds and dynamo electric fields, but not penetration fields, which may help to explain some of the discrepancies between the model and the observa-tions. It should be pointed out that the variations in h0F at the low-latitude station SJC show rapid uplifting, indicating the prompt penetration of disturbance electric field at about 06:00 UT on 31 March (Fig. 2b). In a later paper, a detailed analysis of the magnetic variations in the Brazilian sector may help to identify the magnitude of penetrating E-field ef-fects.
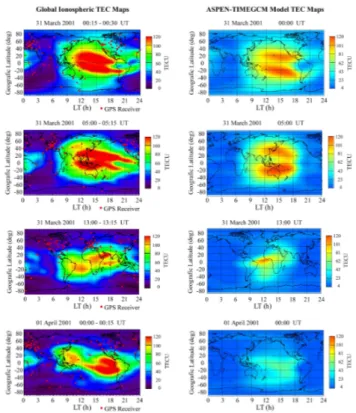
2.5 Global ionospheric TEC variations
Figure 5 shows four “Global Ionospheric TEC (total electron content)” maps (Mannucci et al., 1998; Iijima et al., 1999) obtained from about 100 global positioning system (GPS) ground-based receiver stations on 31 March and 1 April. The global TEC maps are for the time periods 00:15–00:30 UT (just before the storm), 05:00–05:15 (about 4 h after the storm onset; during the first peak) and 13:00–13:15 UT (about 12 h after the storm onset; during the second peak with a major enhancement in the ring current shown in Dst on
31 March) and 00:00–00:15 UT on 1 April (about 23 h from the storm onset; recovery phase). A perusal of the sequence of the global ionospheric TEC maps very clearly indicates widespread longitudinal-latitudinal changes in the TEC dis-tribution with the development of the storm, associated with the dissipation into the ionosphere/thermosphere system of the solar wind energy deposited into the polar cap region (e.g. Ho et al., 1998). Figure 5 also shows the ASPEN-TIMEGCM model map plots for TEC from 31 March and 1 April. It should be mentioned that the model stops at al-titudes of about 600 km, so it is not truly TEC as it is only integrated up to about 600 km. The comparison between the observed TEC and the model results is fairly good. How-ever, it is noted that the model TEC is too low on 1 April;
Figure 5
Fig. 5. Global ionospheric TEC maps obtained from GPS network for the time periods 00:15–00:30 UT, 05:00–05:15 UT and 13:00– 13:15 UT on 31 March and 00:00–00:15 UT on 1 April 2001. Also, the ASPEN-TIMEGCM model map plots for TEC from 31 March and 1 April are shown.
this indicates that the model is being forced too hard by the high-latitude forcing, and the storm effect in the model is too strong. This is consistent with all the foF2 plots in Figs. 2a and 4a, showing that the model foF2 is much lower than the ionosonde values.
3 Conclusions
The ionospheric sounding measurements from two low-latitude stations (S˜ao Jos´e dos Campos, Brazil and Okinawa, Japan) and two mid-latitude stations (El Arenosillo, Spain and Wakkanai, Japan), obtained during the period 30 March to 1 April 2001, which included the major magnetic storm on 31 March, have been analyzed to study the longitudinal differences in the response of the F-region in the Brazilian, Spanish and Japanese sectors. The principal results are as follows:
1. During the disturbed period, only OKI exhibited pos-itive phase (daytime) shown in peak electron density in the F-region. All other stations showed negative phase, with OKI showing strong negative phase during the nighttime.
2. During the storm-time first peak (09:00 UT on 31 March), SJC and ELA showed rapid and large
3228 Y. Sahai et al.: Longitudinal differences observed in the ionospheric F-region uplifting of the F-region. The uplifting at ELA was a
few hours earlier than that at SJC.
3. During the storm-time second peak (22:00 UT on 31 March) with major enhancement in the ring current, all the stations showed near simultaneous time large F-region height variations during the storm, possibly caused by the global thermospheric wind circulation as-sociated with the Joule heating in the auroral zone. 4. Only WAK showed spread-F (range) during the storm. 5. A comparison of the observed ionospheric
parame-ters (h0F and foF2) in the two longitudinal zones (1. Japanese and 2. Brazilian-Spanish) shows both simi-larities and differences associated with the geomagnetic disturbances. Some latitudinal differences are also ob-served in the two longitudinal zones.
6. Widespread changes in global ionospheric TEC distri-bution during the storm were observed.
7. A comparison of the ionospheric sounding observations with the ASPEN-TIMEGCM model runs shows reason-able agreement during the quiet period. During the dis-turbed period, some of the observed F-region height variations are well reproduced by the model results. The model foF2 and TEC results differ considerably (indi-cating much stronger negative phase) during the recov-ery period.
Acknowledgements. Thanks are due to J. Kozyra for some helpful comments and R. Marins de Carvalho for kindly providing the mag-netometer data obtained at the Vassouras Magnetic Observatory, Vassouras, Brazil. The work was partially supported by funds from FAPESP through process numbers 2002/12427-4 and 2002/01631-5, and CNPq process number 301222/2003-7. The research con-ducted at the Jet Propulsion Laboratory, California Institute of Tech-nology, in under a contract with the National Aeronautics and Space Administration, USA. G. Crowley was supported by NASA grant NAG5-10059.
Topical Editor M. Lester thanks T. K. Pant and another referee for their help in evaluating this paper.
References
Abalde, J. R., Fagundes, P. R., Bittencourt, J. A., and Sahai, Y.: Observations of equatorial F region plasma bubbles using simul-taneous OI 777.4 nm and OI 630.0 nm imaging: New results, J. Geophys. Res., 106, 30 331–30 336, 2001.
Akasofu, S.-I.: Diagnostics of the magnetosphere using geomag-netic, auroral and airglow phenomena, Ann. Geophys., 26, 443– 457, 1970.
Basu, S., Basu, Su., Groves, K. M., Yeh, H.-C., Su, S.-Y., Rich, F. J., Sultan, P. J., and Keskinen, M. J.: Response of the equato-rial ionosphere in the South Atlantic region to the great magnetic storm of July 15, 2000, Geophys. Res. Lett., 28, 3577–3580, 2001a.
Basu, Su., Basu, S., Valladares, C. E., Yeh, H.-C., Su, S.-Y., Mackenzie, E., Sultan, P. J., Aarons, J., Rich, F. J., Doherty, P.,
Groves, K. M., and Bullet, T. W.: Ionospheric effects of major magnetic storms during the International Space Weather Period of September and October 1999: GPS observations, VHF/UHF scintillations, and in situ density structures at middle and equa-torial latitudes, J. Geophys. Res., 106, 30 389–30 413, 2001b. Bittencourt, J. A., Sahai, Y., Fagundes, P. R., and Takahashi, H.:
Simultaneous observations of equatorial F-region plasma deple-tions and thermospheric winds, J. Atmos. S-P, 59, 1049–1059, 1997.
Buonsanto, M. J.: Ionospheric storms – A review, Space Sci. Rev., 88, 563–601, 1999.
Burns, A. G. and Killeen, T. L.: The equatorial neutral thermo-spheric response to geomagnetic forcing, Geophys. Res. Lett., 19, 977–980, 1992.
Bust, G. S., Gaussiran II, T. L., and Coco, D. S.: Ionospheric ob-servations of the November 1993 storm, J. Geophys. Res., 102, 14 293–14 304, 1997.
Crowley, G. and McCrea, I. W.: A synoptic study of TIDs ob-served in the UK during the first WAGS campaign, October 10– 18, 1985, Radio Sci., 23, 905–917, 1988.
Crowley, G. and Williams, P. J. S.: Observation of the source and propagation of atmospheric gravity waves, Nature, 328, 231– 233, July 16, 1987.
Crowley, G., Jones, T. B., and Dudeney, J. R.: Comparison of short period TID morphologies in Antarctica during geomagnetically quiet and active intervals, J. Atmos. Terr. Phys., 49, 155, 1987. Danilov, A. D. and Morozova, L. D.: Ionospheric storms in the F2
region, Morphology and Physics (Review), Geomag. Aeron., 25, 593–605, 1985.
Fejer, B. G. and Kelley, M. C.: Ionospheric irregularities, Rev. Geo-phys. Space. Phys., 18, 401–454, 1980.
Fejer, B. G. and Scherliess, L.: Time dependent response of equa-torial ionospheric electric fields to magnetic disturbances, Geo-phys. Res. Lett., 22, 851–854, 1995.
Foster, J. C. and Rich, F. J.: Prompt midlatitude electric field ef-fects during severe geomagnetic storms, J. Geophys. Res., 103, 26 367–26 372, 1998.
Fuller-Rowell, T. J., Codrescu, M. V., Fejer, B. G., Borer, W., Mar-cos, F., and Anderson, D. N.: Dynamics of the low-latitude ther-mosphere: queit and disturbed conditions, J. Atmos. S-P, 59, 1533–1540, 1997.
Grant, I. F., MacDougall, J. W., Ruohoniemi, J. M., Bristow, W. A., Sofko, G. J., Koehler, J. A., Danskin, D., and Andre, D.: Com-parison of plasma flow velocities determined by the ionosonde Doppler drift technique, SuperDARN radars, and patch motion, Radio Sci., 30, 1537–1549, 1995.
Hajkowicz, L. A.: A global study of large scale traveling iono-spheric disturbances (TIDS) following a step-like onset of auro-ral substorms in both hemispheres, Planet. Space Sci., 38, 913– 923, 1990.
Heelis, R. A., Lowell, J. K., and Spiro, R. W.: A model of the high latitude ionospheric convection pattern, J. Geophys. Res., 87, 6339–6345, 1982.
Ho, C., Mannucci, M., Lindqwister, U. J., Pi, X., Tsurutani, B. T., Sparks, L., Iijima, B. A., Wilson, B. D., Harris, I., and Reyes, M. J.: Global ionospheric TEC variations during January 10, 1997 storm, Geophys. Res. Lett., 25, 2589–2592, 1998.
Hocke, K. and Schlegel, K.: A review of atmospheric gravity waves and travelling ionospheric disturbances: 1982–1995, Ann. Geo-phys., 14, 917–940, 1996.
Iijima, B. A., Harris, I. L., Ho, C. M., Lindqwister, U. J., Man-nucci, A. J., Pi, X., Reyes, M. J., Sparks, L. C., and Wilson, B.
Y. Sahai et al.: Longitudinal differences observed in the ionospheric F-region 3229 D.: Automated daily process for global ionospheric total
elec-tron content maps and satellite ocean altimeter ionospheric cali-bration based on Global Positioning System data, J. Atmos. S-P, 61, 1205–1218, 1999.
Immel, T. J., Crowley, G., and Craven, J. D.: Dayside enhance-ments of thermospheric O/N2 following a magnetic storm onset, J. Geophy. Res., 106, 15 471–15 488, 2001.
Kelley, M. C., Garcia, F., Makela, J., Fan, T., Mak, E., Sai, C., and Alcocer, D.: Highly structured tropical airglow and TEC signa-ture during strong geomagnetic activity, Geophys. Res. Lett., 27, 465–468, 2000.
Killeen, T. L., Hays, P. B., Carignan, G. R., Heelis, R. A., Hanson, W. B., Spencer, N. W., and Brace, L. H.: Ion-neutral coupling in the high-latitude F region: Evaluation of ion heating terms from Dynamic Explorer 2, J. Geophys. Res., 89, 7495–7508, 1984. Lee, C.-C., Liu, J.-Y., Reinisch, B. W., Lee, Y.-P., and Liu, L.: The
propagation of traveling atmospheric disturbances observed dur-ing the April 6–7, 2000 ionospheric storm, Geophys. Res. Lett., 29, doi:10.1029/2001GL013516, 2002.
Lee, J. J., Min, K. W., Kim, V. P., Hegai, V. V., Oyama, K.-I., Rich, F. J., and Kim, J.: Large density depletions in the nighttime upper ionosphere during the magnetic storm of July 15, 2000, Geophys. Res. Lett., 29, doi:10.1029/2001GL013991, 2002.
Mannucci, A. J., Wilson, B. D., Yuan, D. N., Ho, C. M., Lindqwis-ter, U. J., and Runge, T. F.: A global mapping technique for GPS-derived ionospheric total electron content measurements, Radio Sci., 33, 565–583, 1998.
Mendillo, M., Baumgardner, J., Pi, X.-Q, Sultan, P. J., and Tsunoda, R.: Onset conditions for equatorial spread-F, J. Geophys. Res., 97, 13 865–13 876, 1992.
Musman, S., Mader, G., and Dutton, C. E.: Total electron content changes in the ionosphere during the January 10, 1997 distur-bance, Geophys. Res. Lett., 25, 3055–3058, 1998.
Pi, X., Mendillo, M., Hughes, W. J., Buonsanto, M. J., Sipler, D. W., Kelly, J., Zhou, Q., Lu, G., and Hughes, T. J.: Dynamical ef-fects of geomagnetic storms and substorms in the middle-latitude ionosphere: An observational campaign, J. Geophys. Res., 105, 7403–7417, 2000.
Prolss, G. W.: Common origin of positive ionospheric storms at middle latitudes and the geomagnetic activity effect at low lati-tudes, J. Geophys. Res., 98, 5981–5991, 1993.
Rice, D. D., Hunsucker, R. D., Lanzerotti, L. J., Crowley, G., Williams, P. J. S., Craven, J. D., and Frank, L.: An observation of atmospheric gravity wave cause and effect during the October 1985 WAGS campaign, Radio Sci., 23, 919–930, 1988. Roble, R. G. and Ridley, A.:
Thermosphere-Ionosphere-Mesosphere-Electro Dynamics General Circulation Model (TIME-GCM): Equinox solar cycle minimum simulations (300– 500 km), Geophys. Res. Lett., 22, 417–420, 1994.
Sahai, Y., Shiokawa, K., Otsuka, Y., Ihara, C., Ogawa, T., Igarashi, K., Miyazaki, S., and Saito, A.: Imaging observations of midlat-itude ionospheric disturbances during the geomagnetic storm of February 12, 2000, J. Geophys. Res., 106, 24 481–24 492, 2001. Sahai, Y., Fagundes, P. R., Bittencourt, J. A., and Abdu, M. A.: Occurrence of large scale equatorial F-region plasma depletions during geo-magnetic storm, J. Atmos. S-P, 60, 1593–1604, 1998. Sastri, J. H., Rao, H. N. R., and Ramesh, K. B.: Response of equa-torial ionosphere to the transit interplanetary magnetic cloud of January 13–15, 1967: Transient disturbance in F region, Planet. Space Sci., 40, 519–534, 1992.
Sastri, J. H., Niranjan, K., and Subbarao, K. S. V.: Response of the equatorial ionosphere in the Indian (midnight) sector to the severe magnetic storm of July 15, 2000, Geophys. Res. Lett., 29, doi:10.1029/2002GL015133, 2002.
Shiokawa, K., Otsuka, Y., Ogawa, T., Igarashi, K., Miyazaki, S., Rich, F. J., Saito, A., and Yumoto, K.: Comprehensive imag-ing observations of midlatitude ionospheric disturbances dur-ing storm time substorm, J. Geophys. Res., 105, 27 067–27 080, 2000.
Shiokawa, K., Otsuka, Y., Ogawa, T., Balan, N., Igarashi, K., Ridley, A. J., Knipp, D. J., Saito, A., and Yumoto, K.: A large-scale traveling ionospheric disturbance during the mag-netic storm of 15 September 1999, J. Geophys. Res., 107, doi:10.1029/2001JA000245, 2002.
Skoug, R. M., Thomsen, M. F., Henderson, M. G., Funsten, H. O., Reeves, G. D., Pollock, C. J., Jahn, J.-M., McComas, D. J., Mitchell, D. G., Brandt, P. C., Sandel, B. R., Clauer, C. R., and Singer, H. J.: Tail-dominated storm main phase: 31 March 2001, J. Geophys. Res., 108, A6, 1259, doi:10.1029/2002JA009705, 2003.
Sobral, J. H. A., Abdu, M. A., Gonz´alez, W. D., Tsurutani, B. T., Batista, I. S., and Clua de Gonz´alez, A. L.: Effects of intense storms and substorms on the equatorial ionosphere/thermosphere system in the American sector from ground-based and satellite data, J. Geophys. Res., 102, 14 302–14 313, 1997.
Srivastava, N. and Venkatakrishnan, P.: Relation between CME speed and geomagnetic storm intensity, Geophys. Res. Lett., 29, doi:10.1029/2001GL013597, 2002.
Stephan, A. W., Colerio, M., Mendillo, M., Reinisch, B. W., and Anderson, D.: Suppression of equatorial spread F by sporadic E, J. Geophys. Res., 107, A2, doi:10.1029/2001JA000162, 2002. Turunen, T. and Mukunda Rao, M.: Examples of the influence of
strong magnetic storms on the equatorial F-layer, J. Atmos. Terr. Phys., 42, 323–330, 1980.
VanZandt, T. E., Peterson, V. L., and Laird, A. R.: Electromagnetic drift of the midlatitude F2layer during a storm, J. Geophys. Res.,
76, 278–281, 1971.
Weimer, D. R.: A flexible, IMF dependent model of high-latitude electric potential having “space weather” applications, Geophys. Res. Lett., 23, 2549–2552, 1996.