HAL Id: hal-00330321
https://hal.archives-ouvertes.fr/hal-00330321
Submitted on 26 Jun 2007
HAL is a multi-disciplinary open access
archive for the deposit and dissemination of
sci-entific research documents, whether they are
pub-lished or not. The documents may come from
teaching and research institutions in France or
abroad, or from public or private research centers.
L’archive ouverte pluridisciplinaire HAL, est
destinée au dépôt et à la diffusion de documents
scientifiques de niveau recherche, publiés ou non,
émanant des établissements d’enseignement et de
recherche français ou étrangers, des laboratoires
publics ou privés.
carbon turnover in grasslands
K. Klumpp, J. F. Soussana, R. Falcimagne
To cite this version:
K. Klumpp, J. F. Soussana, R. Falcimagne. Long-term steady state 13C labelling to investigate soil
carbon turnover in grasslands. Biogeosciences, European Geosciences Union, 2007, 4 (3), pp.385-394.
�hal-00330321�
Biogeosciences, 4, 385–394, 2007 www.biogeosciences.net/4/385/2007/ © Author(s) 2007. This work is licensed under a Creative Commons License.
Biogeosciences
Long-term steady state
13
C labelling to investigate soil carbon
turnover in grasslands
K. Klumpp, J. F. Soussana, and R. FalcimagneINRA, UR874 Grassland Ecosystem Research, Clermont-Ferrand, France
Received: 2 February 2007 – Published in Biogeosciences Discuss.: 7 March 2007 Revised: 7 June 2007 – Accepted: 11 June 2007 – Published: 26 June 2007
Abstract. We have set up a facility allowing steady state
13CO
2labeling of short stature vegetation (12 m2) for
sev-eral years. 13C labelling is obtained by scrubbing the CO2
from outdoors air with a self-regenerating molecular sieve and by replacing it with13C depleted (−34.7±0.03‰) fossil-fuel derived CO2The facility, which comprises 16 replicate
mesocosms, allows to trace the fate of photosynthetic carbon in plant-soil systems in natural light and at outdoors tem-perature. This method was applied to the study of soil or-ganic carbon turnover in temperate grasslands. We tested the hypothesis that a low disturbance by grazing and cutting of the grassland increases the mean residence time of carbon in coarse (>0.2 mm) soil organic fractions.
Grassland monoliths (0.5×0.5×0.4 m) were sampled from high and low disturbance treatments in a long-term (14 yrs) grazing experiment and were placed during two years in the mesocosms. During daytime, the canopy enclosure in each mesocosm was supplied in an open flow with air at mean CO2 concentration of 425 µmol mol−1 and δ13C of
−21.5±0.27‰. Fully labelled mature grass leaves reached a
δ13C of −40.8 (±0.93) and −42.2‰ (±0.60) in the low and high disturbance treatments, respectively, indicating a mean
13C labelling intensity of 12.7‰ compared to unlabelled
control grass leaves. After two years, the delta13C value of total soil organic matter above 0.2 mm was reduced in aver-age by 7.8‰ in the labelled monoliths compared to controls. The isotope mass balance technique was used to calculate for the top (0–10 cm) soil the fraction of13C labelled carbon in the soil organic matter above 0.2 mm (i.e. roots, rhizomes and particulate organic matter). A first order exponential de-cay model fitted to the unlabelled C in this fraction shows an increase in mean residence time from 22 to 31 months at low compared to high disturbance. A slower decay of roots, rhizomes and particulate organic matter above 0.2 mm
Correspondence to: K. Klumpp
is therefore likely to contribute to the observed increased in soil carbon sequestration in grassland monoliths exposed to low disturbance.
1 Introduction
About two-thirds of terrestrial C is found belowground and the amount of organic carbon that is stored in the soil (1.5×10¹⁸g C) is globally about twice that of the total C in atmosphere (Schlesinger, 1997). Below-ground C generally has slower turnover rates than above-ground carbon, as most of the organic carbon in soils (humic substances) is produced by the transformation of plant litter into more persistent or-ganic compounds (Jones and Donelly, 2004). Transforma-tion of plant litter is a key process of the carbon and nutrient cycles, which drives C mineralization and C accumulation in the soil organic matter (Tateno and Chapin, 1997). De-trital carbon accumulation accounts for most of an ecosys-tem’s capacity to store organic carbon belowground within a few years and is largely conditioned by the plant turnover rate (Cebrian and Duarte, 1995). Root litter transformation is an important determinant of the carbon cycle in grassland ecosystems, which is affected both by the root litter qual-ity and by the rhizosphere activqual-ity (Personeni and Loiseau, 2004, 2005).
Carbon sequestration can be determined directly by mea-suring changes in C pools (Conant et al., 2001) and, or, by simulation (e.g. Smith et al., 2005). However, to gain further understanding on C turnover in different soil fractions, the use of radiocarbon tracers and of stable isotopes has proven to be essential (e.g. Trumbore, 2000; Verburg et al., 2004). Isotope techniques, often in combination with other meth-ods (e.g. gas exchange) stand out among the few tools avail-able to track C fluxes in terrestrial ecosystems. Carbon iso-topes have been used as tracers including radioactive short lived11C (half time 20.5 min) and long lived 14C (5760 yr)
(Stevenson, 1986), as well as stable 13C (Balesdent et al., 1988). The natural atmospheric14C activity can be used to date the accumulation of C in fractions with slow turnover time (>50 year). Artificial atmospheric14C activity, such as the “bomb14C” studies, can date shorter lived (>10 years) C pools from undisturbed soils (e.g. Trumbore, 2000).
Under the Kyoto Protocol (available at http://www.unfccc. de), biospheric sinks and sources of C can be taken into ac-count in attempts to meet “Quantified Emission Limitation or Reduction Commitments” (QELRCs) for the first com-mitment period (2008–2012). To better understand how land use and management factors affect carbon turnover in the short-term (<5 yrs), the fate of photosynthates in plant-soil systems should be traced at this time scale.
The development of the13C isotope mass balance tech-nique has allowed to calculate the amount of “new” carbon in soils after shifting cultivation from C3to C4plant species (or
conversely from C4to C3) (Balesdent et al., 1988; Conen et
al., 2006; Derner et al., 2006). However, this method cannot be applied to temperate and high latitude/altitude ecosystems which lack C4species.
Recently, novel approaches were developed by using CO2
enrichment experiments (FACE) to obtain a 13C depleted signature in plant-soil systems (e.g. Loiseau and Soussana, 1999; Personeni et al., 2004; Trueman and Gonzales-Meler, 2005; Dijkstra et al., 2004). However, this method cannot be used to investigate C cycling under ambient CO2.
13C pulse-labeling experiments in the field allow detailed
studies of the temporal relationships between carbon fixation and its delivery to a defined sink (e.g. exudates, soil biota) (Ostle et al., 2000). Nevertheless,13C pulse labeling stud-ies cannot be used to understand multi-year processes as the pulse is diluted over time.
To investigate the fate of carbon in plant-soil systems, we have further developed a steady-state13CO2 labeling
tech-nique, which was first used with seedlings grown hydroponi-cally or on sand in phytotrons (Del´eens et al., 1983; Schnyder et al., 1992, 2003).
This method has been applied to the mesocosm experi-ment previously described by Klumpp et al. (2007), showing reduced soil carbon sequestration at high compared to low disturbance. We have tested the hypothesis that a low dis-turbance by grazing and cutting of the grassland increases the mean residence time of carbon in coarse (>0.2 mm) soil organic fractions.
The aim of the present study was: i) to change during sev-eral months the13C isotope signature of photosynthates from plant-soil systems grown in natural light and at outdoors tem-perature using a steady state13CO2labelling facility; ii) to
apply this method to study the role of disturbance for soil carbon turnover in grassland ecosystems.
2 Materials and methods
2.1 Set-up of controlled system for long-term
13CO
2/12CO2labelling
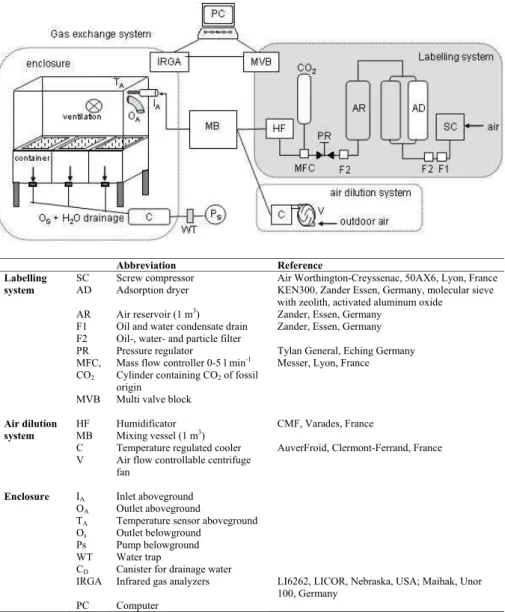
The facility is shown schematically in Fig. 1 and comprises four components: labeling system, air dilution, 16 meso-cosms and a gas exchange system (previously described by Klumpp et al., 2007). More precisely, ambient air is com-pressed, CO2and H2O of ambient air is scrubbed by passing
through a molecular sieve and then replaced by fossil-fuel derived CO2being depleted in13C by −21‰ compared to
outdoor air (δ13C −34.7±0.03‰). Thereafter, the13C de-pleted air is humidified, mixed with outdoor air, temperature regulated and distributed to canopy enclosures. The main parts of the labeling system are: a screw compressor, a self-regenerating adsorption dryer (Schnyder et al., 1992) gener-ating CO2free dry air at a rate of up to 5000 standard liters
per minute (SLPM) and a residual CO2below 1 µmol CO2
mol−1, an air tank, gas cylinders containing fossil fuel
de-rived CO2and a humidifier (1 m3; 1 m2cross corrugated
cel-lulose pads). The flow rates of the labeling system are con-trolled by pressure regulators and the CO2injection rate by
a mass flow meter (Tylan, 0–3 SLPM). During daytime, to regenerate the molecular sieve of the adsorbtion dryer, ap-proximately 30% of the CO2free dry air is diverted to the
adsorber chamber, where drying and regeneration alternated in 6 min cycles. At night time (one hour after sunset until one hour before sunrise), the supply of CO2free dry air was
stopped which allowed for a full regeneration of the adsorp-tion dryer.
The labeling system was coupled to an air dilution system. This allowed to vary the degree of13C labeling by mixing
13C depleted air with outdoor air in variable proportions and
to apply the labeling system to continental climate with hot summers (e.g. 38◦C during summer 2003). For air dilution, ambient air was sampled at a height of 3 m by a centrifuge fan at flow rates up to 400 L min−1. Then ambient air passed through a cooler (378 kWh) being automatically regulated by the temperature difference between enclosure outlets and ambient air. Finally, ambient air and13C-depleted air were mixed in a 1 m3metal box (Fig. 1). At the outlet of the mix-ing box, thermally insulated PVC pipes delivered the air to the 16 canopy enclosures.
2.1.1 Gas exchange measurement system
The gas exchange system was previously described and dis-cussed by Klumpp et al. (2007). Briefly, each open-flow canopy enclosure (Fig. 1) had an average flow rate between 500 and 650 L min−1 during day, which gave with the in-ternal volume of 742 L per enclosure an air exchange rate of 40–50 times per hour and a mean air residence time of 1 min 30 s. During night (one hour after sunset until one hour before sunrise), the flow rate was automatically reduced to
K. Klumpp et al.: Steady state13C labelling to investigate soil C turnover 387 Abbreviation Reference Labelling system Air dilution system Enclosure SC AD AR F1 F2 PR MFC, CO2 MVB HF MB C V IA OA TA Os Ps WT CD IRGA PC Screw compressor Adsorption dryer Air reservoir (1 m3 ) Oil and water condensate drain Oil-, water- and particle filter Pressure regulator
Mass flow controller 0-5 l min-1
Cylinder containing CO2 of fossil
origin Multi valve block Humidificator Mixing vessel (1 m3
) Temperature regulated cooler Air flow controllable centrifuge fan
Inlet aboveground Outlet aboveground
Temperature sensor aboveground Outlet belowground
Pump belowground Water trap
Canister for drainage water Infrared gas analyzers Computer
Air Worthington-Creyssenac, 50AX6, Lyon, France KEN300, Zander Essen, Germany, molecular sieve with zeolith, activated aluminum oxide
Zander, Essen, Germany Zander, Essen, Germany Tylan General, Eching Germany Messer, Lyon, France
CMF, Varades, France
AuverFroid, Clermont-Ferrand, France
LI6262, LICOR, Nebraska, USA; Maihak, Unor 100, Germany
Fig. 1. Long term steady state13C labelling facility to investigate carbon turnover in plant-soil system.
150–250 L min−1to regenerate the molecular sieves of ad-sorption dryer. The air flow in each enclosure was moni-tored continuously by an Averaging Pitot tube connected to a differential pressure gauge (Annubar Rosemount, Dietrich Standard Inc., North, USA).
From start of growing season, in April 2003, the CO2
concentration in enclosures was held from sunrise to sun-set, at 425±39 µmol mol−1 (mean ± s.d. of 30 min mea-surements, data not shown) by injection of13C depleted CO2
(−34.7±0.03‰). The mean CO2concentration inside the
en-closures was close to outdoors CO2concentration (mean
dif-ference of 13.2±9.5 µmol mol−1). During night time, the
enclosures were provided with outdoors air.
Following Casella and Soussana (1997) and Schapendonk et al. (1997), a fraction of the air flowing through the canopy enclosure of a mesocosms was pumped (KNF, Neuberger,
Germany) at a constant flow rate (3.5±0.2 L min−1) through
the soil column of each monolith. A small pressure head was maintained by the open-flow system. This pressure head and the depression caused by the pump eliminated back-diffusion of CO2 from the soil (e.g. Casella and Soussana,
1997). The flow rate though the soil column was adjusted according to preliminary trials, showing, that a flow rate of 3.5 L min−1 suppresses diffusion of soil CO2in the above
ground compartment without changing significantly soil res-piration rates. The CO2 concentration between outlet and
inlet of each enclosure was measured in differential mode every 20 min for a period of 1 min with an IRGA (LI6262, LICOR Nebraska, USA). Both the ambient air and the inlet air CO2concentrations were measured in absolute mode with
a second IRGA (Maihak, UNOR100, Germany). The two IRGAs were calibrated every two weeks with a 480 µL CO2
L−1 standard (Messer-Griesheim, Germany). Soil
respira-tion (Klumpp et al., 2007), soil temperature and air humidity of each enclosure as well as external PAR, temperature and humidity were monitored every 30 and 40 min, respectively. 2.1.2 Mesocosms
A mesocosm consists of an aboveground canopy enclosure of 0.74 m3(L 1.8×W 0.55×H 0.75 m) and a belowground com-partment of 0.30 m3(L 1.5×W 0.5×H 0.4 m). The canopy enclosure consists of a thin metal frame covered with a trans-parent polyethylene film (60 µ, transmitting 90% of the inci-dent PAR). One side in polycarbonate was equipped with two plastic tubes of 20 cm length and 8 cm inner diameter, used as air inlet and outlet (Fig. 1). Air mixing inside enclosures was provided by a fan. A temperature sensor and a gas sam-ple tube connected to an IRGA through a multi valve block allowed to monitor air temperature and CO2concentration at
the outlet.
The belowground compartment consisted of three metal containers, each with a volume of 0.14 m3(L 0.6×W 0.6×H 0.4 m) and a hole at the bottom for drainage water (Fig. 1). Each of these containers contained a grassland monolith (L 0.5×W 0.5×H 0.4 m) framed in a 5 side stainless steel box with drain holes at the bottom. Gaps between monolith and box were filled with a thermally insulating material (vermi-culite) and the surface was airtight sealed. The drainage holes of the three boxes were connected to a 20 L canister (Fig. 1). A pump connected to the canister pumped air con-tinuously through the soil column (see gas exchange mea-surements).
2.2 Experiment with grassland monoliths and management The grassland (soil, plant community structure) type and pro-cedures to select and extract grassland monoliths were de-scribed by Klumpp et al. (2007). Briefly, in June 2002, 56 monoliths (L 0.5×W 0.5×H 0.4 m) were extracted from two semi-natural grassland plots, being subjected to two con-trasted sheep grazing treatments during the last 14 years (Louault et al., 2005). Plot 1 was cut once and sheep grazed 4 times yr−1and, hence, represented a high disturbance regime (H). Plot 2 was sheep grazed only once a year (low dis-turbance regime, L). 24 monoliths of each treatment were placed in the 16 mesocosms (3 monoliths per enclosure). The enclosures were placed in natural light and at outdoors tem-perature and air humidity was adjusted to field conditions. 4 monoliths of each field treatment were kept outdoors as un-labelled controls. Depending on season, monoliths were wa-tered once to three times a week to target a soil volumetric water content of 33% corresponding to a soil water potential of ca. −30 kPa. All enclosures received the same irrigation volumes.
On five occasions per year, a high current disturbance was applied (24 monoliths in enclosures and 4 outdoor controls)
by cutting simultaneously at 5 cm stubble height and apply-ing artificial urine (5 g N m−2) consisting of 80% urea, 10%
hippuric acid, 5% allantoin N and 5% creatine N (Doak, 1952) in order to simulate N returns at grazing (see Klumpp et al., 2007). The harvested phytomass was separated into live and dead plant parts, oven dried and analysed for δ13C. For the low current disturbance monoliths were neither cut nor fertilised. At the start of the experiment, half of the en-closures of the low and high field disturbance were switched to the opposite disturbance treatment (Klumpp et al., 2007). 2.3 Monitoring of13C labeling
2.3.1 Supplied CO2
To determine δ13C of CO2 in canopy enclosures, air was
sampled every 14 days at enclosure outlets during daytime. Air samples were collected in 10 ml air-tight vials (BD Va-cutainer, UK) through a y-branch-connection (equipped with 2 needles) which was inserted in the continuous air flow go-ing to the IRGA. Vials were flushed for 2 min and analyzed monthly for δ13C (see13C isotope analyses).
2.3.2 Plant material
To monitor the13C-signature of the aboveground vegetation, 20 last mature green grass laminae (tip to ligula) were har-vested monthly in each enclosure and in outdoor controls by clipping. For each enclosure (and outdoor control) harvested leaves were oven dried and analyzed for their δ13C signature. 2.4 Soil organic matter fractions
Soil harvest and analyses were described by Klumpp et al. (2007). Briefly, soils were sampled once before start of 13C labeling and then 5 times during the experiment (in June and September 2003, April and September 2004 and April 2005). At each soil harvest a vertical soil slice (40×6×10 cm) was split into horizontal layers (0–10, 10–20 and 20–30 cm depth) in each mesocosm. The soil layers were air dried and the free organic matter fractions (OM) were sep-arated with water by passing through a series of three brass sieves with successive mesh sizes (1.0, 0.2 and 0.05 mm) (wet sieving). The remaining material in each sieve was sep-arated into the organic and mineral fraction by density flota-tion in water (Loiseau and Soussana, 1999; Six et al., 2001). Organic fractions were oven dried and analyzed for δ13C.
The δ13C of the total soil organic matter (SOM) above 0.2 mm, containing roots, rhizomes, coarse (>1 mm) and fine (1 mm>×>0.2 mm) particulate organic matter (POM) and aggregated organic matter (AOM, 0.2 mm>×>0.05 mm) was calculated by weighing the δ13C signature of each or-ganic fraction by its dry weight.
K. Klumpp et al.: Steady state13C labelling to investigate soil C turnover 389 2.5 13C-determination and calculation
2.5.1 13C-isotope analyses
Soil and vegetation samples were oven dried for 48 h at 60◦C, grounded to homogenous powder and analyzed for C-content and δ13C by elemental analyzer (EA1110, Carlo Erba, Mi-lano, Italy) coupled (Conflo III) with a mass spectrometer (Delta plus; FinniganMAT, Bremen, Germany). The δ13C in CO2from outdoors and labelling atmosphere were
mea-sured on a gas chromatography isotope ratio mass spectrom-eter (Gas system, Fisons, Loughborough, UK).
2.5.2 13C methods and terminology
Isotope ratios are reported as δ13C values relative to V-PDB standard (‰) and expressed as:
δ13C=[(Rsample−Rstandard)/Rstandard] ×103 (1)
where R is13C/12C ratio of the standard and sample. The discrimination (1) between product (δ13Csample) and source
was:
1 = [(δ13Csource−δ13Csample)/(1000+δ13Csample)]×103(2)
Gas samples and solid samples (soil and plant material) were measured against working laboratory standard gases, pre-viously calibrated against IAEA secondary standards. The fraction of “new” C derived from13C-labelling (f Cnew) in
soil organic fractions was calculated by a mass balance equa-tion:
f Cnew=(δ13Csample−δ13Ccontrol)/(δ13Cinput−δ13Ccontrol) (3)
Where δ13Csampleis the δ13C of the sample, δ13Ccontrolis the
δ13C value before start of labelling and δ13Cinputis the δ13C
value of a fully labelled plant derived material entering the soil (see Results).
2.5.3 Follow up of13C labeling
Additional to the monthly air sampling, we estimated (in 30 min time steps) the13C signature of CO2provided to
en-closures inlet (δ13Cestimated) with a mass balance equation:
δ13Cestimated=
qCO2air·δ13Cair+qCO2inject·δ13Cinject+qCO2decarb·δ13Cdecarb
qCO2air+qCO2inject+qCO2decarb
(4) where δ13Cair, δ13Cinject and δ13Cdecarb are the measured
δ13C values of CO2 from outdoors air, from CO2 cylinders
and from decarbonated air, respectively. qCO2air, qCO2inject
and qCO2decarb are the flow rates of CO2 supplied by
out-doors air, by CO2 injection from cylinders and by
decar-bonated air, respectively. qCO2inject was adjusted to 1.55
standard L min−1 by a mass flow-meter. qCO2air reached
2.01±0.14 standard L min−1 and qCO2decarb was equal to
zero (except for a few days above 35◦C in summer 2003).
2.6 Data analysis
Differences in 13C values for leaves and for gas samples were analyzed by repeated measure ANOVA. The amounts of “new” and of “old” C were fitted using non linear sion models with log transformed data. Since in these regres-sion models there were no significant differences among the two current disturbance treatments (p>0.95), the data from the two current disturbance treatments were pooled. Hence, we compare the two field disturbance treatments (H and L), each with 8 replicate enclosures.
3 Results and discussion
3.1 System accuracy and δ13C signature 3.1.1 13C labelling
After scrubbing CO2and H2O from ambient air, the residual
CO2concentration in CO2-free air was below 1 ppm, except
for some hours of high outdoor air temperature (>35◦C) dur-ing summer 2003 heat wave where residual CO2
concentra-tion could reach 10 ppm (data not shown).
Inlet and outlet δ13C values were compared for enclo-sures with vegetation during the experiment (i.e. monthly air sampling at noon) and for enclosures without vegetation. In the latter case, two enclosures were placed on an even gas-tight surface under the same conditions (air flow, natural light and temperature). The comparison resulted in a mean absolute δ13C-difference between enclosure inlet and outlet of −0.35±0.39‰ (P>0.5, repeated measure ANOVA) and
−0.19±0.47‰ (P>0.5) for enclosures with and without veg-etation, respectively (data not shown). These non significant
δ13C differences between enclosure inlet and outlet indicate that δ13C fractionation processes caused by photosynthesis were not measurable due to high air flows.
The CO2 concentration delivered by the labelling
sys-tem reached, on average, 425±5 µmol mol−1(daily mean,
±s.e.). However, due to mixing with outdoors air, the CO2
concentration at enclosure inlet followed a seasonal cycle, characterized by a higher CO2concentration is higher in
win-ter than in summer (e.g. Pataki et al., 2004) (Fig. 2a).
13C fractionation processes during photosynthesis
mod-ify instantly the δ13C of CO2(O’Leary 1981), thereby the
CO2in the atmosphere surrounding the plants becomes13C
enriched relative to the CO2 at the inlet. In a well-mixed
gas exchange enclosure, the13C signature of CO2sensed by
plants during photosynthesis corresponds to the δ13C mea-sured at the enclosure outlet (Evans et al., 1986; Schnyder et al., 2003). In our experiment, the δ13C measured at enclo-sure outlet indicated13C depletion in winter and enrichment in summer time (Fig. 2b). This was explained by CO2mixing
with outdoors air, which contributed on average to 57% of the CO2flux supplied to the enclosures. The CO2from outdoors
air (mean δ13C −11.4) had a depleted13C signature from
d e lt a 1 3 C O2 (p e rm ill ) -35 -30 -25 -20 -15 C O2 ( µ m o l m o l -1 ) 350 400 450 -24 -22 -20 -18 A B C year 2003 - 2005
Mar Jul Nov Mar Jul Nov Mar -49 -42 -35 -28 labelled leaves unlabelled leaves D measured CO2 at inlet measured δ 13C at oulet estimated δ 13 C at oulet
Fig. 2. (A) Measured CO2concentration at the canopy enclosure
inlet, (B) δ13C at canopy enclosure outlet, (C) estimated δ13C of CO2 supplied to canopy enclosure inlet and (D) δ13C of labelled
C3grass leaves during experimental period (April 2003 to March 2005) and of unlabelled C3control grasses grown outdoors. Data
are means (±SE) of 16, 14 and 4 replicates for labelled C3and
un-labelled C3controls, respectively. Dotted lines represent the mean
δ13C values of supplied CO2(−21.5‰) (A, B) and of C3leaves of
labelled (−41.4‰) and unlabelled control (−28.7‰) plants (D).
fossil fuel combustion and plant/soil respiration in winter time and an enriched13C signature from plant photosynthe-sis in summer and spring time (Pataki et al., 2004). The plant supplied CO2had on average a δ13Cofferedof −21.5±0.27‰
during the two growth periods.
The calculated labelling intensity, δ13Cestimated (Fig. 2c),
and the measured δ13C at the enclosure outlet did not dif-fer significantly during the time course of the experiment
(P>0.1; repeated measure ANOVA, data not shown, absolute
δ13C difference of −0.47±0.5‰). Therefore, even during periods without direct δ13C analyses, the labelling intensity can be estimated by calculating δ13Cestimated. The seasonal
pattern of δ13Cestimated, which was close to the monthly
mea-sured δ13C at enclosure outlet (Fig. 2b) and was most sus-ceptible to changes in δ13C of outdoor air (δ13Cair). In our
experiment the δ13C of outdoors air was in average −11.4‰ due to urban activity and could not be controlled by the ex-perimental set up.
In our experiment, a small pressure head was maintained in the aboveground compartment by the open-flow system and air was sampled from the soil, which eliminated back-diffusion of CO2from the soil surface. This may have
dis-turbed the O2and CO2concentration profile in the soil.
Nev-ertheless, the CO2concentration at the outlet of the
below-ground compartment varied between 1000 and 2000 ppm and was thus far above the concentration inside the shoot enclo-sure. We have used a low air flow rate (3.5 L min−1) and
a well structured sandy loam (50% sand) soil with a large macroporosity. Therefore, only 4–6% of the air filled pore space was sampled each minute, which reduced the distur-bance of the soil gas concentration profiles.
3.1.2 Plant material
The C3grass leaves harvested each month had mean δ13C
values of −41.4±0.67 and −28.7±0.39‰ for13C-labelled and control monoliths, respectively (Fig. 2d, means of April to November 2004). The C3grass leaves grown in labelled
mesocosms were therefore more depleted in13C (P<0.001; repeated measure ANOVA) than unlabelled controls grown outdoors. The lower δ13C values of C3 leaves compared to
air surrounding the leaves indicated the selectivity for12C (i.e. discrimination 1, O’Leary, 1981) of the carbon fixing enzyme Rubisco. The mean discrimination (113C) over the experimental period reached 17.0±0.6 (April 2003 to April 2005). This was irrespective of the disturbance level by cut-ting in the mesocosms (P>0.1, repeated measure ANOVA, data not shown). Labelled and control leaves showed a sea-sonal pattern (Fig. 2d), being isotopically enriched in sum-mer (−40.4±0.3‰ in the second year) and depleted in win-ter (−44.0±0.6‰), indicating changes in plant metabolism induced by abiotic factors such as water stress, high temper-atures and high radiation intensities which decrease stomatal conductance (Farquhar et al., 1989; Brugnoli and Farquhar, 2000). Interestingly, seasonal changes in δ13C were simi-lar inside and outside (controls) of the labelled mesocosms (Fig. 2d). Hence, during the experiment, the mean change in δ13C signature of C3grass leaves caused by labelling was
equal to −13.6±0.7‰. This shows that the labelling facil-ity generated a fairly constant change in delta13C signature of leaves, despite seasonal variations, occurring in both, out-doors and inside the mesocosms.
K. Klumpp et al.: Steady state13C labelling to investigate soil C turnover 391
month after start of 13C labelling
0 5 10 15 20 25 d e lt a 1 3 C o rg a n ic f ra c ti o n > 0 .2 m m -38 -36 -34 -32 -30 -28 -26
Fig. 3. Changes of the δ13C of total soil organic matter above 0.2 mm (SOM>0.2 mm, including roots, rhizomes and particulate organic matter) in the top soil (0–10 cm) during the labelling ex-periment. Monoliths acclimated to low (solid symbols) and to high (open symbols) field disturbance. Data are means ±SE of 8 repli-cate mesocosms.
The mean δ13C of fully labelled plant shoots reached
−41.4‰. Several studies reported a δ13C difference of 1– 2‰ between roots and shoots in grass plants grown under controlled and field conditions (Klumpp et al., 2005; Hobbie and Werner, 2004; Schweizer et al., 1999), showing that roots are isotopically enriched compared to shoots. Accordingly, we set the δ13C
input of “new” C entering the belowground
compartment at a δ13C of −40.4‰, which corresponds to a
13C enrichment of 1‰ of roots compared to shoots.
3.2 Effects of grassland disturbance level on soil carbon turnover
Klumpp et al. (2007) have shown that belowground carbon storage was higher for monoliths previously acclimated for 14 yrs to low than to high disturbance by grazing and cutting. Notably, values for belowground carbon storage calculated from the balance of gas exchanges were consistent with the increment in soil organic carbon content directly measured during the experiment.
Changes in δ13C values of SOM>0.2 mm (i.e. roots, rhi-zomes and particulate organic matter) in the top soil layer (0– 10 cm) during the labelling experiment are shown in Fig. 3. Interestingly, initial δ13C values of SOM>0.2 mm were sig-nificantly different (P<0.001) between monoliths adapted to high (−28.7±0.10‰) and to low (−27.4±0.14‰) distur-bance, illustrating the effects of grassland management by grazing and cutting on plant community structure and car-bon cycling (Hooper and Vitousek, 1998). Plant commu-nity structure was suggested to affect13C signature of root litter in grasslands (Dijkstra et al., 2004). Personeni and
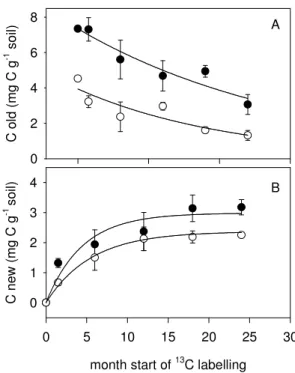
C o ld ( m g C g -1 s o il) 0 2 4 6 8
month start of 13C labelling
0 5 10 15 20 25 30 C n e w ( m g C g -1 s o il) 0 1 2 3 4 A B
Fig. 4. Changes in the contents (mg C g−1dry soil) of “old” (A) and “new” C (B) in the SOM above 0.2 mm of the top soil (0–10 cm) layer after start of13C labelling, for monoliths acclimated for 14 yrs to low (full symbols) and high (open symbols) disturbance in the field. The fate of “old” C and the input of “new” C were fitted to first order exponential decay and rise to maximum models, respectively: Cold=a.e−k.t; Cnew=a′.(1−e−k
′.t
) (abbreviations and coefficients of regression lines see Table 1).
Loiseau (2004) reported more depleted δ13C values for par-ticulate organic matter fractions (POM) of Lolium perenne compared to Dactylis glomerata. Possible reasons for these differences in isotopic signatures in grasslands exposed to contrasted disturbance levels are: i) contrasted decomposi-tion rates of distinct biochemical components of plant litter (Melillo et al., 1989; Agren et al., 1996) and ii) the contri-bution and δ13C values of different particle sizes to soil OM (Balesdent et al., 1988; Personeni and Loiseau, 2004). Find-ings from the same field site, showing a higher cellulose con-tent in the plant material at low compared to high disturbance (Picon-Cochard et al., 2004) confirm the role of differences in biochemical components such as cellulose, which is en-riched in13C (Schweizer et al., 1999; Gleixner et al., 1993). Moreover, monoliths adapted to high disturbance in the field had a higher fraction of particulate OM (0.2>×>0.05 mm) (P<0.01, data not shown) with a more depleted δ13C value than monoliths adapted to low disturbance (data not shown). During the 24 months of labelling, the gradual δ13C deple-tion of SOM (>0.2 mm) in the upper most 10 cm (Fig. 3) in-dicated that the soil litter continuum was steadily filled with “new”13C-depleted carbon (P<0.001). Similar trends were found for the 10–20 cm and 20–30 cm soil depths, where
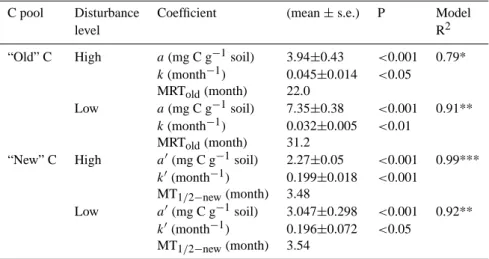
Table 1. First order exponential models of “old” C decay and “new” C accumulation in pasture monoliths adapted to low (L) and high (H)
disturbance and continuously labelled with13C. The fate of “old” C (Cold) and the accumulation of “new” C (Cnew) into SOM (>0.2 mm) in
0–10 cm soil layer were fitted to first order exponential decay and rise to maximum models, respectively: Cold=a.e−k.t; Cnew=a′.(1−k′.t ),
where t is time in months; a is the initial amount of old C at t =0 (start of the labelling experiment); a′is the potential accumulation of “new” C (mg C g−1soil) in the compartment. k is the first order decay constant of “old” organic C. k′is the rate constant of accumulation of “new” C. Mean residence time of “old” C (MRTold, months) was calculated as: MRTold=1/k ; the time for half-potential accumulation of “new” C
(MT1/2−new) was calculated as: MT1/2−new=ln(1/2)/k’. Results are means of 8 replicates per treatment.
C pool Disturbance Coefficient (mean ± s.e.) P Model
level R2
“Old” C High a (mg C g−1soil) 3.94±0.43 <0.001 0.79*
k (month−1) 0.045±0.014 <0.05
MRTold(month) 22.0
Low a (mg C g−1soil) 7.35±0.38 <0.001 0.91**
k (month−1) 0.032±0.005 <0.01
MRTold(month) 31.2
“New” C High a′(mg C g−1soil) 2.27±0.05 <0.001 0.99***
k′(month−1) 0.199±0.018 <0.001
MT1/2−new(month) 3.48
Low a′(mg C g−1soil) 3.047±0.298 <0.001 0.92**
k′(month−1) 0.196±0.072 <0.05
MT1/2−new(month) 3.54
the δ13C also declined towards more 13C depleted values (P<0.001, data not shown). SOM above 0.2 mm (P<0.001) had less negative δ13C values in monoliths adapted to low compared to high disturbance, suggesting a higher fraction of “new” (13C depleted) carbon in the high compared to low disturbance treatment (Fig. 3).
The fate of “old” C (unlabelled) and the input of “new” C (13C labelled) (mg C g−1soil) into SOM (>0.2 mm) were fitted to first order exponential decay (Loiseau and Soussana, 1999; Personeni and Loiseau, 2005) and rise to maximum models, respectively (Fig. 4):
Cold=ae−k.t (5)
Cnew=a′(1 − e−k ′.t
) (6)
where t is time in months; a is the initial amount of old C at t=0 (start of the labelling experiment); a′is the potential
accumulation of “new” C (mg C g−1 soil) in the
compart-ment. k is the first order decay constant of “old” organic C that leaves the OM compartment above 0.2 mm. k′is the rate constant of accumulation of “new” C in the soil in SOM above 0.2 mm. The mean residence time of “old” C (MRTold,
months) was calculated as:
MRTold=1/k (7)
The time for half-potential accumulation of “new” C in the SOM above 0.2 mm (MT1/2−new) was calculated as:
MT1/2−new= −ln(1/2)/k′ (8)
k values of 0.032 and 0.045 were found, giving mean
res-idence time of “old” C in SOM>0.2 mm of 31.2 and 22.0 months (Fig. 4; Table 1) for monoliths acclimated to low and high disturbance, respectively. The different k values indi-cated a slower decay at low compared to high disturbance level.
With Lolium perenne, mean residence times of 55 and 11 months (for litter fractions >0.2 mm) were reported for a monoculture exposed for 10 yrs to elevated CO2(van Kessel
et al., 2006) and in a two year decomposition experiment using labelled root litter (Personeni and Loiseau, 2004), re-spectively. In the latter experiment, which compared grass species in monocultures, 95% of the variability in litter de-composition rates was explained by a root morphology trait, the mean specific root length.
In our experiment, the plant species richness reached 41 species and the abundance of Lolium perenne in the plant community was always below 10% (Klumpp et al., 2007). The low disturbance treatment was dominated by plant species with coarse and dense roots and rhizomes (Klumpp and Soussana, 20071), which are likely to last longer and de-compose slower than the fine roots observed at high distur-bance level. However, differences in microbial communities and in mycorrhizae between disturbance treatments could also play a significant role in the decay rate of carbon in the detrital pathway (Rangel-Castro et al., 2005).
1Klumpp, K. and Soussana, J. F.: Plant functional traits and
species richness control carbon sequestration in grassland meso-cosms, Ecol. Lett., in revision, 2007.
K. Klumpp et al.: Steady state13C labelling to investigate soil C turnover 393 First order exponential models indicated that the
poten-tial accumulation of “new” C was higher at low compared to high disturbance (a′, 3.0 and 2.3 mg C g−1soil, at L and H;
P<0.01) and was for both treatments substantially lower than the initial amount of “old” C at the start of the experiment (a, 7.4 and 4.0 mg C g−1soil at L and H) (Table 1). Thus, soil organic C pools were not fully filled at the end of the experi-ment, suggesting that a large part of the “new” C which was deposited into the soil compartment was decomposed before the end of the two years of the experiment. This would ex-plain why the potential accumulation of “new” C (a′) was found to be lower than the initial amount of “old” C (a; Ta-ble 1). For the same reason, half the maximum accumula-tion of “new” C was reached after 3.5 month on average, as some “new” C started to vanish from the compartment above 0.2 mm after a few months only.
During13C labelling , “new” C entered first shoots then roots and rhizomes, before being released in the soil through rhizodeposition (i.e. root exudates) and decomposed litter. However, at the low disturbance level shoot litter decom-position also contributed to the supply of “new” C to the soil, which could explain the higher potential accumulation of “new” C (a′) in the L compared to H treatment. Another factor contributing to the disappearance of both “old” and “new” carbon might be the activity of the soil fauna (macro-decomposers, e.g. earthworms) (Ostle et al., 2007; Hooper et al., 2000; Seeber et al., 2006), which could transport part of the litter to deeper soil layers and break down coarse lit-ter into finer fractions. Indeed, there was a high presence of earthworms in the high disturbance treatment (data not shown).
A detailed understanding of the C cycling belowground can be gained by investigating with this method carbon turnover in different organic matter size fractions and at dif-ferent depths. Moreover, the13C signature of the respired carbon can be studied giving access to the rate of decompo-sition of the “old” versus “new” carbon pools.
4 Conclusion
These results show the potential of13C steady state labelling for investigating the fate of carbon in the plant-soil contin-uum. A large array of applications at different time scales can be envisaged, ranging from short-term labelling of plant and soil carbon pools to long-term labelling of more stable soil organic matter fractions. By combining isotope anal-yses of soil OM compartments and of soil CO2 efflux, a
detailed understanding of the fate of carbon can be gained for herbaceous ecosystems. We have shown here that this method allows calculating the mean residence time of carbon in soil organic matter fractions. Moreover, we have shown that changes in grassland disturbance regime alter the rate of detrital C mineralization and accumulation in the soil or-ganic matter. Since detrital carbon accumulation accounts
for most of an ecosystem’s capacity to store organic carbon belowground within a few years, this quantification is impor-tant for understanding the role of grassland management on belowground C sequestration.
Acknowledgements. We thank H. Schnyder, F. Teyssonneyre and P. Pichon for their scientific and technical contributions during planning and set up of the labelling facility. We also thank and R. Sch¨aufele for helpful comments on an earlier version of this manuscript. This work was supported by a Marie Curie Individual Fellowship (EVK2-CT2002-50026) for K. Klumpp, the European GREENGRASS project (EVK2-CT2001-00105) and MEDD (GESSOL).
Edited by: J. Kesselmeier
References
Agren, G. I., Bosatta, E., and Balendent, J.: Isotope discrimination during decomposition of organic matter: A theoretical analysis, J. Soil Sci. Soc. Am. J., 60, 1121–1126, 1996.
Balesdent, J., Wagner, G. H., and Mariotti, A.: Soil organic matter turnover in long-term field experiment as revealed by carbon-13 natural abundance, Soil Sci. Soc. Am. J., 52, 118–124, 1988. Brugnoli, E. and Farquhar, G. D.: Photosynthetic fractionation of
carbon isotopes, in: Advances in photosythesis, vol. 9, Photo-synthesis: Physiology and metabolism, edited by: Leegood, R. C., Sharkey, T. D., and von Caemmerer, S., Kluwer Academic Publisher, Dordrecht, The Netherlands, 2000.
Casella, E. E. and Soussana, J. F.: Long-term effects of CO2 and temperature increase on the carbon balance of a temperate grass sward, J. Exp. Bot., 48, 1309–1321, 1997.
Cebrian, J. and Duarte, C. M.: Plant growth-rate dependence of detrital carbon storage in ecosystems, Science, 268, 1606–1608, 1995.
Contant, R. T., Paustian, K., and Elliot, E. T.: Grassland manage-ment and can conversion into grassland, Effects on soil carbon, Ecol. App. 11, 343–355, 2001.
Conen, F., Leifeld, J., Seth, B., and Alewell, C.: Warming miner-alisers young and old carbon equally, Biogeosciences, 3, 515– 519, 2006,
http://www.biogeosciences.net/3/515/2006/.
Del´eens, E., Pavlides, D., and Queiroz, O.: Application du trac¸age isotopique naturel par le C13 `a la mesure du renouvellement de la mati`ere foliaire chez les plantes en C3, Physiol. Veg., 21, 723– 729, 1983.
Derner, J. D., Boutton, T. W., and Briske, D. D.: Grazing and ecosystem carbon storage in the North American Great Plains, Plant and Soil, 280, 77–90, 2006.
Dijkstra, F. A., Hobbie, S. E., Knops, J. M. H., and Reich, P. B.: Nitrogen deposition and plant species interact to influence soil carbon stabilization, Ecol. Letters, 7, 1192–1198, 2004. Doak, B. W.: Some chemical changes in the nitrogenous
con-stituents of urine when voided on pasture, J. Agric. Sci., 42, 162– 171, 1952.
Evans, J. R., Sharkey, T. D., Berry, J. A., and Farquhar, G. D.: Car-bon isotope discrimination measured concurrently with gas ex-change to investigate CO2diffusion in leaves of higher plants, Aust. J. Plant Physiol., 13, 281–292, 1986.
Farquhar, G. D., Ehleringer, J. R., and Hubick, K. T.: Carbon iso-top discrimination and photosynthesis, Annu. Rev. Plant Physiol. Mol. Biol., 40, 403–437, 1989.
Gleixner, G., Danier, J., Werner, R. A., and Schmidt, L.:Correlation between the 13C content of primary and secondary products in different cell compartments and that in decomposing basid-iomycetes, Plant Physiol., 102, 1287–1290, 1993.
Hobbie, E. A., Johnson, M. G., Rygiewicz, P. T., Tingey, D. T., and Olszyk, D. M.: Isotopic estimates of new carbon inputs into litter and soils in a four-year climate change experiment with Douglas-fir, Plant and Soil, 259, 331–343, 2004.
Hooper, D. U., Bignell, D. E., Brown, V. K., Brussaard, L., Danger-field, D. M., and Wall, D. H.: Interactions between aboveground and belowground biodiversity in terrestrial ecosystems: Patterns, mechanisms, and feedbacks, Bioscience, 50, 1049–1061, 2000. Hooper, D. U. and Vitousek, P. M.: Effects of plant composition and
diversity on nutrient cycling, Ecol. Mono., 68, 121–149, 1998. Jones, M. B. and Donelly, A.: Carbon sequestration in temperate
grassland ecosystems and the influence of management, climate and elevated CO2, New Phytol., 164, 423–439, 2004.
Klumpp, K., Soussana, J. F., and Falcimagne, R.: Effects of past and current disturbance on carbon cycling in grassland mesocosms, Agric. Ecosyst. Environ., 121, 59–73, 2007.
Klumpp, K., Sch¨aufele, R., L¨otscher, M., Lattanzi, F. A., Feneis, W., and Schnyder, H.: C-isotope composition of CO2respired
by shoots and roots: fractionation during dark respiration?, Plant Cell Environm., 28, 241–250, 2005.
Loiseau, P. and Soussana, J. F.: Elevated [CO2], temperature in-crease and N supply effects on the accumulation of below-ground carbon in a temperate grassland ecosystem, Plant and Soil, 212, 123–134, 1999.
Louault, F., Pillar, V. D., Aufrere, J., Garnier, E., and Soussana, J. F.: Plant traits and function types in response to reduced disturbance in a semi-natural grassland, J. Veg. Sci., 16, 151–160, 2005. Mellilo, J. M., Aber, J. D., Linkins, A. E., Ricca, A., Fry, B., and
Nadelhoffer, K. J.: Carbon and nitrogen dynamics along the de-cay continuum: plant litter to soil organic matter, Plant and Soil, 115, 189–198, 1989.
O’Leary, M. H.: Carbon isotope fractionation in plants, Phytochem-istry, 20, 553–567, 1981.
Ostle, N., Ineson, P., Benham, D., and Sleep, D.: Carbon as-similation and turnover in grassland vegetation using an in situ (CO2)-C-13 pulse labelling system, Rap. Comm. Mass. Spec.,
14, 1345–1350, 2000.
Ostle, N., Briones, M. J. I., Ineson, P., Cole, L., Staddon, P., and Sleep, D.: Isotopic detection of recent photosynthate carbon flow into grassland rhizosphere fauna, Soil Biol. Biochem., 39, 768– 777, 2007.
Pataki, D. E., Bowling, D. R., and Ehleringer, J. R.: Seasonal eycle of carbon dioxid and its isotopic composition in an urban atmo-sphere: antropogenic and biogenic effects, J. Geophys. Res., 108, 1–8, 2004.
Personeni, E. and Loiseau, P.: Species strategy and N fluxes in grassland soil – A question of root litter quality or rhizosphere activity?, European J. Agr., 22, 217–229, 2005.
Personeni, E. and Loiseau, P.: How does the nature of living and dead roots affect the residence time of carbon in the root litter continuum?, Plant and Soil, 267, 129–141, 2004.
Picon-Cochard , C., Teyssonneyre, F., Besle, J. M., and Soussana,
J. F.: Effects of elevated CO2 and cutting frequency on the pro-ductivity and herbage quality of a semi-natural grassland, Europ. J. Agro., 20, 363–377, 2004.
Rangel-Castro, J. I., Prosser, J. I., Ostle, N., Scrimgeour, C. M., Killham, K., and Meharg, A. A.: Flux and turnover of fixed carbon in soil microbial biomass of limed and unlimed plots of an upland grassland ecosystem, Environmental Microbiology, 7, 544–552, 2005.
Schapendonk, A. H. C. M., Dijkstra, P., Groenwold, J., Pot, C. S., and Van de Geijn, S. C.: Carbon balance and water use efficiency of frequently cut Lolium perenne L. Swards at elevated carbon dioxid, Global Change Biol., 3, 207–216, 1997.
Schlesinger, W. H.: Biochemistry: an Analysis of global Change, 2nd edn. Academic Press, San diego, CA, 1997.
Schnyder, H., Sch¨aufele, R., L¨otscher, M., and Gebbing, T.: Dis-entangling CO2fluxes: direct measurements of mesocosm-scale
natural abundance13CO2/12CO2 gas exchange,13C
discrimi-nation, and labelling of CO2exchange flux components in
con-trolled environments, Plant, Cell and Environ., 26, 1863–1874, 2003.
Schnyder, H.: Long-term steady-state labelling of wheat plants by use of natural13CO2/12CO2mixtures in an open, rapidly
turned-over system, Planta, 187, 128–135, 1992.
Schweizer, M., Fear, J., and Cadisch, G.: Isotopic (13C) fraction-ation during plant residue decomposition and its implicfraction-ation for soil organic matter studies, Rap. Comm. Mass. Spec., 13, 1284– 1290, 1999.
Seeber, J., Scheu, S., and Meyer, E.: Effects of macro-decomposers on litter decomposition and soil properties in alpine pastureland: A mesocosm experiment, Appl. Soil Ecol., 34, 168–175, 2006. Six, J., Guggenberger, D., Paustian, K., Haumaier, L., Elliot, E. T.,
and Zech, W.: Sources and compostion of soil organic matter fractions between and witin soil aggregates, Europ. J. Soil Sci., 52, 607–618, 2001.
Smith, J., Smith, P., Wattenbach, M., Zaehle, S., Hiederer, R., Jones, R. J. A., Montanarella, L., Rounsevell, M. D. A., Reginster, I., and Ewert, F.: Projected changes in mineral soil carbon of Euro-pean croplands and grasslands, 1990–2080, Global Change Biol., 11, 2141–2152, 2005.
Stevenson, F. J.: Cycles of soil; carbon nitrogen, phosphorus, sul-phur, micronutrients, John Wiley & Sons, Inc, New York, p. 23– 33, 1986.
Tateno, M. and Chapin, F. S.: The logic of carbon and nitrogen interactions in terrestrial ecosystems, Am. Naturalist, 149, 723– 744, 1997.
Trueman, R. J. and Gonzales-Meler, M. A.: Acceleration below-ground C cycling in a managed agriforest ecosystem exposed to elevated carbon dioxide concentration, Glob. Chang. Biol., 11, 1258–1271, 2005.
Trumbore, S. E.: Carbon respired by terrestrial ecosystems – recent progress and challenges, Glob. Chang. Biol., 12, 141–153, 2000. van Kessel, C., Boots, B., de Graaff, M.-A., Harris, D., Blum, H., and Six, J.: Total soil C and N sequestration in a grassland fol-lowing 10 years of free air CO2 enrichment, Glob. Change Biol., 12, 2187–2199, 2006.
Verburg, P. S. J., Arnone, J. A., Obrist, D., Schorran, D. E., Evans, R. D., Leroux-Swarthout, D., Johnson, D. W., Luo, Y., and Cole-man, J. S.: Net ecosystem carbon exchange in two experimental grassland ecosystems, Global Change Biol., 10, 498–508, 2004.