HAL Id: hal-00316886
https://hal.archives-ouvertes.fr/hal-00316886
Submitted on 1 Jan 2001
HAL is a multi-disciplinary open access
archive for the deposit and dissemination of
sci-entific research documents, whether they are
pub-lished or not. The documents may come from
teaching and research institutions in France or
abroad, or from public or private research centers.
L’archive ouverte pluridisciplinaire HAL, est
destinée au dépôt et à la diffusion de documents
scientifiques de niveau recherche, publiés ou non,
émanant des établissements d’enseignement et de
recherche français ou étrangers, des laboratoires
publics ou privés.
Typhoon 9707 observations with the MU radar and
L-band boundary layer radar
M. Teshiba, H. Hashiguchi, S. Fukao, Y. Shibagaki
To cite this version:
M. Teshiba, H. Hashiguchi, S. Fukao, Y. Shibagaki. Typhoon 9707 observations with the MU radar
and L-band boundary layer radar. Annales Geophysicae, European Geosciences Union, 2001, 19 (8),
pp.925-931. �hal-00316886�
Annales
Geophysicae
Typhoon 9707 observations with the MU radar and L-band
boundary layer radar
M. Teshiba1, H. Hashiguchi1, S. Fukao1, and Y. Shibagaki2
1Radio Science Center for Space and Atmosphere, Kyoto University, Uji, Kyoto 611-0011, Japan 2Osaka Electro-Communication University, Neyagawa, Osaka 572–8530, Japan
Received: 20 October 2000 – Revised: 8 June 2001 – Accepted: 27 July 2001
Abstract. Typhoon 9707 (Opal) was observed with the VHF-band Middle and Upper atmosphere (MU) radar, an L-band boundary layer radar (BLR), and a vertical-pointing C-band meteorological radar at the Shigaraki MU Observa-tory in Shiga prefecture, Japan on 20 June 1997. The ty-phoon center passed about 80 km southeast from the radar site. Mesoscale precipitating clouds developed due to warm-moist airmass transport from the typhoon, and passed over the MU radar site with easterly or southeasterly winds. We primarily present the wind behavior including the vertical component which a conventional meteorological Doppler radar cannot directly observe, and discuss the relationship between the wind behavior of the typhoon and the precipi-tating system. To investigate the dynamic structure of the ty-phoon, the observed wind was divided into radial and tangen-tial wind components under the assumption that the typhoon had an axi-symmetric structure. Altitude range of outflow ascended from 1–3 km to 2–10 km with increasing distance (within 80–260 km range) from the typhoon center, and in-flow was observed above and below the outin-flow. Outin-flow and inflow were associated with updraft and downdraft, re-spectively. In the tangential wind, the maximum speed of counterclockwise winds was confirmed at 1–2 km altitudes. Based on the vertical velocity and the reflectivity obtained with the MU radar and the C-band meteorological radar, re-spectively, precipitating clouds, accompanied by the wind behavior of the typhoon, were classified into stratiform and convective precipitating clouds. In the stratiform precipitat-ing clouds, a vertical shear of radial wind and the maximum speed of counterclockwise wind were observed. There was a strong reflectivity layer called a ‘bright band’ around the 4.2 km altitude. We confirmed strong updrafts and down-drafts below and above it, respectively, and the existence of a relatively dry layer around the bright band level from ra-diosonde soundings. In the convective precipitating clouds,
Correspondence to: H. Hashiguchi
the regions of strong and weak reflectivities were well asso-ciated with those of updraft and downdraft, respectively. Key words. Meteorology and atmospheric dynamics (meso-scale meteorology; precipitation) Radio science (remote sensing)
1 Introduction
Typhoons have been observed with various instruments in Japan. Ishihara et al. (1986) examined the wind fields and the internal structure of the rainband of Typhoon 8305 using the ground-based Doppler radar and showed that the conver-gence between the low-level warm inflow and the descending rear flow was associated with the relatively cold air. Sakak-ibara et al. (1985) showed that the structure of the rain band in the extratropical transition of the typhoon was partially similar to that of a squall line at mid-latitudes. Tabata et al. (1992) showed the structure of spiral rain bands (outer and inner rain bands) of Typhoon 8514. Shimazu (1997) showed that two types of rain bands, wide, slow-moving and narrow, fast-moving, were characterized by stratiform precipitation in which low-level shallow convective cells were embedded. The radar observations in the studies mentioned above are limited in existence to the region of the precipitation. The MU (Middle and Upper atmosphere) radar (Fukao et al., 1985a, b) is one of the most powerful instruments for ty-phoon observations, since it can observe height profiles of the wind field, including the vertical motion in any weather conditions. The MU radar is a 46.5 MHz monostatic Doppler radar with an active phased-array antenna of 103 m in diam-eter and with 1 MW peak output power, located at Shigaraki, Shiga prefecture, Japan (34.85◦N, 136.10◦E; 375 m above mean sea level). Sato et al. (1991) continuously observed Typhoon 8719 with the MU radar and showed short-period wind fluctuations associated with the typhoon. Sato (1993) studied small-scale wind disturbances associated with this
926 M. Teshiba et al.: Typhoon 9707 observations
Fig. 1. Schematic illustration of analysis method based on an as-sumption of an axi-symmetrical structure of the typhoon. Rectan-gle shows radar position. Thin solid, broken, and thick solid vectors indicate horizontal wind observed by radar, moving speed of the ty-phoon center, and tangential and radial components, respectively.
typhoon and showed significant differences in its statistical characteristics before and after the typhoon passage.
We successfully observed Typhoon 9707 (Opal) with the MU radar on 20 June 1997. The MU radar can continuously observe height profiles of the wind field in the troposphere and lower stratosphere with the high time and height reso-lutions of 3 min and 150 m, respectively. It can observe all three components of the wind velocity vector, including the vertical velocity and the falling speed of precipitating parti-cles (e.g. Wakasugi et al., 1986; Sato et al., 1991), while me-teorological Doppler radars cannot observe the vertical wind component. Therefore, we examine the behavior of the ver-tical wind.
The lowest observable height of the MU radar is, however, about 2 km, due to the system limitation. To examine the lower part of the troposphere, we used an L-band boundary layer radar (BLR) which is installed at the MU radar site. The BLR is a 1357.5 MHz monostatic Doppler radar with a phased-array antenna and with 1.1 kW peak output power, and has time and height resolutions of about 1 min and 100 m, respectively. Using both radars, we can obtain the con-tinuous height profiles from the 800 m to about the 20 km altitude. We also operated a C-band meteorological radar in-stalled at the same site to investigate the vertical structure of precipitating clouds. It is a vertical-pointing radar with the transmitting frequency of 5.3 GHz and with the peak output power of 40 kW (Fukao et al., 1985c). Specifications of these radars are summarized in Table 1.
Since it is impossible to transport the MU radar to another
place, the opportunity to observe typhoons is rare. First, we could successfully first observe the typhoon by using both of MU radar and the L-band BLR in this study. The main objectives of this paper are to describe the wind behavior in the troposphere, including the boundary layer obtained by both radars, and to investigate the relationship between the vertical wind behavior and the structure of the typhoon.
2 Analysis method
First, by connecting the data obtained from the MU radar and the BLR at the 3.1 km altitude, we made a complete tropo-spheric dataset. Atmotropo-spheric radars like the MU radar and the BLR can obtain only the temporal variation of the verti-cal profiles of the wind velocities over the radar, but cannot directly observe the spatial structure of the typhoon. If we as-sume, however, that the structure of the typhoon is persistent during the period of observation, the time series of data can be transformed into one cross section of the typhoon struc-ture. The locations of the typhoon are estimated from spline interpolation of locations reported every 1–6 hours by Japan Meteorological Agency (JMA).
To examine the winds associated with the typhoon struc-ture, the environmental wind (approximated by the mean translational velocity of the typhoon center) is subtracted from the observed one. It is also assumed that the trans-lational velocity of the typhoon center does not change in height. The subtracted wind is divided into radial and tangen-tial wind components under the assumption that the typhoon has an axi-symmetric structure (see Fig. 1).
We examined the appropriateness of the above assump-tions from the geopotential field at the 500 hPa level, from the surface pressure field, and from the infrared (IR) imagery of the Geostationary Meteorological Satellite (GMS). The ty-phoon locations at 500 hPa and on the surface are almost the same, and the cloud distribution associated with the typhoon has an axi-symmetric structure around the center axis. There-fore, it is concluded that the above assumptions are appropri-ate.
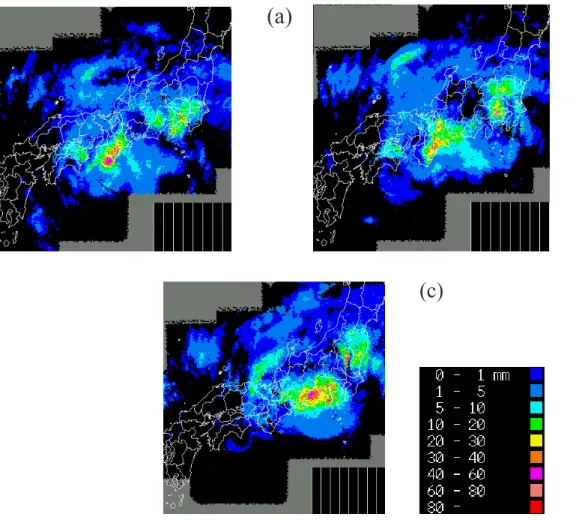
Figure 2 shows the horizontal distribution of a 1-hour pre-cipitation obtained by the C-band meteorological radar net-work of JMA at the 2 km altitude for 0500–1000 LT on 20 June 1997, when the typhoon center was located at about 220, 148, and 82 km distance from the MU radar site, respec-tively. The rain bands associated with the typhoon and af-fected by the Kii Mountains, which are located around 20 km southeast of the radar site, were observed. Willoughby et al. (1984) studied the rain bands corresponding to typhoons. Typhoons have several rain bands associated with their struc-tures, such as principal bands, secondary bands, connecting bands with principal and secondary band, and eye wall (see Fig. 18 of Willoughby et al., 1984). In our case, the ‘connect-ing band’ was located around the stationary rain band until the typhoon passed over the radar site, while the ‘principal band’ was not clearly seen around the typhoon. Since the precipitating clouds passing over the radar site were a part
Fig. 2. Horizontal distributions of the amount of rainfall for (a) 05–06 LT, (b) 07–08 LT, and (c) 09–10 LT on 20 June 1997.
of the stationary rain band along the mountainous region, we suppose that the convective clouds observed over the radar site were not associated with the typhoon structure, but were generated by orographic effects.
We have classified precipitating clouds into three types: stratiform, convective, and mixed stratiform-convective clouds, based on the vertical motion observed by the MU radar and the reflectivity observed by the C-band meteoro-logical radar. If there are no characteristics of a bright band, it is classified as ‘convective cloud’. If strong echoes ex-ist around the bright band level, we classify this precipitat-ing cloud as ‘stratiform precipitatprecipitat-ing cloud’, except for the type of precipitating cloud where the vertical change in the vertical wind component is small. This type is classified as ‘mixed stratiform-convective cloud’.
3 Features of wind structure
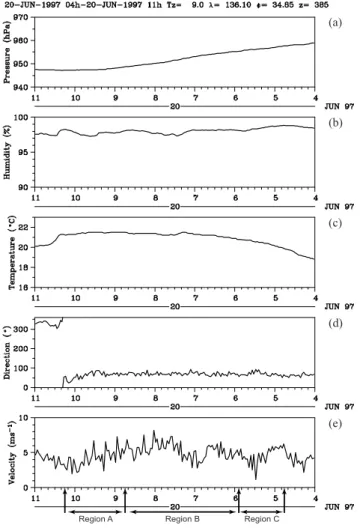
Figure 3 shows the path of Typhoon 9707. The typhoon ap-proached from south of the Japan Islands, passed over the closest region of about 80 km southeast from the radar site at 1020 LT on 20 June, and landed in Aichi prefecture around 1100 LT. Figures 4 and 5 show temporal variations of the sur-face meteorological data obtained at the radar site. The
pres-sure and temperature were decreasing and increasing, respec-tively, associated with the approach of the typhoon. Mini-mum pressure and the drastic change in the wind direction appeared around 1020 LT, when the typhoon was closest to the radar site.
Figure 6 shows the time-height cross section of the hori-zontal wind component observed with the MU radar and the BLR. The easterly or southeasterly winds are observed be-tween about 1 km and 10 km until the passage of the typhoon. Since the mountainous region of about 1 km in height is lo-cated from east to southeast of the MU radar site (see Fig. 7), as the typhoon passed near the radar site, mesoscale precipi-tating clouds developed due to warm-moist airmass transport from the typhoon and passed over the MU radar site.
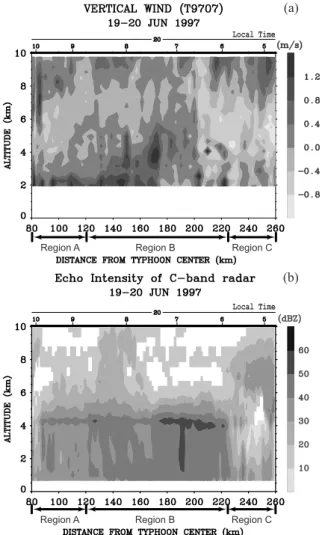
Figure 8 shows the radius-height cross section of vertical velocity obtained with the MU radar and reflectivity obtained with the vertical-pointing C-band meteorological radar be-fore the passage of the typhoon center. We only plot the MU radar data in Fig. 8(a), since the BLR cannot obtain vertical velocity information in precipitation due to its high sensitiv-ity to precipitation. Of course, the BLR can observe horizon-tal winds even in precipitation (Wakasugi et al. 1986).
We can divide these into three regions (Regions A, B, and C), according to cloud types. Regions A, B, and C
corre-928 M. Teshiba et al.: Typhoon 9707 observations
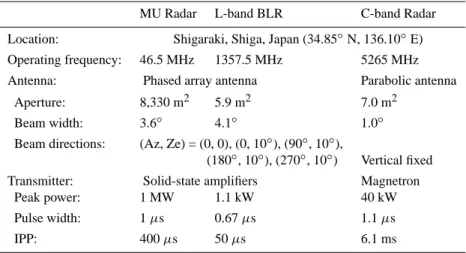
Table 1. Specifications of the MU radar, the L-band BLR, and the C-band radar
MU Radar L-band BLR C-band Radar Location: Shigaraki, Shiga, Japan (34.85◦N, 136.10◦E) Operating frequency: 46.5 MHz 1357.5 MHz 5265 MHz
Antenna: Phased array antenna Parabolic antenna
Aperture: 8,330 m2 5.9 m2 7.0 m2
Beam width: 3.6◦ 4.1◦ 1.0◦
Beam directions: (Az, Ze) = (0, 0), (0, 10◦), (90◦, 10◦),
(180◦, 10◦), (270◦, 10◦) Vertical fixed Transmitter: Solid-state amplifiers Magnetron
Peak power: 1 MW 1.1 kW 40 kW
Pulse width: 1 µs 0.67 µs 1.1 µs
IPP: 400 µs 50 µs 6.1 ms
Fig. 3. Path of Typhoon 9707 calculated from the spline interpola-tion applied with the locainterpola-tions reported by JMA. A cross sign (×) indicates the location of the MU radar.
spond to the distances of 80–120 km, 120–225 km, and 225– 260 km from the typhoon center, respectively. The cloud type in Region A is classified as the stratiform precipitat-ing cloud, because the bright band exists at the 4.2 km alti-tude. As Marks and Houze (1987) here already shown, these stratiform precipitating clouds are situated outside the eye wall. The cloud type in Region B is the mixed stratiform-convective cloud, because the bright band exists around the 4.2 km altitude and the vertical change in the vertical wind component is small. Tabata et al. (1992) studied the structure of the typhoon passing near the southeast coast of Japan. In their case, stratiform precipitating clouds were observed and there was no orographic effect because there were few moun-tains located there. Therefore, stratiform precipitating clouds in Region B are associated with the characteristic structure of the typhoon. On the other hand, convective clouds seem to be affected by both the characteristic structure of the ty-phoon and the orographic effect due to the mountains in the
southeast side of the radar site, since the easterly winds are observed in the lower troposphere of Region B. The cloud type in Region C is convective cloud, because the bright band does not exist and updrafts and downdrafts are alternately ob-served at a distance from the typhoon center.
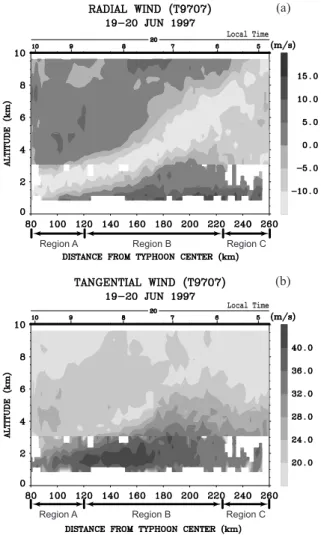
Figure 9 shows the radius-height cross section of radial and tangential winds obtained by the MU radar and the BLR. We describe the characteristics of Typhoon 9707 in each re-gion in the following subsections.
3.1 Features in stratiform precipitating cloud region In Region A (at the distance of 80–120 km), inflow below 1 km and above the 3 km altitude, and outflow at the altitude range of 1–3 km are observed. The maximum counterclock-wise wind of about 40 m/s appears around the 1 km altitude. The vertical shear of counterclockwise winds is seen around the 2 km altitude. Strong updrafts around 2 km, weak down-drafts at 3–7 km, and updown-drafts above the 7 km altitude are observed. The vertical shear of radial winds seems to be as-sociated with that of vertical winds at the 2–3 km altitudes.
3.2 Features in mixed stratiform-convective precipitating cloud region
At a distance of 120–170 km from the typhoon center, weak inflow is observed above and below the outflow. The max-imum speed of counterclockwise winds is obtained around the 1.5 km altitude. Updrafts extend below about the 4 km altitude and sometimes extend up to the 6 km altitude. In-flow and outIn-flow are almost associated with the updrafts and downdrafts, respectively. There exists the bright band at the 4.2 km altitude. It is considered that there is severe convec-tion and that the precipitating clouds are in the developing stage. Figure 10 shows the temperature and humidity pro-files obtained by radiosonde soundings launched at 0531 LT (∼240 km distance from the typhoon center) and 0826 LT (∼130 km distance) on 20 June.
Fig. 4. Temporal variations of (a) pressure, (b) humidity, (c) tem-perature, (d) wind direction, and (e) wind speed on the ground at the MU radar site during 0400–1100 LT on 20 June 1997.
A relatively dry layer appears around the 4.2 km altitude, which corresponds to the change in the vertical wind with the divergence. At a distance of 170–200 km from the ty-phoon center, weak inflow is also observed above and be-low the outfbe-low. The maximum speed of the counterclock-wise winds is obtained around the 2 km altitude. The mag-nitudes of the maximum counterclockwise winds, however, become smaller with increasing distance from the typhoon center. Updrafts extend from 2.5 km to 7 km and there are al-ternately updrafts and downdrafts in distance. In particular, strong updrafts are observed around the bright band level at the 195 km distance. Above the 7 km altitude, vertical veloc-ity is weak. A vertical shear of counterclockwise winds is associated with outflow. At a distance of 200–225 km from the typhoon center, there is inflow below 1.5 km and above 8.5 km, and outflow at the 1.5–8.5 km altitudes. The mag-nitude of counter-clockwise winds is smaller than that at the distance of 80–200 km. There are downdrafts below the 8 km altitude; thus, it is considered that the precipitating cloud is in the decay stage. The vertical shear of radial winds is accom-panied by that of the vertical winds around the 8 km altitude.
Fig. 5. Temporal variations of rain intensity on the ground at the MU radar site during 0400–1100 LT on 20 June 1997.
Fig. 6. Time-height cross section of horizontal wind component observed with the MU radar and the L-band BLR at an interval of 9 min during 0400–1100 LT on 20 June 1997. The height interval of the MU radar and the BLR is 150 m and 100 m, respectively.
3.3 Features in convective precipitating cloud region In Region C (at the distance of 225–260 km), inflow and the counterclockwise winds with magnitudes of more than 25 m/s are observed below the 2 km altitude. Updrafts and downdrafts alternately appear with increasing distance from the typhoon center, while the updrafts are weaker than those at the distance of 80–225 km. Therefore, the precipitating clouds are not in the developing stage.
4 Concluding remarks
We simultaneously observed Typhoon 9707 with the MU radar, the BLR, and the vertical pointing C-band meteoro-logical radar. Outflow and inflow in the radial wind were associated with updraft and downdraft, respectively. In the tangential wind, the maximum speed was observed in the altitude range of 1–2 km and the wind speed decreased by increasing altitude. Precipitating clouds, accompanied with the wind behaviors of the typhoon, were classified into
strat-930 M. Teshiba et al.: Typhoon 9707 observations
Fig. 7. Topographical map around the MU radar site.
iform, convective, and mixed stratiform-convective precipi-tating clouds by using the vertical velocity and the reflectiv-ity obtained from the MU radar and the C-band radar, respec-tively. In the stratiform precipitating cloud, a vertical shear of radial winds and the maximum speed of counterclockwise winds were observed. There was a prominent bright band around the 4 km altitude, which corresponds to a relatively dry layer. Strong updrafts and downdrafts were seen above and below it, respectively. In the convective precipitating cloud, the regions of strong and weak reflectivities were well associated with those of updraft and downdraft, respectively.
Acknowledgements. The authors thank Prof. M. D. Yamanaka of Kobe University for his helpful comments. They also thank Mr. I. Ougisawa for the data analysis and comments. We thank Mr. Ger-not Hassenpflug for his careful reading of the original manuscript. The MU radar belongs to and is operated by the Radio Science Cen-ter for Space and Atmosphere, Kyoto University.
Topical Editor J.-P. Duvel thanks M. Larsen and A. R. Hansen for their help in evaluating this paper.
Fig. 8. Radius-height cross section of (a) vertical velocity obtained with the MU radar and (b) reflectivity obtained with the C-band meteorological radar before the passage of the typhoon center at an interval of 6 min. The height interval of the MU radar and the C-band radar is 150 m and 300 m, respectively.
References
Fukao, S., Sato, T., Tsuda, T., Kato, S., Wakasugi, K., and Makihira, T., The MU radar with an active phased array system: 1. Antenna and power amplifiers, Radio Sci., 20, 1155–1168, 1985a. Fukao, S., Tsuda, T., Sato, T., Kato, S., Wakasugi, K., and Makihira,
T., The MU radar with an active phased array system: 2. In-house equipment, Radio Sci., 20, 1169–1176, 1985b.
Fukao, S., Wakasugi, K., Sato, T., Tsuda, T., Kimura, I., Takeuchi, N., Matsuo, M., and Kato, S., Simultaneous observation of pre-cipitating atmosphere by VHF band and C/Ku band radars, Radio Sci., 20, 622–630, 1985c.
Ishihara, M., Yanagisawa, Z., Sakakibara, H., Matsuura, K., and Aoyagi, J., Structure of a typhoon rainband observed by two Doppler radars, J. Meteor. Soc., Japan, 64, 923–939, 1986. Marks, D. F. Jr., and House, R. A., Jr., Inner core structure of
hurri-cane Alicia from airborne Doppler radar observation, J. Atmos. Sci., 44, 1296–1317, 1987.
Sakakibara, H., Ishihara, M., and Yanagisawa, Z., Structure of a typhoon rainstorm in the middle latitudes observed by Doppler radar, J. Meteor. Soc., Japan, 63, 901–922, 1985.
Fig. 9. Radius-height cross section of (a) radial and (b) tangential winds obtained by the MU radar and the L-band BLR before the passage of the typhoon center at an interval of 6 min. The height interval of the MU radar and the BLR is 150 m and 100 m, respec-tively. Positive and negative values of radial wind indicate inflow and outflow, respectively. Positive values of tangential wind indi-cate counterclockwise winds.
Sato, T., Ao, N., Yamamoto, M., Fukao, S., Tsuda, T., and Kato, S.,A typhoon observed with the MU radar, Mon. Weath. Rev., 119, 755–768, 1991.
Sato, K., Small-scale wind disturbances observed by the MU radar during the passage of Typhoon Kelly, J. Atmos. Sci., 50, 518– 537, 1993.
Shimazu, Y., Wide slow-moving rainbands and narrow fast-moving rainbands observed in Typhoon 8913, J. Meteor. Soc., Japan, 75, 67–80, 1997.
Fig. 10. The profiles of temperature (a) and (b) and relative hu-midity (c) and (d) observed with radiosondes launched at 0531 LT (upper panels) and 0826 LT (lower panels) on 20 June 1997. The typhoon was located at the distance of about 240 km and 130 km from the MU radar site at 0531 and 0826 LT, respectively.
Tabata, A., Sakakibara, H., Ishihara, M., Matsuura, K., and Yanag-isawa, Z., A general view of the structure of Typhoon 8514 ob-served by dual-Doppler radar —From outer rainbands to eyewall clouds, J. Meteor. Soc. Japan, 70, 897–917, 1992.
Wakasugi, K., Mizutani, A., Matsuo, M., Fukao, S., and Kato, S., A direct method for deriving drop-size distribution and vertical air velocities from VHF Doppler radar spectra, J. Atmos. Oceanic Tech., 3, 623–629, 1986.
Willoughby, H. E., Marks, F. D., Jr., and Feinberg, R. J., Stationary and moving convective bands in Hurricanes, J. Atmos. Sci., 41, 3189–3211, 1984.