HAL Id: hal-00330305
https://hal.archives-ouvertes.fr/hal-00330305
Submitted on 1 Feb 2005
HAL is a multi-disciplinary open access
archive for the deposit and dissemination of
sci-entific research documents, whether they are
pub-lished or not. The documents may come from
teaching and research institutions in France or
abroad, or from public or private research centers.
L’archive ouverte pluridisciplinaire HAL, est
destinée au dépôt et à la diffusion de documents
scientifiques de niveau recherche, publiés ou non,
émanant des établissements d’enseignement et de
recherche français ou étrangers, des laboratoires
publics ou privés.
Analyzing the trophic link between the mesopelagic
microbial loop and zooplankton from observed depth
profiles of bacteria and protozoa
T. Tanaka, F. Rassoulzadegan, T. F. Thingstad
To cite this version:
T. Tanaka, F. Rassoulzadegan, T. F. Thingstad. Analyzing the trophic link between the mesopelagic
microbial loop and zooplankton from observed depth profiles of bacteria and protozoa. Biogeosciences,
European Geosciences Union, 2005, 2 (1), pp.9-13. �hal-00330305�
www.biogeosciences.net/bg/2/9/ SRef-ID: 1726-4189/bg/2005-2-9 European Geosciences Union
Biogeosciences
Analyzing the trophic link between the mesopelagic microbial loop
and zooplankton from observed depth profiles of bacteria and
protozoa
T. Tanaka1, F. Rassoulzadegan2, and T. F. Thingstad1
1Department of Biology, University of Bergen, Jahnebakken 5, PO Box 7800, N-5020 Bergen, Norway
2LOV-UMR7093, CNRS-UPMC, Station Zoologique, BP 28, F-06234 Villefranche-sur-Mer Cedex, France
Received: 4 August 2004 – Published in Biogeosciences Discussions: 19 August 2004 Revised: 10 November 2004 – Accepted: 23 December 2004 – Published: 1 February 2005
Abstract. It is widely recognized that organic carbon
ex-ported to the ocean aphotic layer is significantly consumed by heterotrophic organisms such as bacteria and zooplank-ton in the mesopelagic layer. However, very little is known for the trophic link between bacteria and zooplankton or the function of the microbial loop in this layer. In the northwest-ern Mediterranean, recent studies have shown that viruses, bacteria, heterotrophic nanoflagellates, and ciliates distribute down to 2000 m with group-specific depth-dependent de-creases, and that bacterial production decreases with depth
down to 1000 m. Here we show that such data can be
analyzed using a simple steady-state food chain model to quantify the carbon flow from bacteria to zooplankton over the mesopelagic layer. The model indicates that bacterial mortality by viruses is similar to or 1.5 times greater than that by heterotrophic nanoflagellates, and that heterotrophic nanoflagellates transfer little of bacterial production to higher trophic levels.
1 Introduction
The current view of ocean biogeochemistry is that organic carbon (OC) exported from the euphotic layer is mostly rem-ineralized in the mesopelagic layer, otherwise considered buried in the ocean interior (e.g. Fowler and Knauer, 1986). While sinking particulate organic carbon (POC) is consumed by particle-attached bacteria and detritivorous zooplankton during the sinking process (Martin et al., 1987; Cho and Azam, 1988; Smith et al., 1992), dissolved organic carbon (DOC), which is exported from the euphotic layer or released from sinking POC, is accessible only for free-living bacteria. However the trophic link between bacteria and zooplankton, i.e. the structure and function of the microbial loop, is
un-Correspondence to: T. Tanaka
known in the mesopelagic layer, by which our understanding of biological process in global material cycling may be lim-ited.
Recent studies in the northwestern Mediterranean reported vertical and seasonal variations in abundance of viruses, bac-teria, heterotrophic nanoflagellates (HNF), and ciliates, and of bacterial production, in the aphotic layers down to 2000 m (Harris et al., 2001; Tamburini et al., 2002; Tanaka and Ras-soulzadegan, 2002; Weinbauer et al., 2003). In addition, Tanaka and Rassoulzadegan (2004) showed that bacteria at 500 m were controlled by both bottom-up (substrate) and top-down (predation) controls. In this paper, we analyzed carbon flow in the mesopelagic microbial loop-zooplankton, using the published data combined with a simple steady-state food chain model. Results indicated that bacterial mortality by viruses is similar to or 1.5 times greater than that by HNF, and that HNF transfer little of bacterial production to higher trophic levels.
2 Study site
The data used in this study were obtained at the
French-JGOFS time-series station DYFAMED (43◦25.20N,
07◦51.80E; 2350 m max depth) in the northwestern
Mediter-ranean, and have been published in Tanaka and Rassoulzade-gan (2002, 2004, see also for detailed description of mate-rials and methods). This site is likely independent of an-thropogenic and natural dust inputs (Marty et al., 1994; Ri-dame and Guieu, 2002) and receives very weak lateral flows (B´ethoux et al., 1988; Andersen and Prieur, 2000). Water
temperature is always ca. 13◦C below seasonal thermocline
down to 2000 m during the stratified period and in whole wa-ter column during the mixing period, and no permanent pyc-nocline exists (Marty, 2003). This site shows contrasted sea-sonal patterns of water column structure and biological pro-duction in the upper layer (Marty and Chiav´erini, 2002), with
10 T. Tanaka et al.: Analyzing the trophic link between the mesopelagic microbial loop and zooplankton G G G G G G G G G G G G G G G G G G G G G G G G G G G G G G G G G G 3000 1000 100 10 3 1x100 1x101 1x10² 1x10³ 1x10⁴ 1x10⁵ 1x10⁶ 1x1071x108 1x1091x1010 Abundance (cells L-1) Depth (m) Bacteria HNF Ciliates 101 102 103 104 105 106 107 108 109 1010 100 2000 5
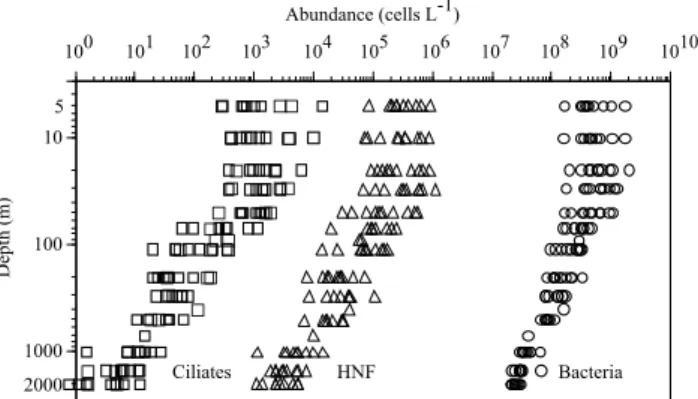
Fig. 1. Distributions of bacteria, heterotrophic nanoflagellates (HNF) and ciliates. Measurements were monthly done at 13 depths between 5 and 2000 m from May 1999 to March 2000 at the DY-FAMED site (Redrawn from Tanaka and Rassoulzadegan, 2002). Circles, triangles and squares denote bacteria, HNF and ciliates, re-spectively.
the consequence that sinking POC fluxes are higher from January to June and smaller from July to December (Miquel et al., 1993, 1994) and that DOC is accumulated in the sur-face mixed layer during the stratified period and exported during the winter mixing period (Copin-Mont´egut and Avril, 1993; Avril, 2002). Annual fluxes of sinking POC between
100 and 1000 m are estimated to be 0.4 mol-C m−2 yr−1
(Miquel et al., 1994). The depth of the winter vertical mixing (<1000 m) and relatively stable DOC concentrations in the deeper layer (1000–2000 m) suggest that most of the DOC
exported from the euphotic layer (1-1.5 mol-C m−2yr−1)is
consumed in the upper 1000 m (Copin-Mont´egut and Avril, 1993; Avril, 2002). These fluxes between 100 and 1000 m correspond to 75% of sinking POC and ∼100% of exported DOC from the euphotic layer. It is reported that sinking POC was consumed by detritivorous zooplankton (Carroll et al., 1998) and particle-attached bacteria (Turley and Stutt, 2000) during the sinking process at the same site.
3 Background of the aphotic microbial heterotrophs at the study site
Tanaka and Rassoulzadegan (2002) demonstrated that bacte-ria, HNF and ciliates were always detected throughout the water column during an annual study, with one, two and three orders of magnitude of depth-dependent decrease (5– 2000 m), respectively, at the DYFAMED site (Fig. 1). Re-gardless of greater seasonal variations in abundance in up-per layer, the log-log linear regression analysis for abundance vs. depth showed that the regression slope values (the index of magnitude of depth-dependent decrease) were relatively constant for each group, and that the depth-dependent de-creases of abundance were significantly smaller for bacteria than protozoa, by which the biomass contribution of
bacte-Viruses
Bacteria HNF Ciliates Zoopl.
Fig. 2. Flow structure of the model used for analyzing carbon flow
in the mesopelagic layer of the northwestern Mediterranean. The model consists of viruses, bacteria, heterotrophic nanoflagellates (HNF), ciliates, and zooplankton.
ria to total microbial heterotrophs increased from 60 to 95% with depth (Tanaka and Rassoulzadegan, 2002). Under the assumption that the food web was close to steady state, this suggests that rate processes (i.e. growth and loss rates) are less variable for bacteria than for protozoa over the depth, and that the density-dependent predator-prey relationship be-comes less coupled between the three microbial heterotrophs with increasing depth down to 2000 m.
A following study at the same site showed that while bac-terial biomass and production showed depth-dependent de-creases over the 110–1000 m layer, both parameters were seasonally variable down to 300 m and 500 m, respectively
(Tanaka and Rassoulzadegan, 2004). The comparison in
changing rate of bacterial abundance in different treatments (whole water from 500 m, predator-free water from 500 m, predator-free water from 500 m diluted by particle-free wa-ter from 500 m, and predator-free wawa-ter from 500 m diluted by particle-free water from 110 m) suggested that bacteria at 500 m were controlled by both bottom-up (substrate) and top-down (predation) controls, and that the availability of dis-solved organic matter was seasonally variable down to 500 m (Tanaka and Rassoulzadegan, 2004). In the 1000–2000 m, bacterial production showed seasonal variations but did not decrease with depth (Tamburini et al., 2002).
4 Model
Our knowledge of the structure and function of the micro-bial loop is quite limited for the aphotic layer due to the scarcity of direct measurements of biomass and rate pro-cess. If one assumes a food-web structure for carbon flow, and combines this with the assumption of an approximate steady state over the depths (e.g. Thingstad, 2000), the data on biomass of microbial heterotrophs and bacterial produc-tion can be used to estimate carbon flows between micro-bial heterotrophs and zooplankton over the mesopelagic layer (hereafter 110–1000 m). We assumed a simple food chain of viruses, bacteria, HNF, ciliates and zooplankton, in which only bacteria have two loss processes (viruses and HNF) (Fig. 2). An expression for the observed level of bacterial biomass can be obtained by using the steady state
require-ment for HNF at biomass H (nmol-C L−1), eating bacteria at
Table 1. Estimated parameter values in Eqs. (4) and (5) based on a linear regression model I.
Variables (x, y) Model Slope (±SE) Slope significance Y-int. (±SE) Y-int. significance n r2 H∗, BP /B∗ y=αHx+δBV 0.0007±0.0001 P <0.0001 0.0069±0.002 P=0.0015 29 0.467
10 B∗, C∗ y=YHx 0.0112±0.0015 P <0.01 5 0.949
biomass B (nmol-C L−1)with a specific clearance rate of αH
(L nmol-C−1d−1)and a yield of YH(no dimension), and that
for viruses with a specific loss rate δBV (d−1). The specific
loss rate of bacteria by viruses is adapted in order to compro-mise with limited data on viruses. The number of bacterial prey caught per unit time per unit predator is assumed to be
proportional to prey abundance (αHB), the total loss due to
predation is then αHB H. Total loss of bacteria by viruses
can be given by δBVB. At steady state, production of new
bacterial biomass (BP : nmol-C L−1d−1)balances the total
loss, that is:
BP = αH B∗H∗+δBV B∗, (1)
where the asterisk denotes steady state biomass of predator and prey. Likewise, the observed level of HNF biomass can be obtained by using the steady state requirement for ciliates
at biomass C (nmol-C L−1), eating HNF at biomass H with
a specific clearance rate of αC(L nmol-C−1d−1)and a yield
of YC (no dimension). Then, the production of new HNF
biomass YHαHB H balances the loss to ciliates αCH C, that
is:
YHαHB∗H∗=αC H∗C∗. (2)
If we introduce a specific loss rate of ciliates by zooplankton
as δCZ(d−1)due to limited data on zooplankton, the
produc-tion of new ciliates biomass YCαCH Cbalances the loss to
zooplankton δCZC, that is:
YCαCH∗C∗=δCZC∗. (3)
Arranging Eq. (1) gives:
BP /B∗=αHH∗+δBV. (4)
Linear regression of Eq. (4) with the data of H∗ and
BP /B∗allows direct estimates of αHand δBV. Growth yield
is considered variable with environmental conditions, and no data are available for the mesopelagic HNF and ciliates. Clearance rate is considered to be a function of prey density, which is assumed to be valid in the aphotic layer. Increase in cell size of the mesopelagic bacteria was not recognized under microscopic observation (Tanaka, personal observa-tion). It is reported that specific clearance rate of bacteriv-orous HNF was ∼10 times greater than that of ciliates prey-ing on small particles in the euphotic layer (Fenchel, 1987).
Under the assumption of αC=0.1 αH, Eq. (2) is arranged as:
C∗=YH (10B∗). (5)
Linear regression of Eq. (5) with the data of B∗multiplied
by 10 and C∗allows direct estimate of YH. YC was
arbitrar-ily assumed equal to YH. Because the biomass of HNF and
ciliates was not measured simultaneously with bacterial pro-duction (see Tanaka and Rassoulzadegan, 2002, 2004), we used annual mean values in biomass of bacteria, HNF and ciliates obtained in 1999–2000, but the depths correspond to those of bacterial production.
Using the estimated parameters combined with the annual mean of integrated biomass of bacteria, HNF and ciliates, carbon flows between the microbial heterotrophs and
zoo-plankton were estimated over the mesopelagic layer: δBVB∗
from bacteria to viruses, αHB∗H∗ from bacteria to HNF,
αCH∗C∗ from HNF to ciliates, and YC αCH∗C∗from
cil-iates to zooplankton. Error estimates in the carbon flow were evaluated by taking into account standard errors (SE) of the
regression slopes (αH and YH)and of the regression
inter-cept (δBV).
5 Results and discussion
Significant linear regressions were obtained in both Eqs. (4) and (5), while the coefficient of regression was not
high for Eq. (4) (Table 1; Fig. 3). Specific
clear-ance rate (±SE) of HNF for bacteria was estimated to
be 0.0007±0.0001 L nmol-C−1 d−1 over the 110–1000 m.
Based on measurement of uptake rates of fluorescently la-beled bacteria by HNF, Cho et al. (2000) reported that HNF
clearance rates ranged from 1 to 11 nL HNF−1h−1in the
up-per 500 m of the East Sea. By using the mean cell volume
of 20 µm3HNF−1in the mesopelagic layer of our study site
(Tanaka and Rassoulzadegan, 2002) and a carbon to volume
conversion factor of 183 fg C µm−3(Caron et al., 1995), the
above range of clearance rates is transformed to the carbon-based specific clearance rate as 0.00008 to 0.0009 L
nmol-C−1 d−1. Our estimate is in the upper part of this range.
HNF growth efficiency on bacteria was estimated to be 1.12 (±0.15)%. This estimate is sensitive to the assumption of the ratio of ciliates to HNF specific clearance rate in our model. Instead of the original assumption made, if we as-sume that specific clearance rate is as high for ciliates as
HNF, or as low for HNF as ciliates (i.e. αC=αH), HNF
growth efficiency is estimated to be 11.2 (±1.5)%. Ranges of growth efficiency measured under variable experimental conditions (e.g. temperature and prey concentration) were from 4 to 49% for flagellates and from 2 to 82% for ciliates
12 T. Tanaka et al.: Analyzing the trophic link between the mesopelagic microbial loop and zooplankton
Table 2. Carbon flow estimates for the mesopelagic layer (110–1000 m), which are based on the estimated parameters (±SE) of αH
(0.0007±0.0001), YH (0.0112±0.0015), δBV (0.0069±0.002). Data on annual mean biomass are from Tanaka and Rassoulzadegan (2002).
Mean biomass (mmol-C m−2) Carbon flow (±SE) (mmol-C m−2yr−1)
Bacteria 130 327 (±95) (to viruses) 249 (±36) (to HNF)
HNF 6.7 2.2 (±0.32) (to ciliates)
Ciliates 11.7 0.025 (±0.007) (to zooplankton)
H* (nmol-C L-1) 0 5 10 15 20 25 B P /B * (d -1) 0.00 0.01 0.02 0.03 0.04 10 x B* (nmol-C L-1) 0 500 1000 1500 2000 2500 3000 C * (n m ol -C L -1) 0 10 20 30 40 (a) (b)
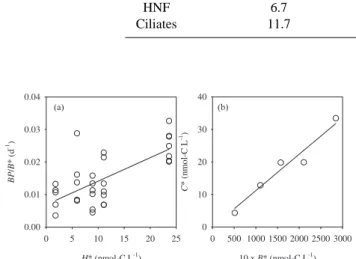
Fig. 3. Rate estimations by fitting the model-derived equations. (a)
Relationship between BP /B∗ and H∗, (b) Relationship between
C∗and 10 B∗in the 110–1000 m. BP , B, H and C denote bac-terial production, biomass of bacteria, heterotrophic nanoflagellates and ciliates, respectively. The asterisk denotes steady state biomass. Data on biomass and bacterial production are from Tanaka and Ras-soulzadegan (2002) and Tanaka and RasRas-soulzadegan (2004), re-spectively. The lines were calculated with a linear regression model I (Table 1).
(reviewed by Caron and Goldman, 1990). A barophilic flag-ellate isolated from 4500 m depth sediments showed 17–25% of growth efficiency under the condition of bacterial preys on
the order of 1010cells L−1enriched with sterilized
phytode-tritus (Turley et al., 1988). Our estimates are in the lower end of or smaller than the reported ranges. Under the assumption that the study site is in an approximate steady-state over mul-tiyear in terms of OC stock and that most of OC remineral-ization can be attributed to bacteria in the mesopelagic layer, bacterial growth efficiency has been estimated to be 19–39% on an annual scale, by replacing a total amount of OC assim-ilated by bacteria with the OC flux between 110 and 1000 m (Tanaka and Rassoulzadegan, 2004). This may suggest that the bacterial ingestion by HNF functions as remineralization rather than energy transfer to higher trophic levels. It has been demonstrated that HNF can release a significant frac-tion of ingested prey as dissolved organic matter (reviewed by Nagata, 2000). Although no data on HNF respiration and egestion are available for the mesopelagic layer, the OC eges-tion by HNF seems to be less significant in the OC-limited condition.
A back-calculation, using the estimated parameters and the annual mean of integrated biomass, suggests that 40–
48% of bacterial mortality is due to HNF predation and the rest due to viruses over the mesopelagic layer (Ta-ble 2). This however may be contrary to a recent sugges-tion that virus-induced mortality of bacteria is low (3–6%) in the mesopelagic and bathypelagic layers at the same site (Weinbauer et al., 2003). Because the empirical model to estimate virus-induced mortality of bacteria is not derived from mesopelagic and bathypelagic layers and data on virus-induced mortality of bacteria in the ocean aphotic layer have been limited to this study site (Weinbauer et al., 2003), it may be difficult to validate these estimates at present. Of total bacterial production that is equivalent to bacterial mor-tality by viruses and HNF, 0.36–0.43% and 0.0039–0.0046% are transferred to ciliates and zooplankton, respectively.
An-other assumption (αC=αH)results in slightly higher transfer
of bacterial production to ciliates (3.6–4.3%) and zooplank-ton (0.39–0.46%). This suggests a distance of the trophic link between “viruses, bacteria and HNF” and “ciliates and zooplankton”. Conceptually, specialized zooplankton (e.g. appendicularians and salps) that can consume particles as small as bacteria may reduce this distance by making a short-cut between the microbial loop and zooplankton. The obser-vation of pellet fluxes at 500 m at the study site suggested the presence of mesopelagic appendicularians (Carroll et al., 1998), which were dominant in the macrozooplankton com-munity around 400 m near the study site (Laval et al., 1989). Due to the paucity of data on zooplankton distribution and feeding, effect of such specialized zooplankton on our model remains to be open. Precision in our estimates of carbon flow may have suffered from the relatively low precision in microscope-based biomass estimates.
Increase in number of trophic levels generally results in less efficient material transfer from lower to higher trophic levels or more efficient remineralization in the food web, which has been addressed as a function of the microbial loop in the euphotic layer (Azam et al., 1983). This con-text may be reflected in the mesopelagic layer, where all mi-crobial heterotrophs and zooplankton exist and constitute the mesopelagic food chain. Our model analysis suggests that the mesopelagic bacterial production is similarly allocated to “DOC-bacteria-viruses” circuit and “DOC-microbial loop” circuit, or 1.5 times greater to the former than the latter, and that HNF are potentially important remineralizers of the mesopelagic bacterial production.
Acknowledgements. This work was supported by the EC through contracts EVK3-CT-1999-00009 (Cycling of Phosphorus in the Mediterranean) and EVK3-CT-2001-00049 (Detection and Analysis of Nutrient Limitation) and by the EU through contract HPRI-1999-CT-00056 (Bergen Marine Food Chain Research Infrastructure).
Edited by: C. M. Duarte
References
Andersen, V. and Prieur, L.: One-month study in the open NW Mediterranean Sea (DYNAPROC experiment, May 1995): overview of the hydrobiogeochemical structures and effects of wind events, Deep-Sea Res. I, 47, 397–422, 2000.
Avril, B.: DOC dynamics in the northwestern Mediterranean Sea (DYFAMED site), Deep-Sea Res. II, 49, 2163–2182, 2002. Azam, F., Fenchel, T., Field, J. G., Gray, J. S., Meyer-Reil, L. A.,
and Thingstad, T. F.: The ecological role of water-column mi-crobes in the sea, Mar. Ecol. Prog. Ser., 10, 257–263, 1983. B´ethoux, J.-P., Prieur, L., and Bong, J. H.: The Ligurian current off
the French Riviera, Oceanol. Acta, 9, 59–67, 1988.
Caron, D. A. and Goldman, J. C.: Ecology of marine protozoa, edited by: Capriulo, G. M., Oxford Univ. Press, New York, 283– 306, 1990.
Caron, D. A., Dam, H. G., Kremer, P., Lessard, E. J., Madin, L. P., Malone, T. C., Napp, J. M., Peele, E. R., Roman, M. R., and Youngbluth, M. J.: The contribution of microorganisms to partic-ulate carbon and nitrogen in surface waters of the Sargasso Sea near Bermuda, Deep-Sea Res. I, 42, 943–972, 1995.
Carroll, M. L., Miquel, J.-C., and Fowler, S. W.: Seasonal patterns and depth-specific trends of zooplankton fecal pellet fluxes in the Northwestern Mediterranean Sea, Deep-Sea Res. I, 45, 1303– 1318, 1998.
Cho, B. C. and Azam, F.: Major role of bacteria in biogeochemical fluxes in the ocean’s interior, Nature, 332, 441–443, 1988. Cho, B. C., Na, S. C., and Choi, D. H.: Active ingestion of
fluores-cently labeled bacteria by mesopelagic heterotrophic nanoflagel-lates in the East Sea, Korea. Mar. Ecol. Prog. Ser., 206, 23–32, 2000.
Copin-Mont´egut, G. and Avril, B.: Vertical distribution and tempo-ral variations of dissolved organic carbon in the North-Western mediterranean Sea, Deep-Sea Res. I, 40, 1963–1972, 1993. Fenchel, T.: Ecology of protozoa, Science Tech. Inc., USA, 1987. Fowler, S. W. and Knauer, G. A.: Role of large particles in the
trans-port of elements and organic compounds through the oceanic wa-ter column, Prog. Oceanogr., 16, 147–194, 1986.
Harris, J. R. W., Stutt, E. D., and Turley, C. M.: Carbon flux in the northwest Mediterranean estimated from microbial production, Deep-Sea Res. II, 48, 2631–2644, 2001.
Laval, P., Braconnot, J. C., Carre, C., Goy, J., Morand, P., and Mills, C. E.: Small-scale distribution of macroplankton and micronek-ton in the Ligurian Sea (Mediterranean Sea) as observed from the manned submersible Cyana, J. Plankton Res., 11, 665–685, 1989.
Martin, J. H., Knauer, G. A., Karl, D. M., and Broenkow, W. W.: VERTEX: carbon cycling in the northeast Pacific, Deep-Sea Res., 34, 267–285, 1987.
Marty, J.-C.: DYFAMED Observation Service, http://www. obs-vlfr.fr/jgofs2/sodyf/home/htm, 2003.
Marty, J.-C. and Chiav´erini, J.: Seasonal and interannual variations in phytoplankton production at DYFAMED time-series station, Northwestern Mediterranean Sea, Deep-Sea Res. II, 49, 2017– 2030, 2002.
Marty, J.-C., Nicolas, E., Miquel, J.-C., and Fowler, S. W.: Par-ticulate fluxes of organic compounds and their relationship to zooplankton fecal pellets in the northwestern Mediterranean Sea, Mar. Chem., 46, 387–405, 1994.
Miquel, J.-C., Fowler, S. W., and La Rosa, J.: Vertical fluxes in the Ligurian Sea, Ann. Inst. Oc´eanogr. Paris, 69, 107–110, 1993. Miquel, J.-C., Fowler, S. W., La Rosa, J., and Buat-Menard, P.:
Dynamics of the downward flux of particles and carbon in the open northwestern Mediterranean Sea, Deep-Sea Res. I, 41, 243– 261, 1994.
Nagata, T.: Microbial Ecology of the Oceans, edited by: Kirchman, D. L., Wiley-Liss, Inc., New York, 121–152, 2000.
Ridame, C. and Guieu, C.: Saharan input of phosphate to the olig-otrophic water of the open western Mediterranean Sea, Limnol. Oceanogr., 47, 856–869, 2002.
Smith, D. C., Simon, M., Alldredge, A. L., and Azam, F.: Intense hydrolytic enzyme activity on marine aggregates and implica-tions for rapid particle dissolution, Nature, 359, 139–142, 1992. Tamburini, C., Garcin, J., Ragot, M., and Bianchi, A.: Biopolymer
hydrolysis and bacterial production under ambient hydrostatic pressure through a 2000 m water column in the NW Mediter-ranean, Deep-Sea Res. II, 49, 2109–2123, 2002.
Tanaka, T. and Rassoulzadegan, F.: Full-depth profile (0–2000 m) of bacteria, heterotrophic nanoflagellates and ciliates in the NW Mediterranean Sea: Vertical partitioning of microbial trophic structures, Deep-Sea Res. II, 49, 2093–2107, 2002.
Tanaka, T. and Rassoulzadegan, F.: Vertical and seasonal variations of bacterial abundance and production in the mesopelagic layer of the NW Mediterranean Sea: Bottom-up and top-down con-trols, Deep-Sea Res. I, 51, 531–544, 2004.
Thingstad, T. F.: Microbial Ecology of the Oceans, edited by: Kirchman, D. L., Wiley-Liss, Inc., New York, 229–260, 2000. Turley, C. M. and Stutt, E. D.: Depth-related cell-specific bacterial
leucine incorporation rates on particles and its biogeochemical significance in the Northwest Mediterranean, Limnol. Oceanogr., 45, 419–425, 2000.
Turley, C. M., Lochte, K., and Patterson, D. J.: A barophilic flag-ellate isolated from 4500 m in the mid-North Atlantic, Deep-Sea Res., 35, 1079–1092, 1988.
Weinbauer, M. G., Brettar, I., and H¨ofle, M. G.: Lysogeny and virus-induced mortality of bacterioplankton in surface, deep, and anoxic marine waters, Limnol. Oceanogr., 48, 1457–1465, 2003.