HAL Id: hal-03205271
https://hal.sorbonne-universite.fr/hal-03205271
Submitted on 22 Apr 2021
HAL is a multi-disciplinary open access
archive for the deposit and dissemination of
sci-entific research documents, whether they are
pub-lished or not. The documents may come from
teaching and research institutions in France or
abroad, or from public or private research centers.
L’archive ouverte pluridisciplinaire HAL, est
destinée au dépôt et à la diffusion de documents
scientifiques de niveau recherche, publiés ou non,
émanant des établissements d’enseignement et de
recherche français ou étrangers, des laboratoires
publics ou privés.
MEGAFAUNAL BIOTURBATION ON NEMATODE
COMMUNITY STRUCTURE
M Austen, D Parry, S Widdicombe, P Somerfield, M Kendall
To cite this version:
M Austen, D Parry, S Widdicombe, P Somerfield, M Kendall. MACROFAUNAL MEDIATION OF
EFFECTS OF MEGAFAUNAL BIOTURBATION ON NEMATODE COMMUNITY STRUCTURE.
Vie et Milieu / Life & Environment, Observatoire Océanologique - Laboratoire Arago, 2003,
pp.201-209. �hal-03205271�
MACROFAUNAL MEDIATION OF EFFECTS OF MEGAFAUNAL
BIOTURBATION ON NEMATODE COMMUNITY STRUCTURE
M. C. AUSTEN
*1, D. M. PARRY
2, S. WIDDICOMBE
1, P. J. SOMERFIELD
1,
M. A. KENDALL
1 1Plymouth Marine Laboratory, Prospect Place, West Hoe, Plymouth, PL1 3DH,UK 2 School of Earth, Ocean and Environmental Sciences, University of Plymouth, Drakes Circus,Plymouth, PL4 8AA,UK * Corresponding author: MCVA@mail.pml.ac.uk
SURFACE FEATURES BENTHIC DIVERSITY BIOTURBATION MEGAFAUNA MEIOFAUNA MACROFAUNA NEMATODES
ABSTRACT. – In a detailed field survey, spatial structure was observed in the dis-tribution of subtidal, meiofaunal nematode communities. There were no correla-tions between nematode community structure and distribution of megafaunal surface features. Certain combinations of 9-11 megafaunal surface features were weakly correlated with nematode communities but only the presence of thalassinid burrow openings within a 15 cm radius of a meiofauna sample and distance to the nearest megafaunal surface feature consistently featured in these combinations (and then only for correlations with transformed nematode data). This is contrary to pre-vious experimental and field observations that suggest such relationships should exist. Nematode and macrofaunal community structure were correlated. Since rela-tionships also exist between macrofauna and megafauna community structure this suggests that links between meiofauna and megafauna are mediated by macrofauna.
CARACTÉRISTIQUES DE SURFACE DIVERSITÉ BENTHIQUE BIOTURBATION MÉGAFAUNE MÉIOFAUNE MACROFAUNE NÉMATODES
RÉSUMÉ. – Lors d’une étude détaillée, la structure spatiale de la distribution des communautés de Nématodes de la méiofaune subtidale a été observée. Aucune cor-rélation entre la structure de la communauté des Nématodes et la distribution des dispositifs de surface de la mégafaune n’a été décelée. Certaines combinaisons de 9 à 11 dispositifs externes de la mégafaune sont faiblement corrélées avec les com-munautés de Nématodes ; mais c’est uniquement le cas des ouvertures des terriers de Thalassinidés dans un rayon de 15 cm d’un échantillon de méiofaune avec la dis-tance à la plus proche structure de surface de la mégafaune qui apparaît toujours parmi ces combinaisons (et seulement pour les corrélations obtenues à partir des données transformées sur les Nématodes). Ces résultats sont en contradiction avec les observations antérieures, expérimentales ou de terrain, qui suggéraient que de telles relations existaient. La structure des communautés de Nématodes et celle de la mégafaune sont corrélées. L’existence de relations entre la structure des commu-nautés de Nématodes et de la mégafaune suggère que les liens entre la méiofaune et la mégafaune sont assurés par la macrofaune.
INTRODUCTION
Correlative evidence from field surveys suggests macrofauna-meiofauna interactions are important in structuring meiofaunal communities (e.g. Bell et al. 1978, Thistle 1979, Reise 1981, 1987, Reidenauer 1989, Dittman 1990, Warwick et al. 1990, 1997). Additionally, experimental evidence indicates that at the species level, meiofauna com-munities in soft sediments are structured by differ-ent types and densities of large macrofauna (e.g. Bell 1980, 1985, Warwick et al. 1986, Olafsson & Elmgren 1991, Aarnio et al. 1998, Austen & Widdicombe 1998, Austen et al. 1998, Schratzberger & Warwick 1999, Botto & Iribane 1999, Tita et al. 2000). Megafauna are defined
op-erationally as those organisms large enough to be observed by a camera (Grassle et al. 1975), while meio- and macofauna are defined as metazoan or-ganisms retained on a 63 µm or 0.5 mm mesh sieve respectively. In reality, the size threshold for megafaunal species is variable because the abso-lute dimensions of an organism on an image de-pend upon camera orientation and image resolu-tion. For practical purposes, in the present study it encompasses large epibenthic macrofauna individ-uals and biotic sediment structures associated with burrowing megafauna that are larger than 10 mm and can be viewed through the video camera ployed on a remotely operated vehicle (ROV) de-scribed below.
Structuring of meiofaunal communities by macrofauna and megafauna occurs through either
predation or bioturbation activities which alter sed-iment structure or water and oxygen flow through the sediment and at the sediment-water interface. Bioturbation may in turn affect meiofauna either directly, through alteration of the physical and chemical properties of the sedimentary habitat cluding direct burial of associated organisms, or in-directly, by altering microbial dynamics and hence benthic trophic structure.
Field evidence of a direct link between the activ-ity of large macrofauna or megafauna and the structure of meiofauna communities is still rare. This is partially due to difficulties of designing and carrying out field experiments that can prove cause and effect. For example, Austen & Thrush (2001) were unable to demonstrate effects of the horse mussel Atrina zeelandica on nematode community structure despite strong correlative evidence from Warwick et al. (1997) that such effects would be likely. Possible causes for that lack of effect may have been due to problems of spatial and temporal scale of sampling.
Most experiments and surveys have tended to be carried out in intertidal areas where there is strong visual evidence of macrofaunal bioturbation activ-ity, usually by a single dominant species (see refer-ences above). Similarly field experiments have been carried out with single macrofaunal species being manipulated. Yet, in subtidal habitats there may be several bioturbating organisms present in close proximity within the sediment (Atkinson et al. 1998, Parry et al. 2002, 2003).
Parry et al. (2002, 2003) indicated that megafauna can be visually enumerated by analys-ing seabed surface images recorded from a video camera deployed on a remotely operated vehicle (ROV). Such data describes the biologically-medi-ated landscape rather than megafaunal species abundance because different burrows have a vari-able number of surface openings. Nevertheless, the morphology of surface features may be used to in-fer the identity of species responsible for burrow construction (e.g. Nickell & Atkinson 1995). In an exploratory study a 3m× 3m grid was videoed and benthos were sampled within the grid to determine whether megafaunal assemblages are surrogates for benthic community structure Widdicombe et al. (2003, this issue) and therefore whether such video sampling can be used to develop rapid assessment techniques for macrofaunal community monitor-ing. The survey yielded promising results indicat-ing a relationship between diversity of macrofauna and of surface megafauna features and between multivariate megafaunal community structure (in-dicated by megafaunal surface features) and macrofaunal community structure. In this study we test the hypotheses that there is a direct relation-ship between the field distribution of megafauna and meiofaunal nematode assemblage structure in subtidal communities. We then test the hypothesis
that there is a relationship between field distribu-tions of subtidal macrofauna and meiofauna.
METHODS
Study area, sampling and faunal analysis: Surveys and sampling were carried out on 30-31st May 2000. Study area, megafaunal surface features and core sampling are described in detail by Widdicombe et al. (2003, this issue) and are briefly summarised here. The study was carried out in Jennycliff Bay, a sheltered, muddy sand area at 10 m depth located in Plymouth Sound, SW England (50º21.0´N 04º07.8´W). High megafaunal bio-turbation occurs patchily across this site (Parry 2002).
A 3m× 3m steel frame supported on 4 steel legs with an intersecting 0.5 m2grid constructed using polypropy-lene cord at 0.5 m intervals was gently placed on the sea-bed by SCUBA divers with the legs protruding 40 cm above the sea-bed.
A video camera deployed from an ROV was used to film megafaunal individuals and biogenic surface featu-res greater than 1 cm in diameter within each of the 50x50 cm cells. Recorded video images were analysed and the following megafaunal surface feature categories were identified and enumerated: thalassinidean burrow openings, thalassinidean mounds, bivalves (single sur-face openings with visible bivalve siphon tips), Gone-plax rhomboides burrows, circular openings about 1 cm in diameter, 3-siphoned openings and 2 openings in a common pit. The size and position of each megafaunal surface feature or individual organism was determined using Benthic Imager software (University of Plymouth, UK; Pilgrim et al. 2000).
After the grid was videoed SCUBA divers removed 61 cores (10 cm diameter) one sample at the centre of each cell and a sample at each intersection of the grid (Fig. 1). On board the dive vessel a single meiofaunal core sample was taken from each core using a 50 ml sawn off plastic syringe (internal diameter 2.6 cm) pus-hed into the sediment to a depth of 5 cm. Sampling was restricted to the first 5 cm of sediment because in most coastal habitats with a high proportion of fine sediments > 90% of the meiofauna are found in the surface 1-2 cm (Coull 1992). The remainder of the core was kept for macrofauna.
Within 4 hours of sample collection, macrofauna and meiofauna samples were fixed and then kept in 10% for-malin for a minimum of 4 days. Macrofauna samples were washed over a 0.5 mm mesh, all animals were ex-tracted and identified under a binocular microscope to the lowest practical taxonomic level (Widdicombe et al. 2003, this issue). Meiofauna were extracted from the se-diment using flotation in Ludox TM colloidal silica (McIntyre & Warwick 1984) with a 63µm sieve. Sam-ples were placed in 10% glycerol, evaporated to anhy-drous glycerol, and then mounted on slides for microscopic identification and enumeration of all nema-todes to lowest practical taxonomic level. For those ge-nera where it is difficult to distinguish species amongst juvenile or female specimens, or where only female or juvenile specimens were observed, nematodes were identified only to genus level.
Data analysis: The distance between each meiofau-na/macrofauna core and each megafaunal surface-fea-ture was calculated using MATLAB software (version 5.03, The MathWorks Inc.). Around each core biogenic features were quantified with progressively larger vir-tual quadrats of 5, 10, 15, 20, 25, 30, 35, 40, 45 and 50 cm radius. For each core, distance to the nearest fea-ture in each megafaunal category was determined and also distance to the nearest feature regardless of identity. Multivariate data analysis followed methods descri-bed by Clarke & Warwick (2001) and Clarke (1993) using the PRIMER version 5.2 software package (Clarke & Warwick 2001). In all statistical tests a significance level of p < 0.05 was used for 1-tailed tests and for 2-tai-led tests 0.975 < p < 0.025. Analysis was carried out using a range of data transformations to determine the effects of the treatments on different aspects of the com-munity: a) no transformation – sensitive to changes in the abundance of the dominant species, b)√ transforma-tion – detects effects on community structure generally without being unduly influenced by either dominant or rare species, c)√√transformation – sensitive to changes in abundance of the lower abundance and rare species. Similarity matrices for faunal data were constructed using the Bray Curtis similarity index.
Spatial autocorrelation of nematode samples: The rela-tionship between nematode community structure and the spatial variation in assemblage composition encompas-sed by the sampling design was examined using RELATE analysis to give an indication if there was any spatial autocorrelation (Somerfield & Gage 2000). Spa-tial distances between every pair of samples were com-puted and used to create a spatial distance matrix. RELATE computes a rank Spearman correlation coeffi-cient between the faunal similarity matrix and the spatial distance matrix and the significance of this correlation is then tested by a randomisation/permutation test. To de-termine if samples a certain distance apart were more li-kely to be spatially autocorrelated and to determine what distance this might be, the RELATE analysis was repea-ted but this time constructing a series of ‘model’ matri-ces representing a range of distance classes. In each ‘model’ matrix pairs of samples that were within speci-fied distance classes are coded as 1 and the rest of the entries are coded as 0 (Somerfield & Gage 2000). Relating megafaunal surface feature diversity and ma-crofaunal diversity to nematode diversity: Total nema-tode diversity (number of species/taxa) was plotted against diversity of megafaunal surface features (number of types of features) within the surrounding quadrat with a radius of 25 cm and against macrofaunal diversity in the same core sample. To compare diversity at a larger spatial scale, total nematode (number of species/taxa) and macrofaunal diversity within a 50 cm radius quadrat was determined from 5 pooled cores located within each of nine, non overlapping 50 cm radius quadrats (Fig. 1). Nematode diversity was then plotted against megafaunal surface feature diversity and macrofaunal diversity in these nine 50 cm radius quadrats.
Relating nematode diversity and abundance to distance of nearest megafaunal surface feature: For each nema-tode core sample and for each type of megafaunal sur-face feature, nematode diversity (number of species) and
abundance were plotted against distance to nearest fea-ture. Similarly, distance to nearest feature regardless of the identity of that feature was plotted against nematode abundance and diversity. Where the distance to the nea-rest feature was greater than the distance to the edge of the plot the nematode sample was excluded from the plot.
Multivariate relationships between megafaunal surface features data and nematode community structure: For each set of virtual quadrats of the same size (15, 20, 25, 30, 35, 40, 45, 50 cm radius), pair-wise Bray-Curtis si-milarities were calculated between quadrats of megafau-nal surface-features (untransformed and fourth root transformed data) from which similarity matrices were constructed. RELATE analysis was used to compare each of these matrices with the equivalent matrices cal-culated from the nematode abundance data for corres-ponding cores or groups of cores. For the smallest virtual quadrat size (15 cm radius) all nematode samples were used in the analysis. However, larger quadrats overlapped more than one nematode sample. Consequen-tly, for comparisons involving quadrats greater than 15 cm radius smaller subsets of nematode samples were used to ensure sample independence. For quadrats of 20 cm and 25 cm radius 2 separate subsets of nematode cores were used (Fig. 1), for quadrats with a radius grea-ter than 25 cm a subset of only 9 core samples was used
MEGAFAUNAL SURFACE FEATURES AND NEMATODES 203
Fig. 1. – Layout of grid indicating position of 10 cm ben-thic cores for sampling macrofauna and meiofauna (small circles), position of large 50 cm radius virtual quadrats (large dashed circles) for megafaunal surface feature correlations with nematode data for which either 5 benthic cores wholly inside each quadrat were used to provide pooled or mean nematode data values or the cen-tral core alone in different comparative analyses. Shaded and unshaded benthic cores indicate two separate sets of cores used in RELATE analysis to correlate nematode community structure and megafaunal surface features data within 20 and 25 cm radius virtual quadrats.
in the RELATE analysis (these are the nine cores at the centre of each of the 50 cm radius virtual quadrats shown in Fig. 1). In an additional analysis for the largest quadrat size (50 cm radius) surface feature similarities between each of the nine, non-overlapping, 1 m diameter surface-feature samples, were compared with nematode similarity matrices constructed using mean Bray-Curtis similarity values calculated from pair-wise analyses bet-ween the pooled meiofauna cores contained within the area of each of the 50 cm radius surface-feature qua-drats.
Correlation of different megafaunal surface features with nematode community structure: Distance to the nea-rest feature, identity of the neanea-rest feature, position of core (x or y coordinate on the grid) and abundances of each megafaunal surface feature within virtual quadrats at 5 cm radius intervals from each core up to a maximum of 50 cm radius were considered as possible explanatory variables for nematode community structure. A BVSTEP analysis was used to test whether any variable or any combination of variables, was correlated with any multi-variate aspect of nematode community structure (Clarke & Warwick 2001). The nematode data was subjected to a range of transformations to construct Bray-Curtis simila-rity matrices which were correlated, using a Spearman rank correlation, with a distance matrix constructed from the megafaunal surface features ‘variables’ data using normalised Euclidean distance. Perimeter cores which were less than 50 cm from the edge of the grid were ex-cluded from the analysis as not all of the corresponding megafaunal surface features up to 50 cm radius from these samples would have been quantified if they were outside of the grid. BVSTEP was conducted with 40 ran-dom restarts including a ranran-dom 50% of the variables to determine which minimum number of variables gave the best correlation with the nematode data (Clarke & War-wick 2001).
Multivariate relationships between macrofaunal commu-nity structure and nematode commucommu-nity structure: Pair-wise Bray-Curtis similarities (untransformed and fourth
root transformed data) between macrofaunal samples were calculated and similarity matrices constructed. RELATE was used to compare these matrices with the equivalent matrices calculated from the nematode abun-dance data. To consider the effects of macrofauna body size, all macrofauna species were allocated to one of three size classes based on a combination of geometric weight classes (Warwick 1984) and using the allocation of species in Jennycliff to each size class determined by Kendall & Widdicombe (1999). Species of geometric weight classes 10-14 were classified as small, species between 15 and 19 were classed as medium and the re-maining larger animals classed as large. Again, for each size class pair-wise Bray-Curtis similarities (untransfor-med and fourth root transfor(untransfor-med data) between macro-faunal samples were calculated and similarity matrices constructed and using RELATE these were compared with the equivalent matrices calculated from the nema-tode abundance data.
RESULTS
A total of 113 nematode taxa (species or genera) were identified from the 3 × 3 m grid. Number of taxa per sample ranged between 20 and 54 (mean = 35, standard deviation = 8) and abundance ranged from 59 to 2495 nematodes per sample (mean = 507, standard deviation = 379). A total of 312 megafaunal surface features were identified within the grid ranging from 3 to 16 features per 0.25 m2
grid cell (mean = 8.7 standard deviation = 3.81). Spatial autocorrelation of nematode samples
Results of RELATE analysis for spatial autocorrelation are shown in table I. There was a very weak but significant spatial autocorrelation
Table I. – Results of RELATE analysis for spatial autocorrelation of nematode data. Bold values indicate significant positive correlation at p < 5% (one-tailed test) or significant negative or positive correlation correlation at 97.5% < p < 2.5%.
across the whole grid for untransformed and square root transformed nematode data. This autocorrelation was again weak but significant at a spatial level of 0-50 cm regardless of data transfor-mation. RELATE analysis, to determine if there was an optimum distance apart between cores for maximum autocorrelation, indicated that cores sep-arated by 30-40 cm and 50-60 cm were signifi-cantly but weakly autocorrelated.
Relating megafaunal surface feature diversity and macrofaunal diversity to nematode diversity
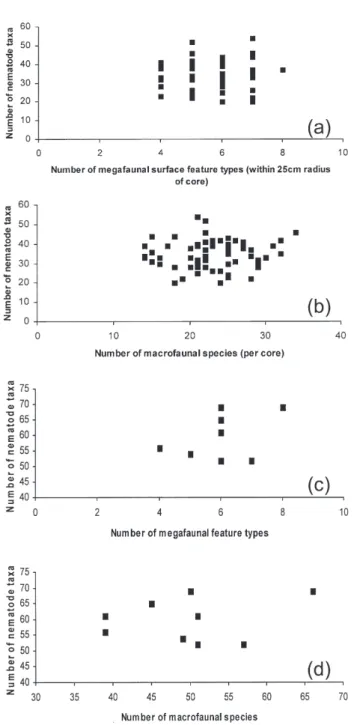
There was no visible relationship between either megafaunal surface feature diversity within a 0.25 m radius of the meiofaunal cores and nema-tode diversity (Fig. 2a), macrofaunal and meiofaunal diversity from the same cores (Fig. 2b), diversity of megafaunal surface features and pooled nematode diversity in 50 cm radius quadrats (Fig. 2c), or macrofaunal diversity and nematode diversity at the same 50 cm radius quadrat spatial scale (Fig. 2d).
Relating nematode diversity and abundance to distance of nearest megafaunal surface feature
There were clearly no visible relationships be-tween either distance of nearest megafaunal sur-face feature or distance of nearest megafaunal fea-ture in each category and either nematode diversity or abundance.
Multivariate relationships between megafaunal surface features data and nematode community structure
In the RELATE analysis there were no signifi-cant relationships between transformed or untrans-formed megafaunal surface feature data and nema-tode data subjected to a range of transformations. Correlation of different megafaunal surface features with nematode community structure
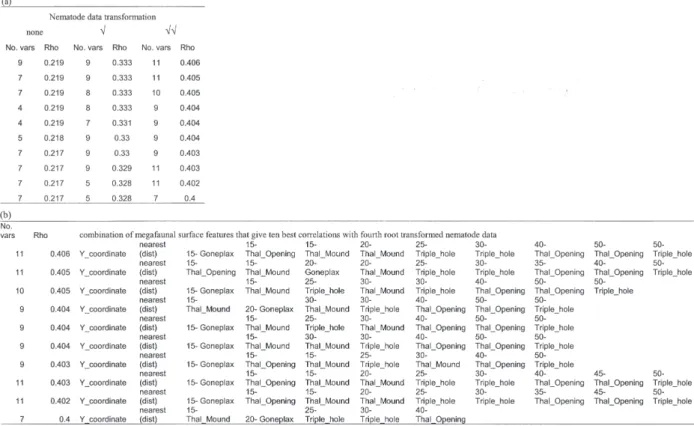
Correlation between nematode community structure and the full range of megafaunal surface features at different spatial scales was weak (Ta-ble IIa) and best correlations were with a combina-tion of 9-11 surface feature variables. Within PRIMER v5.2 it is not possible to test for signifi-cance of these correlations. The strongest correla-tions were evident when the nematode data was heavily transformed (best Rho value = 0.406) and this was with a combination of 11 surface feature variables (Table IIb). For each run of BVSTEP only 1 or 3 surface feature variables were consis-tently among the ten best correlations and then only with nematode data that had been formed. For square root and fourth root
trans-formed nematode data these were thalassinid mounds within 15 cm radius, and also for fourth root transformed nematode data, ‘y coordinate’ (distance from one edge of the grid) and distance to the nearest surface feature.
MEGAFAUNAL SURFACE FEATURES AND NEMATODES 205
Fig. 2. – Comparison of nematode diversity (number of species/taxa) with diversity of megafaunal surface featu-res and macrofauna (a) in 25 cm radius quadrats surroun-ding each nematode core sample (b) in the same core sample (c) in nine 50 cm radius quadrats where the ne-matode sample consists of 5 pooled core samples and (d) in 5 pooled samples within nine 50 cm radius quadrats.
Table II. – Results of BVSTEP analysis a, ten best correlations (rho values) under three different data transformations and the number of variables (No. vars) which give each correlation b, the combination of megafaunal surface features that gives the ten best correlations with fourth root transformed nematode community data. Key: y coordinate = dis-tance from one edge of the grid; nearest (dist) = disdis-tance to the nearest surface feature; Thal_opening = Thalassinidean burrow opening; Thal_mound = Thalassinidean mound; Goneplax = Goneplax rhomboides; Triple_hole = 3-siphoned opening; n-denotes radial distance (cm) from nematode core within which megafaunal surface features occur.
Table III. – Results from RELATE analysis for correlation between macrofaunal and nematode community structure under a range of different data transformations. Bold values indicate significant positive correlation at p < 5%.
Multivariate relationships between macrofaunal community structure and nematode community structure
Nematode community structure correlated sig-nificantly with total macrofauna, small macrofauna and medium macrofauna regardless of data trans-formation of each set of community data (Ta-ble III). Nematode community structure and large macrofaunal community structure were not signifi-cantly correlated. Twelve samples were excluded from the analysis as large macrofauna were absent from them.
DISCUSSION
The detailed survey of a 3 m × 3 m grid re-vealed weak but significant, spatially-related structure within the nematode community. Patches appeared to occur at a scale of 0-50 cm and further analysis suggested that patches were occurring at intervals of 30-70 cm with possible negative cor-relations between patches of lower abundance nematode species at scales of 100-200 cm. Distri-bution of bioturbators causing patchy disturbance seemed to be the most likely cause but analysis failed to reveal any strong relationship between megafaunal surface features and nematode com-munity structure. Weak correlations from BVSTEP suggest that certain features, such as the presence of thalassinid burrow openings within a 15 cm radius, may be of some importance, mostly for the rarer and low abundance nematode species where the correlations were strongest. Yet, the combination of low Rho values, small differences in Rho values within the ten best correlations and the large number and varying nature of best corre-lating variables suggests that these correlations may not be particularly significant. Initially this seems surprising given the strong experimental evi-dence of the effects of bioturbating macrofaunal organisms observed in mesocosm experiments on subtidal meiofauna communities similar to those
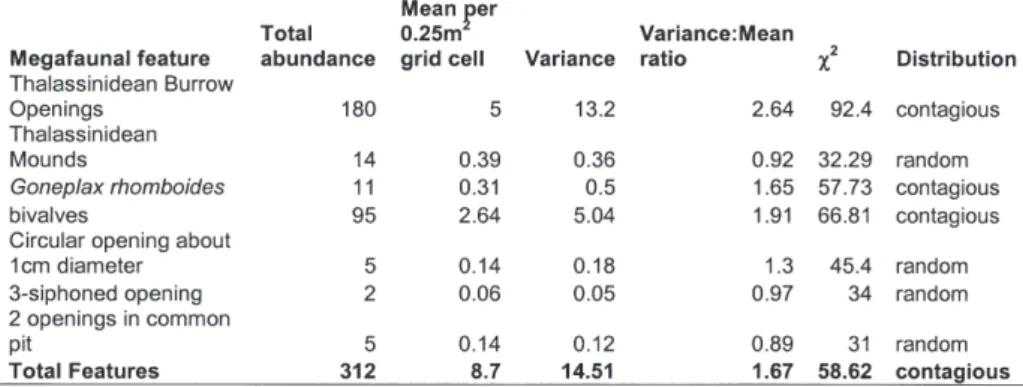
found in the study area. In mesocosm experiments with subtidal sediment (Austen et al. 1998, Austen & Widdicombe 1998) a range of macrofaunal species in different functional groups had significant effects on nematode diversity and nematode species distribution. As pointed out by Widdicombe et al. (2003, this issue) many spe-cies, including those used in the subtidal fauna ex-periments, do not create conspicuous surface fea-tures. Visual mapping of the sediment surface provides information on the identity and distribu-tion of many key bioturbating species but the lack of information on “invisible” species may con-found the search for a relationship between bioturbating macro and megafauna and meiofaunal groups such as nematodes. Experi-mental and field effects have been observed for single species treatments or where there are clear differences in distribution of a single species. In the field situation the combined effects of several different bioturbators might act to homogenise the sediment at the spatial ambit of meiofaunal organ-isms or at the scale at which nematode samples were taken. There were between 3 and 16 megafaunal surface features in each cell. The dis-tribution of each feature was contagious where there were sufficient occurrences for a reasonable test and otherwise random across the grid (Table IV). This would suggest that the overall effect of bioturbation across the grid should not be homo-geneity. Subtle relationships might be evident if the grid survey could be repeated over different spatial scales, combined with fine scale sampling over large spatial areas but this would require a huge amount of effort and is practically difficult in the field, particularly subtidally. In a mesocosm, using fine-scale sampling Warwick et al. (1986) found very localised patchy nematode communities around feeding mounds of the large polychaete Streblosoma bairdi (Malmgren) with nematode patches occurring at a scale of approximately 20-40 cm.
The spacing of core samples was more appropri-ate to look at macrofauna–megafauna interactions rather than meiofauna–megafauna interactions. The
MEGAFAUNAL SURFACE FEATURES AND NEMATODES 207
significant relationship between nematode commu-nity structure and commucommu-nity structure of total macrofauna and also small and medium macrofauna may therefore be of key importance. In RELATE analysis macrofauna were significantly correlated with megafaunal surface features and at the scale of 50 cm radius quadrats macrofauna di-versity and megafaunal surface features were sig-nificantly correlated (Widdicombe et al. 2003, this issue). The significant relationship between macrofauna and meiofaunal community structure might indicate that megafaunal effects on meiofauna are mediated indirectly through the ef-fects of megafauna on macrofauna. Megafauna might have more direct impact on the spatial ambit of macrofaunal organisms. Similarly the ambit of smaller macrofauna might overlap more with that of meiofauna. The 10 cm core sample was large enough to capture a reasonable number of macrofaunal species for statistical analysis but such a sample size might homogenise the small scale patterns occurring in the meiofauna. Small scale landscapes created by megafauna bioturbation at a < 30 cm scale will be modified at much smaller scale (< 5 cm) by macrofauna. This patchiness isn’t seen in a 10 cm macrofauna core but would be very evident at the scale of a meiofauna core.
The lack of significant relationship of meiofaunal and large macrofaunal community structure could be a sampling artefact as larger macrofauna are not sampled well with a 10 cm core and their abundance was low and variable between cores. The relationship between macrofauna and meiofauna community structure was also not observed for diversity but diversity is rarely as sen-sitive a measure of community structure as multivariate aspects of community structure (Clarke & Warwick 1994).
Temporal scale effect was not considered in this snapshot survey. However it could be considered that again macrofauna have a closer temporal ambit to meiofauna than relatively long-lived megafauna. The lifecycle of nematodes is in the order of weeks or months and reproduction is considered to be continuous (Heip et al. 1985) whilst megafauna lifecycles are in the order of years (e.g. Witbaard & Duineveld 1989, Rowden & Jones 1994, Strasser 1999, Kinoshita et al. 2003). Some megafauna such as the large bivalves are relatively immobile (Holme 1959) and it is unlikely that once thalassinids have established burrows that they will readily leave them. The megafaunal surface fea-tures are relatively persistent and their temporal variability is unlikely to be the cause of a lack of strong interaction between megafauna and meiofauna. Macrofauna turnover is slower than meiofauna but many species do have an annual turnover and are likely to be more temporally vari-able and this again may have been reflected in the stronger relationship between nematodes and macrofauna.
Our results suggest that observations in mesocosms in carefully controlled conditions may not transfer directly to field observations, or if they do, the ef-fects might be lost at the scale we sample at.
This is not an argument against experimentation. To the contrary, further controlled experiments are required such as field experiments to determine if the results observed in mesocosm experiments can be extended to the natural habitat and also more complex multispecies experiments within the mesocosm. Once such experiments have been done it might be easier to determine the spatial scale of sampling required to differentiate the complex ef-fects on nematode community structure from ‘noise’ in the megafaunal surface features data.
Similarly, increased effort is required to under-stand the mechanism by which experimentally ob-served bioturbating macrofauna and megafauna af-fect meiofauna. Is it indirectly through alteration of macrofaunal communities, in which case are the larger components of the macrofauna as important as the small and medium size fractions? Or is the effect of megafauna on meiofauna mediated indi-rectly through changes in physical and chemical properties of the sediment that impact on the meiofauna directly and/or on trophically linked sedimentary microbiota?
ACKNOWLEDGEMENTS. – The work contained in this paper was funded by grants from UK DEFRA (project nos. AE1137 and CDEP 84/5/295) and by the UK Natu-ral Environment Research Council through the Plymouth Marine Laboratory research program. We would like to thank Dr A Guarino for identifying the nematodes and Dr M Burrows, Dr L Nickell, Dr D Pilgrim, R Wood, and the Crew aboard RV Squilla and RV Sepia, for pro-viding valuable contributions to aspects of this study.
REFERENCES
Aarnio K, Bonsdorff E, Norkko A 1998. Role of Hali-cryptus spinulosus (Priapulida) in structuring meio-fauna and settling macromeio-fauna. Mar Ecol Prog Ser 163: 145-153.
Atkinson RJA, Froglia C, Arneri E, Antolini B 1998. Observations on the burrows and burrowing beha-viour of Brachynotus gemmellari and the burrows of several other species occurring on the Squilla grounds off Ancona, central Adriatic. Sci Mar 62: 91-100. Austen MC, Widdicombe S 1998. Experimental
evi-dence of effects of the heart urchin Brissopsis lyrifera on associated subtidal meiobenthic nematode commu-nities. J Exp Mar Biol Ecol 222: 219-238.
Austen MC, Widdicombe S, Villano-Pitacco N 1998. Effects of biological disturbance on diversity and structure of meiobenthic nematode communities. Mar Ecol Prog Ser 174: 233-246.
Austen MC, Thrush SF 2001. Experimental evidence suggesting slow or weak response of nematode com-munity structure to a large suspension-feeder. J Sea Res 46: 69-84.
Bell SS 1980. Meiofauna-macrofauna interactions in a high salt marsh habitat. Ecol Monogr 50: 487-505.
Bell SS 1985. Habitat complexity of polychaete tube caps – influence of architecture on dynamics of a meioepibenthic assemblage. J Mar Res 43: 647-671. Bell SS, Watzin MC, Coull BC 1978. Biogenic structure
and its effect on the spatial heterogeneity of meiofau-na in a salt marsh. J Exp Mar Biol Ecol 35: 99-107. Botto F, Iribane O 1999. Effecty of the burrowing crab
Chasmagnathus granulata (Dana) on the benthic community of a SW Atlantic coastal lagoon. J Exp Mar Biol Ecol 241: 263-284.
Clarke KR 1993. Non-parametric multivariate analyses of changes in community structure. Aust J Ecol 18: 117-143.
Clarke KR, Warwick RM 2001. Changes in marine com-munities: an approach to statistical analysis and inter-pretation, 2nd Ed PRIMER-E, Plymouth.
Coull BC 1992. Ecology of the marine meiofauana. In Higgins RP, Thiel H eds, Introduction to the study of meiofauna. Smithsonian Institution, Washington, USA: 18-38.
Dittman S 1990. Mussel beds – amensalism or ameliora-tion for intertidal fauna. Helgol Meeresunters 44: 335-352.
Grassle JF, Sanders HL, Hessler RR, Rowe GT, McLel-lan T 1975. Pattern and zonation: a study of the ba-thyal megafauna using the research submersible Alvin. Deep Sea Research 22: 457-481.
Heip C, Vincx M, Vranken G 1985. The ecology of ma-rine nematodes. Oceanog Mar Biol Ann Rev 23: 399-489.
Holme NA 1959. The British species of Lutraria (La-mellibranchia), with a description of L.angustior Phi-lippi. J Mar Biol Assoc UK 38: 557–568.
Kendall MA, Widdicombe S 1999. Small scale patterns in the structure of macrofaunal assemblages of shal-low soft sediment. J Exp Mar Biol Ecol 237: 127-140. Kinoshita K, Nakayama S, Furota T 2003. Life cycle characteristics of the deep-burrowing mud shrimp Upogebia major (Thalassinidea: Upogebiidae) on a tidal flat along the northern coast of Tokyo Bay. J Crustacean Biol 23: 318-327.
McIntyre AD, Warwick RM 1984. Meiofauna techni-ques. In Holme NA, McIntyre AD eds, Methods for the study of marine benthos. IBP handbook no 16 (2nd ed). Blackwell, Oxford, UK: 217-244.
Nickell LA, Atkinson RJA 1995. Functional morphology and trophic modes of three thalassinidean shrimp spe-cies, and a new approach to the classification of tha-lassinidean burrow morphology. Mar Ecol Prog Ser 128: 181–197.
Olaffson E, Elmgren R 1991. Effects of biological dis-turbance by benthic amphipods Monoporeia affinis on meiobenthic community structure: a laboratory ap-proach. Mar Ecol Prog Ser 74: 99-107.
Parry DM 2002. Quantification of marine megafaunal distribution patterns using a remotely operated ve-hicle. PhD Thesis, Univ Plymouth: 233p.
Parry DM, Nickell LA, Kendall MA, Burrows MT, Pil-grim DA, Jones MB 2002. Comparison of abundance and spatial distribution of burrowing megafauna from diver and Remotely Operated Vehicle observations. Mar Ecol Prog Ser 244: 89–93.
Parry DM, Kendall MA, Pilgrim DA, Jones MB 2003. Identification of patch structure within marine
ben-thic landscapes using a Remotely Operated Vehicle. J Exp Mar Biol Ecol 285–286: 497–511.
Pilgrim DA, Parry DM, Jones MB, Kendall MA 2000. ROV image scaling with laser spot patterns. Under-water Technology 24: 93–103.
Reidenauer JA 1989. Sand-dollar Mellita quinquiesper-forata (Leske) burrow trails: sites of harpacticoid dis-turbance and nematode attraction. J Exp Mar Biol Ecol 130: 223-235.
Reise K 1981. High abundance of small zoobenthos around biogenic structures in tidal sediments of the Wadden Sea. Helgol Meeresunters 34: 413-425. Reise K 1987. Spatial niches and long term performance
in meiobenthic plathelminthes of an intertidal lug-worm flat. Mar Ecol Prog Ser 38: 1-11.
Rowden AA, Jones MB 1994. A contribution to the bio-logy of the burrowing mud shrimp Callianassa sub-terranea (Decapoda: Thalassinidea). J Mar Biol Ass UK 74: 623–635.
Schratzberger M, Warwick RM 1999. Impact of preda-tion and sediment disturbance by Carcinus maenas (L.) on free-living nematode community structure. J Exp Mar Biol Ecol 235: 255-271.
Somerfield PJ, Gage JD 2000. Community structure of the benthos in Scottish Sea-lochs. IV. Multivariate spatial pattern. Mar Biol 136: 1133-1145.
Strasser M 1999. Mya arenaria – an ancient invader of the North Sea coast. Helgol Meeresunters 52: 309–324.
Thistle D 1979. Deep-sea harpacticoid copepod diversity maintenance: the role of polychaetes. Mar Biol 52: 371-376.
Tita G, Desrosiers G, Vincx M, Nozais C 2000. Predation and sediment disturbance effects of the intertidal poly-chaete Nereis virens (Sars) on associated meiofaunal assemblages. J Exp Mar Biol Ecol 243: 261-282 Warwick RM 1984. Species size distributions in marine
benthic communities. Oecologia 61: 32–41.
Warwick RM, Clarke KR, Gee JM 1990. The effect of disturbance by soldier crabs Mictyris platycheles H. Milne Edwards on meiobenthic community structure. J Exp Mar Biol Ecol 135: 19-33.
Warwick RM, Gee JM, Berge JA, Ambrose W Jr 1986. Effects of the feeding activity of the polychaete Stre-blosoma bairdi (Malmgren) on meiofaunal abundance and community structure. Sarsia 71: 11-16.
Warwick RM, McEvoy AJ, Thrush SF 1997. The in-fluence of Atrina zelandica Gray on meiobenthic ne-matode diversity and community structure. J Exp Mar Biol Ecol 214: 231-247.
Widdicombe S, Austen M 2003. Using the surface-featu-res created by bioturbating organisms as surrogates for macrofaunal diversity and community structure. Vie Milieu 53(4): 163–170.
Widdicombe S, Kendall MA, Parry DM 2003. Using the surface-features created by bioturbating organisms as surrogates for macrofaunal diversity and community structure. Vie Milieu 53(4): 179–186.
Witbaard R, Duineveld GCA 1989. Some aspects of the biology and ecology of the burrowing shrimp Callia-nassa subterranea (Montagu) (Thalassinidea) from the southern North Sea. Sarsia 74: 209–219.
Reçu le 22 septembre 2003; received September 22, 2003 Accepté le 18 novembre 2003; accepted November 18, 2003