HAL Id: insu-00545863
https://hal-insu.archives-ouvertes.fr/insu-00545863
Submitted on 19 Sep 2011HAL is a multi-disciplinary open access
archive for the deposit and dissemination of sci-entific research documents, whether they are pub-lished or not. The documents may come from teaching and research institutions in France or abroad, or from public or private research centers.
L’archive ouverte pluridisciplinaire HAL, est destinée au dépôt et à la diffusion de documents scientifiques de niveau recherche, publiés ou non, émanant des établissements d’enseignement et de recherche français ou étrangers, des laboratoires publics ou privés.
The H2O solubility of alkali basaltic melts: an
experimental study
Priscille Lesne, Bruno Scaillet, Michel Pichavant, Giada Iacono-Marziano,
Jean-Michel Bény
To cite this version:
Priscille Lesne, Bruno Scaillet, Michel Pichavant, Giada Iacono-Marziano, Jean-Michel Bény. The H2O solubility of alkali basaltic melts: an experimental study. Contributions to Mineralogy and Petrology, Springer Verlag, 2011, 162 (1), pp.133-151. �10.1007/s00410-010-0588-x�. �insu-00545863�
The H
2O solubility of alkali basaltic melts: an experimental study
Priscille Lesne1, 2 , Bruno Scaillet1, Michel Pichavant1, Giada Iacono-Marziano1 and Jean-Michel Beny1
(1) Institut des Sciences de la Terre d’Orléans, INSU/CNRS-Université d’Orléans, Université François Rabelais de Tours, UMR 6113, 1A, rue de la Férollerie, 45071 Orléans Cedex 02, France
(2) Present address: Department of Earth Sciences, University of Bristol, Wills Memorial Building, Queens Road, Bristol, BS8 1RJ, UK
Abstract
Experiments were conducted to determine the water solubility of alkali basalts from Etna, Stromboli and Vesuvius volcanoes, Italy. The basaltic melts were equilibrated at 1,200°C with pure water, under oxidized conditions, and at pressures ranging from 163 to 3,842 bars. Our results show that at pressures above 1 kbar, alkali basalts dissolve more water than typical mid-ocean ridge basalts (MORB). Combination of our data with those from previous studies allows the following simple empirical model for the water solubility of basalts of varying alkalinity and fO2 to be derived:
where H2OMORB is the water solubility at the calculated P, using the model of Dixon et al.
(1995). This equation reproduces the existing database on water solubilities in basaltic melts to within 5%. Interpretation of the speciation data in the context of the glass transition theory shows that water speciation in basalt melts is severely modified during quench. At magmatic temperatures, more than 90% of dissolved water forms hydroxyl groups at all water contents, whilst in natural or synthetic glasses, the amount of molecular water is much larger. A regular solution model with an explicit temperature dependence reproduces well-observed water species. Derivation of the partial molar volume of molecular water using standard
thermodynamic considerations yields values close to previous findings if room temperature water species are used. When high temperature species proportions are used, a negative partial molar volume is obtained for molecular water. Calculation of the partial molar volume of total water using H2O solubility data on basaltic melts at pressures above 1 kbar yields a value of
19 cm3/mol in reasonable agreement with estimates obtained from density measurements. Keywords Water solubility – Alkali basalts – Experimental petrology – Water speciation, partial
molar volume
Introduction
It is now well established that volatile constituents (H2O, CO2, S) play an important role in
magmatic processes. For instance, arc magmas owe in large part their explosive nature, and thus their dangerousness, to the presence of dissolved volatiles. In particular, H2O, the most
important volatile species present in magmas, has been shown to be the main driving force of explosive volcanic eruptions through magma vesiculation and expansion (e.g. Burnham
1979). A large explosion produces many ejecta, creating a risk for people living around
by volcanic eruptions has been shown to have an effect on the global climate (e.g. Devine et al. 1984; Robock 2000). All these reasons render the quantitative modelling of magma degassing on Earth, one of the major goals of igneous petrology.
Alkali basalts are known to feed the reservoirs of some arc volcanoes (e.g. Stromboli Metrich et al. 2001) which sometimes generate explosive eruptions. Therefore, studying the solubility of water and other major volatiles species dissolved in basaltic melts, both at pressures corresponding to the depth of the reservoir and to different heights in the volcanic conduit, can provide important constraints on the conditions of gas saturation in basaltic systems, as well as on eruptive processes at basaltic volcanoes.
Until today, however, only a few works have been carried out to determine the H2O
solubilities in alkali basaltic melts. Most previous water solubility studies have focused on MORB compositions. Indeed, Dixon et al. (1995) made experiments on MORB melts (Fe-rich basaltic glasses) at pressures between 200 and 700 bars, and Ohlhorst et al. (2001) and Berndt et al. (2002) investigated the water solubility of MORB melts at pressures up to 5,000 bar. Botcharnikov et al. (2005) made some experiments on a moderately alkali-rich basalt but only at a pressure of 5,000 bar. More recently, Behrens et al. (2009) have performed a systematic study on the H2O–CO2 solubilities in a K2O-rich basalt from Colli Albani, Italy at pressures
ranging between 500 and 5,000 bar. Thus, constraints on the water solubility of alkali basaltic melts at pressures between 150 and 2,000 bar are scarce, yet such data are much needed to model volatile behaviour in alkali-rich basaltic reservoirs and associated eruptions.
To fill in this gap, we have conducted experiments on 3 compositions from Vesuvius, Etna and Stromboli volcanoes. These volcanoes commonly erupt basalts of compositions ranging from basalt, K-basalt to tephrite. A good set of data on volcanic gases is available, and pre-eruptive conditions are reasonably well known (Belkin et al. 1998; Signorelli et al. 1999; Bruno et al. 2001; Metrich et al. 2001; Bertagnini et al. 2003; Allard et al. 2006; Di Carlo et al. 2006; Pichavant et al. 2009), which make the application of experiments to natural conditions straightforward. Gas emission measurements at Etna and Stromboli have shown that some eruptions may release up to 105 metric tons/days of H2O, CO2 and S-rich gas during
peak activity (Bruno et al. 2001; Vergniolle and Mangan, 2000; Allard et al. 2006), although the exact mechanism of gas release are still obscure. Confrontation of such measurements with established solubility laws of emitted volatiles is one way to unravel the process of magma degassing at depth (e.g. Spilliaert et al. 2006).
In this paper, we report measurements of water solubility of alkali basalts from these three Italian volcanoes at 1,200°C, at pressures ranging from 160 up to 3,842 bar and at fO2
corresponding to about NNO + 3.5. Concentrations of water in quenched glasses from vapour-saturated experiments were measured by Karl-Fischer titration and infrared spectroscopy. This paper is the first one of a series aimed at establishing thermodynamic models of solubility of C–H–O–S volatiles dissolved in alkali basalts which are needed to quantitatively model magma degassing (Scaillet and Pichavant 2005; Burgisser and Scaillet,
2007).
Experimental techniques
Starting material
Experiments were conducted in parallel with three alkali basalts: VES-9 (tephrite) comes from a mediaeval strombolian eruption of Vesuvius, ET02PA27 (basalt) comes from a lava
flow of the 22/11/2002 eruption on the southern flank of Mount Etna (supplied by N. Métrich) and PST-9 (basalt) is a golden pumice from Stromboli (Di Carlo et al. 2006).
The natural samples were powdered and melted in a Pt crucible at atmospheric pressure, at 1,400°C during 3 h in order to get homogeneous and nominally anhydrous glasses. The resulting glasses were analysed by electron microprobe. Their compositions are listed in Table 1.
Table 1 Starting compositions
Oxides VES-9a ETN-1b PST-9c
SiO2 48.02 47.59 49.40 TiO2 0.96 1.66 0.80 Al2O3 14.52 17.19 15.80 FeO 7.51 10.15 7.64 MnO 0.14 0.17 0.20 MgO 6.82 5.72 8.00 CaO 12.77 10.85 12.70 Na2O 1.80 3.42 2.30 K2O 5.55 1.98 1.90 P2O5 0.65 0.51 0.40 Total 98.74 99.25 99.15
Oxide concentrations were determined by ICPMS at CRPG-Nancy, France
a
Natural alkali basalt from VES-9
b
Natural alkali basalt from ETN-1
c
Natural alkali basalt from PST-9 Capsules and charges
To prevent formation of bubbles in the samples during the experiments, only blocks of glass (less than 2 mm side) were used as starting materials. About 60–100 mg of starting material was used for each experiment. Glass chips were loaded with known amounts of H2O in noble
metal capsules, so that an H2O-rich fluid phase always coexists with the basaltic liquid phase
at the target P–T conditions. Either Pt or AuPd (Au75Pd25, Au80Pd20) capsules (2 cm height,
2.5 mm inner, 2.9 mm outer diameters) were used as containers. AuPd capsules were preferably used in an attempt to minimize iron loss during the experiments. Capsules were sealed by arc welding and then loaded into an internally heated pressure vessel (IHPV).
Equipment and experiments
Experiments were performed in an internally heated pressure vessel (IHPV) working vertically, using pure argon as a pressure medium.
Capsules (up to 6, in most cases 4) were placed together in a sample holder, made of a thin Al2O3 tube, which was hung from a Pt-wire near the top of a double-wound molybdenum
furnace. Temperature was controlled by two type-S thermocouples, placed along the length of the capsules. The temperature difference between the top and the bottom of the capsule was always less than 10°C.
Experiments were ended by using a drop-quench technique (Di Carlo et al. 2006): an
electrical current was passed through the Pt-wire which was melted. Thereafter, capsules felt to the cold part of the vessel (<100°C). The cooling rate was about 100°C/sec (Di Carlo et al.
2006).
Experiments were performed at 1,200°C and at various pressures ranging from 163 to 3,848 bars (see Table 2 for details). Redox conditions were kept oxidizing i.e. at fO2 of about
NNO + 3.9 which is the intrinsic of the IHPV when pressurized with pure Ar under H2
O-saturated conditions; (NNO is the fO2 of the Ni-NiO buffer at the same P and T). Most
experiments lasted between 4 and 8 h. Based on previous experimental works performed using similar procedures, the equilibrium between the basaltic liquid and the fluid phase is considered to be reached under these conditions (Botcharnikov et al. 2005; Dixon et al. 1995; Behrens et al. 2009). In particular, the available constraints on water diffusivity in basaltic melts (Zhang and Stolper 1991) suggest that gas–melt equilibrium is attained in a matter of a few minutes under the experimental conditions investigated here. After the quench, capsules were weighed to verify that they had remained sealed during the experiment and that no weight loss had occurred. The water-saturated condition of experimental charges was
systematically checked by the presence of water bubbles hissing out from the capsules during their opening, together with a wet appearance of recovered glass chips. All experiments performed in this study are reported in Table 2.
Table 2 Experimental conditions
Charge Composition Capsule wt% H2O added % FeO kepta H2Ob
Experiment 1: 2059 bars, 4 h Run1#1 VES-9 Pt 10.0 82 5.30 ± 0.15 Run1#5 PST-9 Pt 10.0 87 4.92 ± 0.15 Experiment 2: 1013 bars, 8 h Run2#11 ETN-1 Pt 7.1 87 3.28 ± 0.15 Run2#12 PST-9 Pt 7.1 94 3.14 ± 0.25 Experiment 3: 524 bars, 4 h Run3#1 VES-9 Pt 5.3 100 2.18 ± 0.02 Run3#2 ETN-1 Pt 5.1 100 2.38 ± 0.06 Run3#3 PST-9 Pt 4.9 97 2.21 ± 0.37 Experiment 4: 269 bars, 4 h Run4#2 ETN-1 Pt 1.7 66 1.68 ± 0.15 Experiment 5: 2138 bars, 5.5 h Run5#1 VES-9 Pt 10.1 92 5.31 ± 0.15 Run5#3 PST-9 Pt 10.1 95 5.19 ± 0.26
Run5#4 ETN-1 Au70Pd30 9.8 99 5.07 ± 0.18
Experiment 7: 1006 bars, 6 h
Run7#1 VES-9 Au70Pd30 6.8 97 3.46 ± 0.15
Run7#2 ETN-1 Au70Pd30 6.6 102 3.59 ± 0.12
Charge Composition Capsule wt% H2O added % FeO kepta H2Ob
Run8#1 VES-9 Au70Pd30 5.2 100 2.08 ± 0.03
Experiment 26: 264 bars, 5 h
Run26#1 VES-9 Au75Pd25 1.6 95 1.56 ± 0.18
Experiment 30: 172 bars, 7 h
Run30#1 VES-9 Au75Pd25 1.3 100 1.18 ± 0.15
Run30#4 ETN-1 Au75Pd25 1.5 99 1.36 ± 0.07
Experiment 37: 163 bars, 4 h
Run37#1 VES-9 Au75Pd25 3.0 101 1.08 ± 0.15
Run37#2 ETN-1 Au75Pd25 2.8 101 1.08 ± 0.07
Run37#3 PST-9 Au75Pd25 2.4 100 0.98 ± 0.15
Experiment 42: 232 bars, 5 h
Run42#1 VES-9 Au75Pd25 2.5 103 1.32 ± 0.15
Run42#3 PST-9 Au75Pd25 2.4 98 1.53 ± 0.03
Experiment 48: 2760 bars, 5 h
Run48#1 VES-9 Au80Pd20 10.1 71 6.58 ± 0.10
Run48#2 ETN-1 Au80Pd20 11.0 102 6.18 ± 0.15
Run48#3 PST-9 Au80Pd20 10.6 98 5.99 ± 0.10
Experiment 51: 3948 bars, 5 h
Run51#1 VES-9 Au80Pd20 11.6 71 ND
Run51#2 ETN-1 Au80Pd20 11.3 95 ND
Run51#3 PST-9 Au80Pd20 11.1 95 ND
Numbers in italic are analytical errors
a
proportion of FeO kept in the glass relative to the initial glass FeO concentration, calculated as 100 * FeOglass/FeOstarting glass, with FeOstarting glass from Table 1
b
H2O dissolved in the melt, measured with KFT
Analytical techniques
Quenched glasses were mounted in epoxy resin and polished with diamond solutions for subsequent electron microprobe analyses. These were performed with a SX50 CAMECA electron microprobe (BRGM-ISTO, Orléans, France), using the following analytical conditions: accelerating voltage 15 kV, beam current 6nA, beam diameter 10 μm, counting time on peak 10 s. A ZAF correction procedure was applied. Alkali migration was corrected using glass standards with known H2O contents determined by KFT analyses. Major elements
calibration used wollastonite (Ca), haematite (Fe), albite (Na, Si), corundum (Al), olivine (Mg) and orthoclase (K) standards. Multiple measurements were made for each sample to check for homogeneity.
Densities of selected samples were measured by the Archimedean method, using a Mettler balance equipped with a density accessory kit: samples were weighed successively in air and ethanol. The measurements were performed on samples weighting from 5 up to 20 mg.
The water content of experimental glasses was measured by Karl-Fischer titration at ISTO using a procedure similar to that detailed by Behrens (1995). One to three chips of glasses, wrapped within a Pt foil, as hydrous glasses tend to explode upon heating, were loaded in a Pt crucible and heated with an induction furnace up to 1,300°C to extract all dissolved water. All water released was conducted by an Ar flux to a CuO furnace to convert any H-bearing species present into H2O molecules. Then, H2O molecules were analysed in the titration cell
by a coulometric method (Behrens 1995). Reproducible analyses were obtained for samples yielding about 200–500 μg of H2O, which required between 4 and 20 mg of glass, depending
on its H2O content. Following previous works, we assumed that the residual water within the
samples after KFT analyses is about 0.10 ± 0.05 wt% (Behrens et al. 1996). For each experimental run product, up to three measurements were done whenever enough material was available.
Water dissolved in quenched glasses was also determined by transmission IR spectroscopy on doubly polished glass chips, with thicknesses varying between 70 and 300 μm. Thicknesses were measured with an optical microscope to within 3 μm.
To determine the water content in the samples, we used a microchamber attachment to the FTIR spectrometer Nicolet™ Magna spectrometer 760, together with a white source, a CaF2
beamsplitter and a MCT-A detector (mercury, cadmium, tellurium). Analytical conditions for each analysis were 128 scans and 2 cm−1 resolution. The diameter of the analysed spot was 100 μm. The background was acquired in air for each measurement. For each sample, 3 spots were made, allowing us to check for the homogeneity of the water concentration.
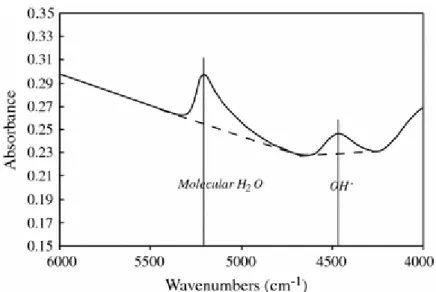
Figure 1 shows a typical spectrum which displays several peaks: one at a wavenumber of 5,200 cm−1 and another one at 4,500 cm−1. The 5,200 cm−1 band is attributed to the
combination stretching + bending mode of molecular H2O, and the 4,500 cm−1 band to the
combination of stretching + bending mode of OH groups (Stolper 1982; Tamic et al. 2001). Total concentrations of water were calculated by measuring concentrations of water dissolved as molecular water and as hydroxyl groups. A broad intense band at about 5,700 cm−1 is observed in some spectra and is attributed to crystal field transitions of divalent Fe ion (Rossman 1988; Ohlhorst et al. 2001).
Three different methods of modelling the baseline are discussed by Ohlhorst et al. (2001). We have chosen the type TT in which simple straight lines are fitted to the base of the 4,500 and 5,200 cm−1 bands (Fig. 1). This method was adopted in the present study because it is the simplest and leads to a higher reproducibility of the determined total water content. Using this method induces systematic errors in the determination of the peak intensities: the intensity is overestimated for the band at 5,200 cm−1 (this overestimation has been estimated to be less than 8%, which is within the uncertainty of the peak height determination), whilst the
intensity for the band at 4,500 cm−1 is underestimated (between 13 and 34% depending on the total water dissolved in the melt). However, the extinction coefficients have been specifically determined in this study for each melt composition using the TT method. Therefore, for further model including H2O speciation defined in this study, we should keep in mind that the
extinction coefficients we used are strictly defined for these melt compositions and the method used to determined dissolved water amounts.
Results
Run products
Charges from experiments performed with no more than 4 capsules in the sample holder quenched to brown crystal-free glasses. In contrast, experiments in which 5–6 capsules were ran together showed some quench crystallization (run1, run2, run5). The quench crystals were 1–2 microns in size but did not prevent FTIR and EMPA analyses from being carried out.
Major element compositions
The major element compositions of the quenched glasses are reported in Table 2. Analytical errors for all the major elements are less than 0.3%, except for SiO2 (around 0.5%) and for
FeO (<0.8%). Platinum from the capsule and to a lesser extent AuPd, both react with iron from the melt to form an alloy (Pt–Fe or AuPd-Fe), resulting in Fe-loss from the melt. Since all charges are crystal free (with the exception of the quench crystals noted above), we assume that any difference in FeO contents between quenched glasses (Table 2) and starting
compositions (Table 1) is due to iron alloying with the container. It appears that for all but one charge (4#2), the iron loss of experiments carried out in Pt capsules is less than 20%, whilst for experiments carried out in Au–Pd capsules, it is less than 10%.
Density
Density measurements are reported in Table 3. The large analytical errors (between 0.7 and 5%) are due to the shortage of large experimental glass fragments. In fact, we found that a reliable density measurement requires a minimum of 10–15 mg of glass. As anticipated, our data show that there exists a linear regression between density and the water content of hydrous glasses. When density measurements were not possible because glass was not available in sufficient quantities, or when the standard deviation of the density measurements was too high, the density of the glass was calculated from the density of anhydrous glasses measured at room temperature, together wit a partial molar volume of 12 cm3/mol (Richet et al. 2000) to account for the presence of dissolved H2O.
Table 3 Experimental results P tot (bar ) Run Na2O + K2 O Densit y (g/l) H2O a wt%H2 O molb wt % OHb wt% H2Otot b f H2O(c ) 100* X B d 100* X H2O,mol(d ) 100* X OHd Tfe lnK1f lnK1 g wt%H2 O molh wt % OHh
(a) Experimental results obtained on basalt from VES-9
2059 Run1#1 8.17 2610* 5.30 4.08 1.38 5.46 211 4 10.2 7.8 4.7 78 2 −2.9 2 1.97 0.38 5.30 0.36 0.15 0.23 0.12 524 Run3#1 7.74 2735 2.18 1.08 1.16 2.24 472 4.3 2.1 4.4 84 5 −2.1 1 1.97 0.06 2.27 0.18 71.00 0.02 0.09 0.05 2138 Run5#1 7.84 2610* 5.31 4.10 1.54 5.64 212 2 10.2 7.9 4.7 78 5 −2.8 5 1.97 0.39 5.38 0.22 0.15 0.13 0.07 1006 Run7#1 7.73 2644* 3.46 2.11 1.36 3.47 102 8 6.8 4.1 5.3 81 4 −2.4 7 1.97 0.15 3.42 0.16 0.15 0.10 0.09 517 Run8#1 8.18 2669* 2.08 1.07 1.19 2.26 436 4.1 2.1 4.0 84 5 −1.9 6 1.97 0.07 2.35 0.21 0.03 0.16 0.07 264 Run26#1 7.74 2679* 1.56 0.61 0.83 1.44 267 3.1 1.2 3.8 86 3 −1.9 2 1.97 0.03 1.62 0.37 0.18 0.22 0.03 172 Run30#1 7.26 2735 1.18 0.40 0.55 0.95 168 2.4 0.8 3.1 88 2 −2.6 9 1.97 0.01 0.96 0.13 39.00 0.15 0.02 0.01 163 Run37# 1 8.22 2726 1.08 0.48 0.57 1.05 144 2.2 1.0 2.4 88 4 −2.8 2 1.97 0.01 1.05 0.22 41.00 0.15 0.02 0.03 232 Run42# 1 7.88 2684* 1.32 0.56 0.76 1.32 202 2.6 1.1 3.0 87 3 −2.2 2 1.97 0.02 1.40 0.23 0.15 0.10 0.04 2760 Run48# 1 8.32 2666* 6.58 5.17 0.95 6.11 304 5 12.5 9.9 5.3 76 1 −3.0 5 1.97 0.56 6.32 0.16 78.19 0.10 0.77 0.35 3842 Run51# 1 8.03 7663** ND 7.60 0.63 8.23 443 6 15.4 14.2 2.3 82 2 −5.3 9 1.97 0.81 7.41 0.13 6.88 0.31 0.08
(b) Experimental results obtained on basalt from ETN-1
1013 Run2#11 5.80 2712 3.28 2.26 1.41 3.67 914 6.5 4.4 4.1 81 9 −2.6 1 1.85 0.17 3.49 0.19 121.68 0.15 0.12 0.09 524 Run3#2 5.61 2664* 2.38 1.26 1.13 2.39 508 4.7 2.5 4.5 83 8 −2.4 7 1.85 0.07 2.31 0.18 0.06 0.12 0.03 269 Run4#2 5.72 2677* 1.68 0.70 1.01 1.71 268 3.4 1.4 3.9 86 7 −2.1 3 1.85 0.04 1.67 0.20 0.15 0.03 0.10 2138 Run5#4 5.44 2558 5.07 3.45 1.34 4.79 202 4 9.8 6.7 6.2 79 1 −3.1 1 1.85 0.30 4.49 0.16 138.36 0.18 0.22 0.09 1006 Run7#2 5.70 2641* 3.59 1.81 1.18 2.99 107 9 7.0 3.6 7.0 81 0 −2.7 4 1.85 0.12 2.88 0.18 0.12 0.10 0.06 172 Run30# 4 5.49 2683* 1.36 0.81 0.54 1.34 183 2.7 1.6 2.2 87 1 −3.5 2 1.85 0.02 1.32 0.24 27.77 0.07 0.15 0.01
P tot (bar ) Run Na2O + K2 O Densit y (g/l) H2O a wt%HO molb2 wt % OHb wt% H2Otot b f H2O(c ) 100* X B d 100* X H2O,mol(d ) 100* X OHd Tfe lnK1f lnK1 g wt%HO molh2 wt % OHh 163 Run37# 2 5.39 2688* 1.08 0.72 0.51 1.22 120 2.2 1.4 1.5 88 3 −3.5 3 1.85 0.02 1.20 0.21 0.07 0.07 0.01 2760 Run48# 2 5.67 2622 6.18 5.73 0.69 6.41 291 1 11.8 10.9 1.8 77 3 −4.9 4 1.85 0.54 5.87 0.21 63.05 0.15 0.12 0.06 3848 Run51# 2 5.47 2646** ND 8.27 0.69 8.96 573 3 16.7 15.4 2.6 ND ND 1.85 1.06 7.89 0.25 85.12 0.11 0.07
(c) Experimental results obtained on basalt from PST-9
2059 Run1#5 4.39 2617* 4.92 3.16 1.59 4.75 204 2 9.5 6.1 6.8 80 0 −2.3 0 2.62 0.17 4.93 0.39 0.15 0.36 0.05 1013 Run2#1 2 4.39 2746 3.14 1.68 1.51 3.19 936 6.2 3.3 5.8 82 8 −2.0 7 2.62 0.07 3.20 0.09 63.65 0.25 0.08 0.07 524 Run3#3 4.47 2647 2.21 1.25 1.59 2.83 509 4.4 2.5 3.9 84 6 −1.7 7 2.62 0.05 2.79 0.14 218.84 0.37 0.00 0.06 2138 Run5#3 4.54 2631 5.19 3.72 1.83 5.55 223 5 10.0 7.2 5.7 79 5 −2.2 1 2.62 0.23 5.68 0.24 130.63 0.26 0.36 0.08 163 Run37# 3 4.22 2690* 0.98 0.27 0.68 0.95 124 2.0 0.5 2.9 89 2 −1.8 2 2.62 0.01 0.98 0.20 0.15 0.04 0.04 232 Run42#3 4.30 2709* 1.53 0.60 0.87 1.48 269 3.1 1.2 3.7 86 5 −2.1 8 2.62 0.01 1.50 0.18 0.03 0.04 0.03 2760 Run48#3 4.33 2652 5.99 3.84 1.54 5.37 286 9 11.5 7.4 8.2 78 7 −2.7 5 2.62 0.20 5.33 0.14 89.35 0.10 0.16 0.13 3842 Run51# 3 4.58 2573** ND 7.74 0.73 8.47 524 0 15.8 14.5 2.7 ND ND 2.62 0.50 7.98 0.24 2.00 0.11 0.03
Numbers in italic: standard deviations
ND No determined
* Density calculated by using linear regression (see text)
** Density calculated by using iterations of linear regression when any KFT data are not available
a
KFT measurements; all data have been increased by 0.1 wt% H2O to account for the water
left over after KFT analysis (see text)
b
FTIR measurement
c
Fugacities of pure water were calculated using a modified Redlich–Kwong equation of state (Holloway 1977), assuming that P H2O = P TOT
d
Mole fraction of volatile component calculated using: X B
(bulkwater) = {(wt%H2Ototsum/18)/[(100 − wt%H2Ototsum)/36.594 + wt%H2Ototsum/18 + wt%C
O2/44]}, where wt%H2Ototsum = wt%OH + wt%H2Omol; XOHm = 2(X B − X mH2O,mol); X
H2O,molm = {(wt%H2Omol/18)/[(100 − wt%H2Otot)/36.594 + wt%H2Otot/18]}, and where
wt%H2Omol and wt%OH are the speciation measured in quenched glasses at room temperature e
Temperature of glass/melt transition in Kelvin. See text for explanation
f
lnK1 calculated from the reaction H2O + O2− ↔ 2OH− from the data measured in quenched
g
lnK1 calculated from the regressions (19), (20) and (21) obtained for VES-9, ETN-1 and PST-9 (see text for explanation)
h
wt%H2Omol and wt%OH calculated for T = 1,200°C, from the lnK1 calculated from
regressions (19), (20) and (21) and using the relationship derived by Silver and Stolper (1985) (see text for explanation)
KFT results
Results of water solubility obtained by KFT analyses are reported in Table 3. Typically, for a measurement time of 12 min and a sample mass of 10 mg, the maximum uncertainty (one sigma) is of ±0.15% relative (Behrens et al. 1996). Thus, the analytical error reported for samples for which only one analysis is available is taken to be 0.15% relative. For samples with multiple analyses, standard deviations of water concentrations (Table 3) are often below 0.15 wt% H2O. This error originates from the uncertainty in unextracted water. Maximum
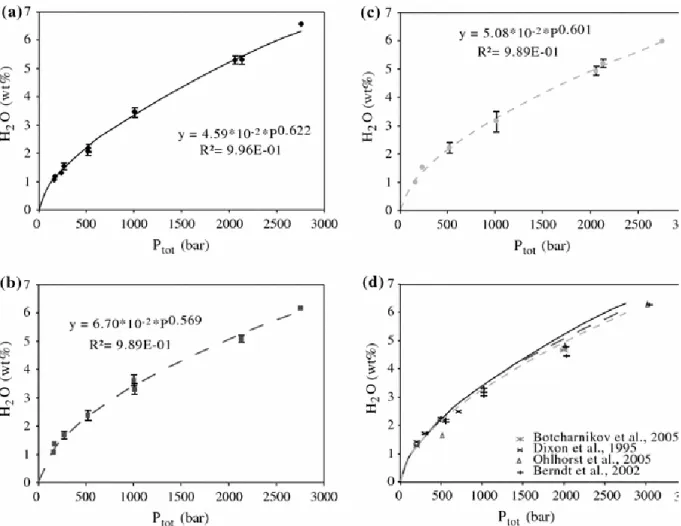
standard deviations were obtained for run2#12, run3#3 and run5#3 (up to 0.37%). However, these experiments were performed with 5 or 6 capsules placed together in the IHPV, and some of the glasses (run2#12 and run5#3) have some quench crystals. Results of water solubilities are shown in Fig. 2 for the three compositions investigated. Good correlations are obtained between water solubilities and pressure (Fig. 3a–c). In detail, the tephrite from Vesuvius displays a higher H2O solubility than that of the two others investigated
compositions (Fig. 3d), which display broadly similar behaviour.
Figure 3 shows the total dissolved water contents of the quenched glasses (from the KFT results), against the water fugacity. The latter was calculated at the corresponding P and T with the modified Redlich–Kwong equation of state defined by Holloway (1977) as tabulated by Dixon et al. (1995). Power law regressions of the data yield the following equations:
FTIR results
Although the FTIR technique allows one to obtain the speciation of water dissolved in
quenched glasses, it is important to stress that the speciation is measured at room temperature, as discussed in detail below. The molar absorptivity for each band was determined assuming that the molar extinction coefficient for each band and for a given melt composition is
constant, independent on the quench rate and the water content (McMilland 1994; Dixon et al.
1995; Di Matteo et al. 2006) and that the total water dissolved in the melt is due to the sum of
molecular water and hydroxyl groups:
The concentration of species in the quenched glass is calculated using the modified Beer– Lambert law (e.g. Stolper 1982):
where C i is the concentration of water dissolved in the melt as species i, (either molecular or hydroxyl groups), is the molar mass of water (g*mol−1), Abs i is the absorbance of species i, ρ is the density (g*l−1), d is the thickness of the glass sample (cm) and ε i is the molar extinction coefficient (l mol−1 cm−1) for the specific absorption band.
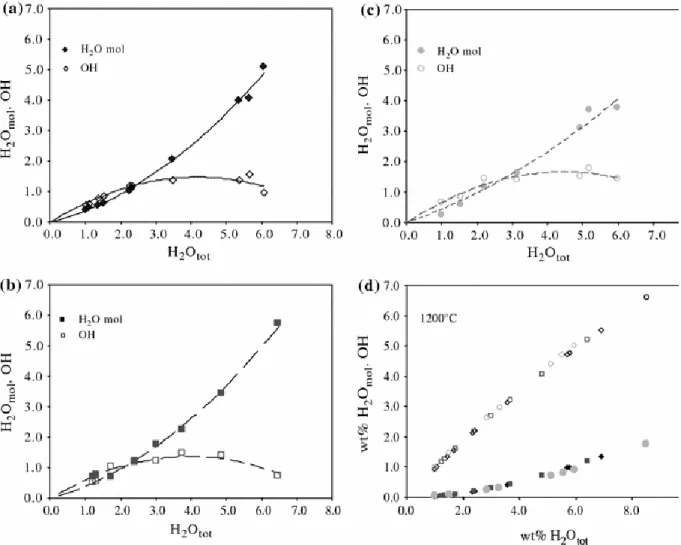
Molar extinction coefficients for the three basaltic melts have been determined using the method described by Novak and Behrens (1995) and Schmidt et al. (2001). Regressions are reported in Fig. 4, and the values are reported in Table 4. Figure 5 shows the speciation patterns of water for the three glass compositions, which are generally as observed in previous works (e.g. Stolper 1982; Dixon 1997; Behrens et al. 2009). The lack of clear compositional dependence suggests that the observed differences in speciation patterns primarily reflect variations in quench rates, as discussed further below.
Table 4 Molar extinction coefficients (l.mol−1 cm−1) calculated for VES-9, ETN-1 and PST-9 compositions, and from previous works
Composition Equation R 2 Molecular water ε5200 Hydroxyl groups ε4500 Position (cm−1) Position (cm−1) VES-9 y = − 0.82x + 0,57 0.86 5211 0.57 ± 0.04 4465 0.70 ± 0.06 ETN-1 y = − 0.72x + 0.56 0.77 5220 0.56 ± 0.08 4483 0.75 ± 0.07 PST-9 y = − 0.93x + 0.62 0.62 5216 0.62 ± 0.10 4483 0.97 ± 0.07 MORB (Dixon et al. 1995) 5200 0.62 ± 0.07 4500 0.67 ± 0.03 Basalt (Ohlhorst et al. 2001) 5195 0.56 4471 0.56
As regards the determination of total water concentrations, for most experiment KFT and FTIR data compare well to each other (Fig. 6), although small misfits are found in a few experiments on Etna and Stromboli, typically those in which more than 4 charges were ran together (runs 2,3 and 5) and where quench crystals are present (run2#12, run5#3).
Discussion
Figure 2d shows that at low pressures (<1 kbar) the melt composition, from MORB to alkali basalt to tephrite, has no detectable effect on water solubility. In contrast, at 2 kbar and above, the alkali-richest composition (tephrite, VES-9) dissolves more H2O than the two others,
comparatively less alkali-rich, basalts PST-9 and ETN-1, the difference increasing with pressure. For instance, at 2,760 bar, VES-9 dissolves 6.6 wt%H2O, whereas ETN-1 dissolves
6.2 wt% and PST-9 6.0 wt%H2O. Similarly, the H2O solubility of a MORB at the same
pressure can be calculated to be 5.99 wt% H2O (Dixon et al. 1995). At 2 kb and 1,200°C,
Behrens et al. (2009) report H2O solubilities of 5.19–5.32 wt% for a phonotephrite, depending
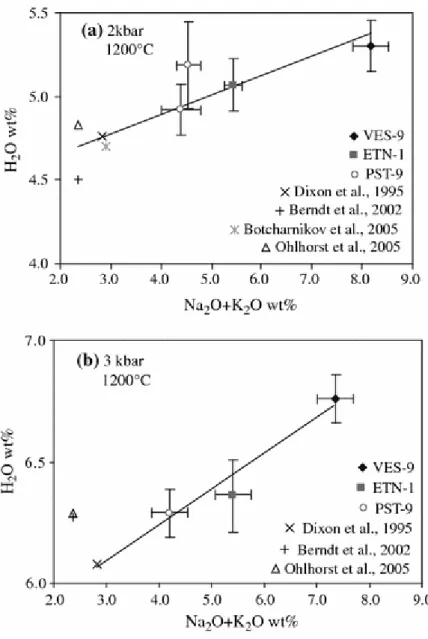
Differences in composition between VES-9, ETN-1 and PST-9 concern several major element oxides and in particular the alkali (Table 1). Figure 7 shows that the total water dissolved in the melts at 2 and 3 kbar is positively correlated with the total alkali contents (Na2O + K2O).
This stresses the importance of the total alkali content on the water solubility, an indication that the water dissolution mechanism is probably directly influenced by the alkali cations present in the melt.
Empirical model of water solubility in basaltic melts
An empirical model of water solubility of alkali basalts in our experimental pressure range (from 163 to 3,842 bar), for a temperature of 1,200°C has been constructed, in which the effects of alkalinity and oxygen fugacity (Berndt et al. 2002) are taken into account. The following simple expression was found to yield satisfactory results:
where H2O (wt%) is the solubility of water in the melt, H2OMORB (wt%) is the solubility of
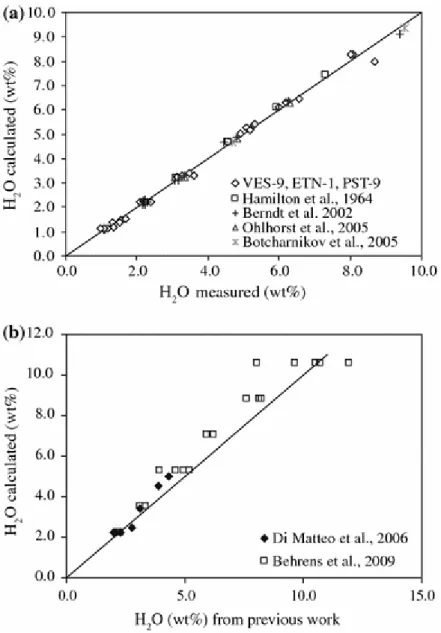
water in the MORB determined by using the Dixon’s model (Dixon et al. (1995), P is the pressure (bar), ΔNNO is the oxygen fugacity and α, β, γ and δ are empirical parameters which were determined by fitting our data and those of Hamilton et al. (1964), Ohlhorst et al. (2001), Berndt et al. (2002) and Botcharnikov et al. (2005). Only one datum from Ohlhorst et al. (2001), for which the relative variation between the experimental and the calculated values was around 30%, and the data of Hamilton et al. (1964) at pressures above 4 kbar were not included. In fact, as noted by Berndt et al. (2002), the method employed by Hamilton et al. (1964) underestimates water contents in hydrous glasses synthesized at pressures above 4 kbar. The difference between experimental and calculated values is less than 5% for more than 80% of the data set (Fig. 8a). The fitted parameters are α = 5.84*10−5, β = −2.04*10−2, γ = 4.67*10−2 and δ = −2.29*10−1.
As a test of our model, we applied it to the experimental results of Di Matteo et al. (2006) on shoshonite and latitic melts and to the study of Behrens et al. (2009), who worked out the H2O
solubilities of an ultrapotassic melt at pressures up to 5 kbar. Figure 8b shows that both sets of data are well reproduced by our empirical model. The data of Di Matteo et al. (2006) are reproduced with less than 15% of error. Behrens et al. (2009) did not apply the correction of 0.10 ± 0.05 wt% to their results, as the dehydration is more efficient in silica-poor viscous melts. To be consistent with our data and the way the empirical model has been built, the value of 0.10 ± 0.05 wt% has been added to solubility data. The data of Behrens et al. (2009) are particularly interesting as experiments were made at pressures higher than those explored in our work, yet our empirical model reproduces the H2O solubilities measured by Behrens et
al. (2009) with a mean error of 9%. The difference observed with the data of Behrens et al. (2009) at high H2O contents reflects primarily the fact that some of their highest pressure
experiments produced non-quenchable melts, owing to their exceedingly low viscosity. Our results suggests that only the highest melt water contents reported by Behrens et al. (2009) faithfully describe the H2O solubility of ultrapotassic melts at 5 kbar.
Water speciation in basaltic glasses and melts
In this section, we focus on the water speciation in the quenched glasses. Silver and Stolper (1989) have shown that the distribution between the species concentrations (hydroxyl groups and molecular water) in hydrous albite glass can be faithfully described by a regular solution model which Dixon et al. (1995) also used for MORB. Within the regular solution
approximation for mixing between water molecules, hydroxyl groups and anhydrous species, the equation describing the relationships between the species abundances is (Silver and Stolper 1989):
For each composition, we fitted our species proportions to A′, B′ and C′ parameters by least squares regression (Table 5). The comparison of these parameters obtained for alkali basalts against those of MORB (Dixon et al. 1995) is shown in Fig. 9. A′, B′ and C′ parameters follow a regular evolution with alkalinity of the melt (Fig. 9), the parameter B′ being the most variable. The evolution of parameters A′, B′ and C′ with alkalinity can be in turn described by the following simple linear equations:
Table 5 Fitted parameters A′, B′ and C′ for composition of VES-9, ETN-1 and PST-9
A′ B′ C′
VES-9 3.139 −29.555 20.535 ETN-1 4.128 −45.905 21.311 PST-9 2.600 −22.476 22.295
This parameterization enables one to calculate the species distribution of water in basaltic glasses having alkali contents different than those of MORB, (but with SiO2 contents close to
50 wt%). However, it is worth pointing out that the regressions above apply to melts quenched at similar rates, close to 500°C/s. This stresses the need to take into account the temperature dependence of the water speciation, as detailed below.
Water speciation in basaltic liquids/melts
Early measurements of water species in basaltic glasses produced over a range of quench rates (8 − 500 K/s) lead Dixon et al. (1995) to conclude that basaltic melts basically preserve their high temperature water speciation when quenched to the glassy state. This is in sharp contrast to what has been observed in more silicic compositions, in particular rhyolites. The latter have
been shown clearly to have their speciation significantly affected during cooling as demonstrated from either room temperature (e.g. Silver and Stolper 1989) or direct in situ spectroscopic measurements (e.g. Nowak and Behrens 1995; Shen and Keppler 1995). This kinetic phenomenon is now well established and used in particular as a geospeedometer (e.g. Zhang et al. 2000). Below, we show that the interpretation of our results within the framework of the glass transition theory (e.g. Dingwell and Webb 1990; Behrens and Nowak 2003; Gottsmann et al. 2002; Giordano et al. 2005; Potuzak et al. 2008; Nichols et al. 2009) allows to evaluate to what extent our hydrous mafic melt compositions preserve their high
temperature speciation upon quench. The approach uses recent advances in the field of silicate melt viscosities (Giordano et al. 2008).
To define the glass transition temperature, Tg, we follow the approach of Botcharnikov et al. (2006). It is based on the calculation of the melt viscosity η* (Pa s) at Tg using the
relationship derived by Scherer (1984):
where q is the quench rate (K/s).
The constant, termed the shift factor, depends on the convention used to define the glass transition (e.g. Nichols et al. 2009). For instance, Stevenson et al. (1995), Zhang et al. (1997) and Toplis et al. (2001) used different values, which yield one log unit of difference in the viscosity calculation. Gottsman et al. (2002) have shown that the shift factor can be related to the molar amounts of excess oxides (i.e. network modifiers). Although composition-specific shift factors can be calculated, the value proposed by Botcharnikov et al. (2006) is used below in order to facilitate comparison.
Tg is determined from the model of Giordano et al. (2008):
In this equation, A is the viscosity of silicate melts at infinite temperature and is considered to be independent of composition, whilst B and C coefficients are linear combinations of oxide components (mol%) and several multiplicative oxide cross-terms. Thus, fixing the viscosity to the value reached at the melt/glass transition temperature using Eq. 11 allows one to calculate the temperature of the glass transition for each charge. This temperature, also designated the fictive temperature (T f ), is given in Table 3. It is important to notice that an uncertainty on the calculated log η leads to a large uncertainty (about 20%) on the calculated glass transition temperature, and therefore these values must be considered very carefully.
To test the applicability of this general viscosity model, the model of Hui and Zhang (2007) has also been tested to determine Tg. After comparison between calculated temperatures with both models, it appears that the differences have been found to be less than 15%. Considering the uncertainty on the calculated temperature, we can consider that both models give similar results. Therefore, we used the Giordano et al. (2008) model.
As stressed out previously, based on previous works performed on more silicic compositions, it can be anticipated that the water speciation we have determined at room temperature is the
water speciation that was frozen-in once the charge reached the glass transition temperature, which can be determined by the method described above. Thus, we can calculate the
equilibrium constant of the reaction that governs water speciation in the silicate melt (e.g. Silver and Stolper 1985) over a range of temperature (e.g. Botcharnikov et al. 2006).
Classically, it is considered that dissolved molecular H2O reacts with oxygens of the silicate
network producing two OH− groups (e.g. Stolper 1982; Silver and Stolper 1985; Kohn 2000), the overall reaction reading as:
where [OH−], H2O and O2 are the mole fractions of these species defined on a single O basis
(e.g. Stolper 1982 and Silver and Stopler 1989). In the ideal approximation, K 1 can be
calculated directly using the mole fractions obtained from the H2Omol and OH− weight per
cent determined by FTIR, and using the molecular weight of the anhydrous basaltic melt (36.594 g/mol) on a one oxygen basis. Results are shown in Table 3.
Figure 10 shows the variation of ln K 1 against the reciprocal temperature. Only data obtained
on experimental melts obtained at pressures above 250 bar are taken into account, as at lower pressure data are associated with higher uncertainties due to quench difficulties. Negative linear correlations are observed for the three compositions, each with a good correlation coefficient (R 2 > 0.9). The following linear regressions have been obtained:
These regressions are obtained from FTIR data, using the TT method (Ohlhorst et al. 2001), and would be different if using the GG method (Lui et al. 2004). Also this method can be applied only to basaltic melts displaying a similar shape of the Fe-related bands as the glasses used in this study. Both the slopes retrieved (from −8,700 for a Strombolian basalt to −8,033 for a Vesuvian basalt) and the range of calculated fictive temperatures (between 760 and 892 K) are similar for the three basaltic compositions. In other words, although each
composition defines its own trend, no clear compositional dependence emerges from our data set. There is also no effect of total pressure on K 1 discernible from our database, which
suggests that the volume change associated with reaction (13) is small for hydrous basaltic melts in the pressure range investigated (e.g. Silver and Stolper 1985).
Equations 15–17 allow us to recalculate the water speciation at the experimental temperature using the following relationships derived by Silver and Stolper (1985):
And,
where X B is the mole fraction of total water, calculated on the basis of one oxygen for the anhydrous component. For all three compositions, the calculated water species at 1,200°C (reported in Table 3) show that the hydroxyl group constitutes more than 90% of the total water (Fig. 5d). Thus, during cooling of hydrous basaltic melts, reaction (13) is strongly shifted rightward. Comparison between naturally quenched melts (e.g. Dixon et al. 1995; Dixon 1997) and those made in the laboratory shows that both preserve broadly similar speciation patterns (e.g. Nichols et al. 2009), suggesting similar quenching rates. This suggests that any structural response (relaxation) of hydrous basalt melts upon cooling is an exceedingly fast process, with the implication that high temperature H-bearing species proportions are virtually not quenchable using conventional laboratory techniques.
On Fig. 10b, we compare our data with those obtained in previous works on different melt compositions, andesitic (Botcharnikov et al. 2006) to basaltic (Dixon et al. 1995; Behrens et al. 2009). The fictive temperature for the glasses of Dixon et al. (1995) and Behrens et al. (2009) was calculated following the procedure given above, using the viscosity model of Giordano et al. (2008). It appears that the andesitic composition has higher values of T f , between 729 and 829 K, when compared to those retrieved for basaltic compositions, which is in line with the generally higher melt viscosity of the more silicic melt compositions
(Giordano et al. 2008). Glass/melt transition temperatures calculated for our experimental charges are similar to those calculated from Behrens et al. (2009), but are systematically lower than those calculated from Dixon et al. (1995) data, which reflects the fact that Dixon et al. (1995) essentially explored low melt water contents (i.e. low total pressures), relevant to mid-ocean ridge magmatism.
The trends displayed by the Dixon et al. (1995), Botcharnikov et al. (2006) and Behrens et al. (2009) experiments in Fig. 10b have all broadly similar slopes, although the dispersion is relatively important for the basaltic subset part of the data (R 2 = 0.53 for Behrens et al. (2009) and R 2 = 0.35 for Dixon et al. (1995)). In comparison, the trends defined by our experiments have higher slopes. However, given the considerable scatter of the data, it is still unclear whether the differences in slopes are due to a true difference in the temperature dependence of the water speciation reaction between the various melt compositions worked with or simply reflect the uncertainties associated with the respective experimental methods and results.
In general, the data from previous works display ln K 1 values higher than in this study,
although the data for PST-9 extend the data of Dixon et al. (1995) and compare reasonably well with those of Behrens et al. (2009). The overall lower ln K 1 values obtained in this study
implies that molecular water is more abundant, and OH groups less abundant, in our glasses. As shown previously (e.g. Zhang et al. 1997; Behrens and Nowak 2003), the higher the
quench rate, the higher the concentration of OH groups at constant total water content. On this basis, we suggest that the observed differences in ln K 1 values reflect in large part variations
in quench rates imposed by the various experimental equipments used. Altogether, the comparison of our results with data from previous works on basaltic compositions, as well as with data pertaining to other more silicic compositions (see Botcharnikov et al. 2006), argues for a relatively weak compositional dependence of water speciation in silicate melts of geological interest, a point already made by Stolper (1982) and Silver and Stolper (1985). For convenience, the temperature dependence of the water speciation evidenced above can be incorporated into the regular solution formulation as well (see Silver and Stolper 1989). To do so, let us first recall the meaning of the A′, B′ and C′ terms used in Eq. 7. Following Silver and Stolper (1989), those three terms are defined as:
where the W i-j are binary interaction parameters between species i and species j, usually
considered as being independent of both T and P, K 1 being the equilibrium constant of
reaction (13). It has to be noted that in the regular solution model, the values of K 1 cannot be
determined directly from measured species (i.e. the K 1 values here differ from the previously
derived Eqs. 15–17). In the first applications of the regular solution model (e.g. Silver and Stolper 1989), the K 1 constant was considered to be either not or only marginally affected by
temperature changes. In the classical derivation (e.g. Dixon et al. 1995), the three terms (A′, B′ and C′) were thus given constant values, which reflect primarily that speciation and solubility data of H2O in silicate melts are usually obtained isothermally. Our measurements,
as well as those made by several groups over the last years, allow us to relax such an assumption. The easiest way of incorporating a temperature effect upon speciation is to assume that K 1 follows a temperature dependence of the type (e.g. Silver and Stolper 1989):
We have regressed our speciation data of the three compositions, using the explicit formulation given above for lnK 1, A′, B′ and C′ parameters. Linear regressions yield the
During the regression procedure, we first treated each composition separately. Yet, it was subsequently found that regression over the entire data set yielded also good residuals. Therefore, within the uncertainty of the speciation data, a temperature-dependent regular solution model cannot distinguish any compositional effect, unlike the case when no
temperature effect is incorporated. This model allows one to calculate the water speciation of hydrous basaltic melts of variable alkalinity, provided that the temperature of quench is independently known. Alternatively, if equilibrium between species is assumed to have been preserved, the above set of equations can be solved for T in order to find the glass transition temperature.
Thermodynamics of water solubility in basaltic melts
Partial molar volume of molecular H2O
Various recent works have shown how the solubility laws of volatile components in silicate melts can be used to calculate the composition of the fluid phase exsolved during ascension of magmas (e.g. Scaillet and Pichavant 2003, 2005; Moretti et al. 2003; Burgisser and Scaillet
2007; Burgisser et al. 2008). The empirical Eqs. 1–3., though accurate, are valid only for the
compositions onto which they have been calibrated. In addition, their application outside the calibrated range is somewhat hazardous. For the sake of generality in the context of magma degassing, it is thus of interest to derive a more general, as well as rigorous, formalism relating water fugacity to its concentration. To this end, in what follows we apply the thermodynamical model developed by Stolper and co-workers in order to derive the activity (fugacity)-composition relationships of water (the dissolved water species considered here being molecular H2O) in our basaltic melts as a function of pressure and temperature. The
where P 0 and T 0 are a reference pressure and temperature; R is the gas constant (83.15
cm3bar/mol,K); is the activity of water in vapour-saturated basaltic melt at P 0
and T 0; and are the fugacities of pure water vapour at T, P and P 0, T 0,
respectively, here calculated using a modified Redlich–Kwong equation of state for H2O
(Holloway 1977; Dixon et al. 1995); (cm3/mol) is the partial molar volume of water in the melt in its standard state and is generally assumed to be independent of pressure
and temperature, , where (kJ/mol) is the molar enthalpy of
water vapour at T at a pressure low enough for the vapour phase to be ideal and is the enthalpy per mole of water in the melt in its standard state at T 0 and P 0. is assumed
to be independent of temperature but is a function of pressure (Stolper and Holloway 1988; Stolper et al. 1987).
Although, as stressed above, water speciation is well described using a regular solution model, several works have shown (e.g. Stolper 1982; Silver and Stolper 1989; Blank et al.
1993; Dixon et al. 1995) that the activity of molecular water in silicate melts obeys Henry’s
law, in particular in the dilute range:
The fact that water solubility follows a Henrian behaviour has the main advantage of keeping a simple functional relationship between fugacity and concentration. So Eq. 28 can be
rewritten:
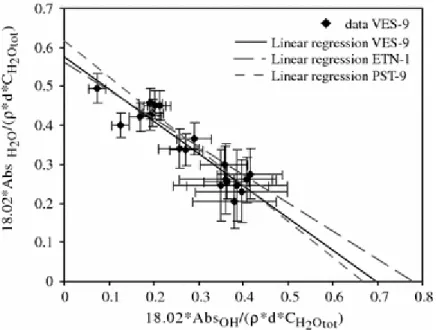
The validity of such an assumption can be readily tested by plotting XH2O m against
(Fig. 11). Regardless of which XH2O m is used, i.e. that measured in the glass or that
recalculated at 1,200°C, in both cases and over the entire range of water content, strong near linear correlations are observed, all three compositions falling on the same trend.
We have fitted our data to Eq. 30, using the speciation as preserved in the glassy state (thus ignoring temperature effects) and first assuming that the volume term is independent of pressure. With these assumptions, Eq. 31 breaks into the following simple expression:
We have applied a unique regression to the entire data set since no systematic compositional effect was found. Best fit values for XH2O m ° and VH2O m ° are 5.71 × 10⁻⁵ and 26.9 cm3/mol,
respectively. The molar volume obtained is within the range of values derived for other
silicate melt compositions, (Lange 1994), although somewhat higher than the value previously obtained for mafic liquids (12 cm3/mol tholeiite, Holloway and Blank, 1994; Dixon et al.
1995). Equation 31 offers a simple way of calculating the corresponding to an amount of molecular water dissolved measured at room temperature in a basaltic glass, regardless of the quenching rate as long as it is less than 500°C/s, the fastest that can be applied in laboratory using conventional techniques. Excluding two charges (Etna 30#4 and 37#2), experimental
values are back calculated with the above equation to within 12% relative.
At this point, the assumption of the constancy of partial molar volume of water in silicate liquids can be also questioned. From measurements of the molar volume of hydrous albite liquids, Ochs and Lange (1997) concluded that H2O is the single most compressible
component in silicate liquids (as well as the most expansive). For instance, the volume of bulk H2O at 1,000°C in albite melt varies linearly from around 23 cm3/mol at 1 bar down to
17 cm3/mol at 10 kbar. Therefore, VH2O m ° in Eq. 30 can be substituted by an expression of
the form:
where the b term represents the partial molar volume at 1 bar, whilst the a term represents a proxy of the compressibility.
This expression has been incorporated to Eq. 16, and calculation of molar volume has been made through the integration of this equation. Numerical values obtained for molar volume has been found to be unrealistic. Therefore, this sophistication is not justified here.
The above approach has been also applied with XH2O m abundances calculated at 1,200°C,
using either a constant or a variable molar volume for molecular water. In both cases, however, values obtained for VH2O° are strongly negative (−15.9 cm3/mol for the constant
approximation and −48 cm3
/mol at 1 bar for the variable one). Negative or nil volumes for molecular water using the same approach as here have been already reported in the literature, notably for rhyolitic compositions (e.g. Silver et al. 1990; Holloway and Blank 1994). It is unknown whether they arise from inappropriate simplifying thermodynamic assumptions, from uncertain estimates of the proportions of molecular water or from other factors (e.g. Silver et al. 1990). In face of those difficulties and considering that in most cases the
temperature of quenching of magmatic liquids is not known (which prevents recalculation of actual water species), we recommend the use of room temperature data together with Eq. 31 whenever the value of water fugacity corresponding to an hydrous basalt glass is to be calculated from its amount of dissolved molecular water.
Partial molar volume of total water
To calculate silicate melt densities, including those of basaltic composition, the master variable is the effect of bulk water content. The above section has considered only molecular water, which at magmatic temperatures may amount to less than 10% of the bulk water, in
which case, the main effect on melt density is to come from hydroxyl groups whose partial molar volume is lacking. However, Ochs and Lange (1999) have shown that, in addition to melt composition, the partial molar volume of bulk water is insensitive to both the amount and speciation of water ; they concluded that the partial molar volume of water in silicate melts of geological interest is ca 23 cm3/mol at 1 bar (and 1,000°C). On this basis, we now use the approach described by Lange (1994), in which the total water, instead of only its molecular form, is taken into account, to test to what extent such a value is compatible with water solubility constraints in basalt melts. The bulk equilibrium between H2O in a vapour
and a coexisting silicate melt reads as:
the equilibrium condition of Eq. 33 under isothermal conditions can be written as:
where is the change in free energy of the reaction as a function of pressure and at a constant temperature T, is the standard state change in free energy at one bar and temperature T, is the activity of total water in the melt, is the fugacity of pure water vapour and is the partial molar volume of the total water component
dissolved in the silicate melt. This equation can be rewritten:
where is the melt activity coefficient for the total H2O component dissolved in the
basaltic melt. If we assume that the activity coefficient is independent of the pressure and that
the molar volume of total water is also pressure independent, then a plot of versus
P − 1/RT should result in a straight line, whose slope is equal to .
Results are shown in Fig. 12. It appears that instead of a line, we obtain logarithmic curves, the three compositions defining again one single trend. One obvious explanation of the departure from a linear relationship at low pressures is that the assumption on the invariance of the volume relative to pressure is incorrect. The same holds true for the assumed invariance of the activity coefficient with pressure. If, however, only the data obtained at pressures above 1 kbar are taken into account, a straight line can be drawn, from which a molar volume for bulk water can be extracted. The obtained for the three compositions are similar to each other, around 35 cm3/mol (33.37 ± 0.73, 36.20 ± 0.74 and 35.98 ± 0.73 cm3/mol for
VES-9, ETN-1 and PST-9, respectively). Consideration of the data of Hamilton et al. (1964, 19.12 ± 0.39 cm3/mol) allows us to expand the calibrated pressure range by a factor of 2 and leads to a decrease in the molar volume of water relative to that obtained from the alkali basalts only, at around 19 cm3/mol. Such a value agrees reasonably well with previous determination of the partial molar volume of bulk water in a variety of silicate liquids (e.g. Lange 1994; Ochs and Lange 1997, 1999). Yet, clearly such a value no longer applies in the low pressure range, which is the one of interests when modelling degassing during magma uprising.
Conclusions
1. Experiments at 1,200°C and pressures from 170 to 3,842 bar have been performed to determine the solubilities of H2O in alkali basaltic melts.
2. Molar extinction coefficients of molecular water and hydroxyl groups have been
determined for the three alkali basaltic melts, assuming that quench rate has no effect on it and that they are independent of the total water dissolved in the melt.
3. For the three compositions, the correlations between pressure and concentration of water dissolved in basaltic melts yield the following empirical solubilities laws:
Below 1 kbar, the trends are indistinguishable from those of previous studies performed on either a MORB (Dixon et al. 1995) or other basaltic compositions (Ohlhorst et al. 2001, Berndt et al. 2002; Behrens et al. 2009).
4. At pressures above 2 kbar, different water solubility trends are obtained for the three basaltic melts. The concentration of alkali has a positive effect on water solubilities above 2 kbar, although the effect remains moderate. An empirical model taking into account the role of the total alkali content of the melt of pressure and oxygen fugacity is proposed to describe the solubility of water in alkali basalt melts.
5. Interpretation of the water speciation data in the light of the glass relaxation theory shows that the distribution of water species (molecular H2O, hydroxyl groups) in basaltic melts is
largely affected during quench. Recalculation of the water speciation shows that, at 1,200°C, hydroxyl groups by far dominate molecular water in basaltic liquids, the latter amounting generally to less of 10% of the bulk water budget.
6. The water speciation data can be correctly described with a regular solution model which incorporates a temperature dependence term. With such an approach, no large
compositional effect on water species appears with the currently available database on basaltic liquids.
previous estimates, if the room temperature data are used. Using species recalculated at the experimental temperature yields strongly negative values for the molecular water.
Derivation of the partial molar volume of total water using our data and other available experimental constraints yields a value of 19 cm3/mol for dissolved H2O, at pressures
above 1 kbar.
Acknowledgments We thank G. Moore and an anonymous reviewer for helpful reviews.
This paper is part of the PhD thesis of the senior author. It has been partly financially supported by INGV funds and by the department of the Italian Civil Defence.
References
Allard P, Behncke B, D’Amico S, Neri M, Gambino S (2006) Mount Etna 1993–2005: anatomy of an evolving eruptive cycle. Earth-Sci Rev 78:85–114
Behrens H (1995) Determination of water solubilities in high-viscosity melts. An experimental study on NaAlSi3O8 and KAlSi3O8 melts. Eur J Mineral 7:905–920
Behrens H, Nowak M (2003) Quantification of H2O speciation in silicate glasses and melts by IR spectroscopy—In situ versus quench techniques. Phase Transitions 76:45–61
Behrens H, Romano C, Nowak M, Holtz F, Dingwell DB (1996) Near-infrared spectroscopic determination of water species in glasses of system MAlSi(3)O(8) (M = Li, Na, K): an interlaboratory study. Chem Geol 128:41–63
Behrens H, Misiti V, Freda C, Vetere F, Botcharnikov RE, Scarlato P (2009) Solubility of H2O and CO2 in ultrapotassic melts at 1200 and 1250 degrees C and pressure from 50 to
500 MPa. Am Mineral 94:105–120
Belkin HE, De Vivo B, Torok K, Webster JD (1998) Pre-eruptive volatile content, melt-inclusion chemistry, and microthermometry of interplinian Vesuvius lavas (pre-AD1631). J Volcanology Geotherm Res 82:79–95
Berndt J, Liebske C, Holtz F, Freise M, Nowak M, Ziegenbein D, Hurkuck W, Koepke J (2002) A combined rapid-quench and H-2-membrane setup for internally heated pressure vessels: description and application for water solubility in basaltic melts. Am Mineral 87:1717–1726
Bertagnini A, Metrich N, Landi P, Rosi M (2003) Stromboli volcano (Aeolian Archipelago, Italy): an open window on the deep-feeding system of a steady state basaltic volcano. J Geophys Res Solid Earth 108(B7):15
Blank JG, Stolper EM, Carroll MR (1993) Solubilities of carbon-dioxide and water in rhyolitic melt at 850-degrees-c and 750 bars. Earth Planet Sci Lett 119:27–36
Botcharnikov R, Freise M, Holtz F, Behrens H (2005) Solubility of C-O-H mixtures in natural melts: new experimental data and application range of recent models. Annals of Geophys
48:633–646
Botcharnikov RE, Behrens H, Holtz F (2006) Solubility and speciation of C-0-H fluids in andesitic melt at T = 1100–1300 degrees C and P = 200 and 500 MPa. Chem Geol 229:125– 143
Bruno N, Caltabiano T, Giammanco S, Romano R (2001) Degassing of SO2 and CO2 at Mount Etna (Sicily) as an indicator of pre-eruptive ascent and shallow emplacement of magma. J Volcanology Geotherm Res 110:137–153
Burgisser A, Scaillet B (2007) Redox evolution of a degassing magma rising to the surface. Nature 445(7124):194–197
Burgisser A, Scaillet B, Harshvardhan (2008) Chemical patterns of erupting silicic magmas and their influence on the amount of degassing during ascent. J Geophys Res Solid Earth 113:B12
Burnham CW (1979) The importance of volatile constituents. In: Yoder HS Jr. (ed) The evolution of the Igneous Rocks. Princeton University Press 439–482
Devine JD, Sigurdsson H, Davis AN, Self S (1984) Estimates of sulphur and chlorine yield to the atmosphere from volcanic eruptions and potential climatic effects. J Geophys Res
89(NB7):6309–6325
Di Carlo I, Pichavant M, Rotolo SG, Scaillet B (2006) Experimental crystallization of a high-K arc basalt: the golden pumice, Stromboli volcano (Italy). J Petrol 47:1317–1343
Di Matteo V, Mangiacapra A, Dingwell DB, Orsi G (2006) Water solubility and speciation in shoshonitic and latitic melt composition from Campi Flegrei Caldera (Italy). Chem Geol 229:113–124
Dingwell DB, Webb SL (1990) Relaxation in silicate melts. Eur J Min 2:427–449 Dixon JE (1997) Degassing of alkalic basalts. Am Miner 82:368–378
Dixon JE, Stolper EM, Holloway JR (1995) An experimental study of water and carbon dioxide solubilities in mid ocean ridge basaltic liquids.1. Calibration and solubility models. J Petrol 3:1607–1631
Giordano D, Nichols ARL, Dingwell DB (2005) Glass transition temperatures of natural hydrous melts: a relationship with shear viscosity and implications for the welding process. J Volcanology Geotherm Res 142:105–118
Giordano D, Potuzak M. Romano, C. Dingwell DB, Nowak M (2008) Viscosity and glass transition temperature of hydrous melts in the system CaAl2Si2O8-CaMgSi2O6. Chem Geol
256:203–215
Gottsmann J, Giordano D, Dingwell DB (2002) Predicting shear viscosity during volcanic processes at the glass transition: a calorimetric calibration. Earth Planet Sci Lett 198(3– 4):417–427
Hamilton DL, Burnham CW, Osborn EF (1964) The solubility of water and effects of oxygen fugacity and water content on crystallization in Mafic Magmas. J Petrol 5:21–39
Holloway JR (1977) Fugacity and activity of molecular species in supercritical fluids. Thermodynamics in Geol 161–181
Holloway JR, Blank JG (1994) Application of experimental results to C-O-H species in natural melts. In: Volatiles in magmas, vol 30. Mineralogical Soc America, Washington, pp 187–230
Hui H, Zhang Y (2007) Toward a general viscosity equation for natural anhydrous and hydrous silicate melts. Geochim Cosmochim Acta 71(15):403–416
Kohn SC (2000) The dissolution mechanisms of water in silicate melts; a synthesis of recent data. Mineraological Magazine 64(3):389–408
Lange RA (1994) The effect of H2O, CO2 and F on the density and viscosity of silicate melts.
In: Volatiles in magmas, vol 30. Mineralogical Soc America, Washington, pp 331–369 Lui Y, Behrens H, Zhang Y (2004) The speciation of dissolved H2O in dacitic melt. Am
Mineral 89:277–284
McMilland PF (1994) Water solubility and speciation models. In: Volatiles in magmas, vol 30. Mineralogical Soc America, Washington, pp 131–156
Metrich N, Bertagnini A, Landi P, Rosi M (2001) Crystallization driven by decompression and water loss at Stromboli volcano (Aeolian Islands, Italy). J Petrol 42:1471–1490
Moretti R, Papale P, Ottonello G (2003) A model for the saturation of C-O-H-S fluids in silicate melts. Volcan Degassing 213:81–101
Nichols ARL, Potuzak M, Dingwell DB (2009) Cooling rates of basaltic hyaloclastites and pillow lava glasses from the HSDP2 drill core. Geochim Cosmochim Acta 73:1052–1066 Nowak M, Behrens H (1995) The speciation of water in haplogranitic glasses and melts determined by in situ near-infrared spectroscopy. Geochim Cosmochim Acta 59(16):3445– 3450
Ochs FA, Lange RA (1997) The partial molar volume, thermal expansivity, and
model. Contrib Mineral Petrol 129:155–165
Ochs FA, Lange RA (1999) The density of hydrous magmatic liquids. Science 283(5406):1314–1317
Ohlhorst S, Behrens H, Holtz F (2001) Compositional dependence of molar absorptivities of near-infrared OH- and H2O bands in rhyolitic to basaltic glasses. Chem Geol 174:5–20 Pichavant M, Di Carlo I, Le Gac Y, Rotolo SG, Scaillet B (2009) Experimental constraints on the deep magma feeding system at Stromboli volcano, Italy. J Petrol 50:601–624
Potuzak M, Nichols ARL, Dingwell DB, Clague DA (2008) Hyperquenched volcanic glass from Loihi Seamount, Hawaii. Earth Planet Sci Lett 270:54–62
Richet P, Whittington A, Holtz F, Behrens H, Ohlhorst S, Wilke M (2000) Water and the density of silicate glasses. Contrib Mineral Petrol 138:337–347
Robock A (2000) Volcanic eruptions and climate. Rev Geophys 38:191–219 Rossman GR (1988) Optical spectroscopy. Rev Mineral 18:207–254
Scaillet B, Pichavant M (2003) Experimental constraints on volatile abundances in arc magmas and their implications for degassing processes. Volcan Degassing 213:23–52 Scaillet B, Pichavant M (2005) A model of sulphur solubility for hydrous mafic melts: application to the determination of magmatic fluid compositions of Italian volcanoes. Ann Geophys 48:671–698
Scherer GW (1984) Use of the Adam–Gibbs equation in the analysis of structural relaxation. J Am Ceram Soc 67:504–511
Schiano P, Clocchiatti R, Ottolini L, Sbrana A (2004) The relationship between potassic, calc-alakine and Na-alkaline magmatism in South Italy volcanoes: a melt inclusion approach. Earth Planet Sci Lett 220:121–137
Schmidt BC, Behrens H, Riemer T, Kappes R, Dupree R (2001) Quantitative determination of water speciation in aluminosilicate glasses: a comparative NMR and IR spectroscopic study. Chem Geol 174:195–208
Shen A, Keppler H (1995) Infrared spectroscopy of hydrous silicate melts to 1000 degrees C and 10 kbar: Direct observation of H2O speciation in a diamond-anvil cell. Am Mineral 80:1335–1338