HAL Id: hal-00301592
https://hal.archives-ouvertes.fr/hal-00301592
Submitted on 30 Jun 2005HAL is a multi-disciplinary open access
archive for the deposit and dissemination of sci-entific research documents, whether they are pub-lished or not. The documents may come from teaching and research institutions in France or abroad, or from public or private research centers.
L’archive ouverte pluridisciplinaire HAL, est destinée au dépôt et à la diffusion de documents scientifiques de niveau recherche, publiés ou non, émanant des établissements d’enseignement et de recherche français ou étrangers, des laboratoires publics ou privés.
The mean meridional circulation and midlatitude ozone
buildup
G. Nikulin, A. Karpechko
To cite this version:
G. Nikulin, A. Karpechko. The mean meridional circulation and midlatitude ozone buildup. Atmo-spheric Chemistry and Physics Discussions, European Geosciences Union, 2005, 5 (3), pp.4223-4256. �hal-00301592�
ACPD
5, 4223–4256, 2005
Mean circulation and ozone buildup G. Nikulin and A. Karpechko Title Page Abstract Introduction Conclusions References Tables Figures J I J I Back Close
Full Screen / Esc
Print Version Interactive Discussion
EGU
Atmos. Chem. Phys. Discuss., 5, 4223–4256, 2005 www.atmos-chem-phys.org/acpd/5/4223/
SRef-ID: 1680-7375/acpd/2005-5-4223 European Geosciences Union
Atmospheric Chemistry and Physics Discussions
The mean meridional circulation and
midlatitude ozone buildup
G. Nikulin1and A. Karpechko2
1
Swedish Institute of Space Physics, Atmospheric Research Programme, Box 812, SE-98112 Kiruna, Sweden
2
Finnish Meteorological Institute, Arctic Research Centre, T ¨ahtel ¨antie 62, FIN-99600 Sodankyl ¨a, Finland
Received: 9 May 2005 – Accepted: 26 May 2005 – Published: 30 June 2005 Correspondence to: G. Nikulin (grigory@irf.se)
ACPD
5, 4223–4256, 2005
Mean circulation and ozone buildup G. Nikulin and A. Karpechko Title Page Abstract Introduction Conclusions References Tables Figures J I J I Back Close
Full Screen / Esc
Print Version Interactive Discussion
EGU Abstract
The development of wintertime ozone buildup over the Northern Hemisphere (NH) mid-latitudes and its connection with the mean meridional circulation in the stratosphere are examined statistically on a monthly basis from October to March (1980–2002). The ozone buildup begins locally in October with positive ozone tendencies over the North 5
Pacific, which spread eastward and westward in November and finally cover all mid-latitudes in December. During October-January a longitudinal distribution of the ozone tendencies mirrors a structure of quasi-stationary planetary waves in the lower strato-sphere and has less similarity with this structure in February–March when chemistry begins to play a more important role. From November to March, zonal mean ozone 10
tendencies (50◦–60◦N) show strong correlation (|r|=0.7) with different parameters used as proxies of the mean meridional circulation, namely: eddy heat flux, the vertical resid-ual velocity (diabatically-derived) and temperature tendency. The correlation patterns between ozone tendency and the vertical residual velocity or temperature tendency are more homogeneous from month to month than ones for eddy heat flux. A partial 15
exception is December when correlation is strong only for the vertical residual velocity. In October zonal mean ozone tendencies have no coupling with the proxies. However, positive tendencies averaged over the North Pacific correlate well, with all of them sug-gesting that intensification of northward ozone transport starts locally over the Pacific already in October. We show that the NH midlatitude ozone buildup has stable statis-20
tical relation with the mean meridional circulation in all months from October to March and half of the interannual variability in monthly ozone tendencies can be explained by applying different proxies of the mean meridional circulation.
1. Introduction
Since the early studies of Brewer (1949) and Dobson (1955) it has been recog-25
ACPD
5, 4223–4256, 2005
Mean circulation and ozone buildup G. Nikulin and A. Karpechko Title Page Abstract Introduction Conclusions References Tables Figures J I J I Back Close
Full Screen / Esc
Print Version Interactive Discussion
EGU
(Brewer-Dobson) circulation in the stratosphere. The zonal mean meridional circulation can be described by the Lagrangian mean approach (LM) or by the transformed Eule-rian mean (TEM) approach which is more practical for estimating LM motions (Andrews et al., 1987). In the TEM formulation the residual circulation (as an approximation of Lagrangian motions projected on the meridional plane) is driven by waves, while di-5
vergence of the Eliassen-Palm (EP) flux represents a net wave forcing. The vertical component of the EP flux (Fz), which is proportional to the zonal mean eddy heat flux (HF), is widely used as a proxy of wave forcing of the residual circulation.
The connection between wave forcing and ozone variability has previously been demonstrated by several authors. Nagatani and Miller (1987) have found coherent vari-10
ations between the 100 hPa Fz during September and the 30 hPa zonal mean ozone during October in the South Hemisphere (SH). The near-global structure of strato-spheric ozone response to wave forcing during stratostrato-spheric warmings has been pre-sented by Randel (1993). Fusco and Salby (1999) have shown that total ozone ten-dency (∆O3/∆t) over the Northern Hemisphere (NH) extratropics in January strongly
15
correlates with the 100 hPa Fz. Close correlation exists also between wintertime ∆O3/∆t averaged over middle and high latitudes and wave forcing accumulated dur-ing the winter (Salby and Callaghan, 2002; Weber et al., 2003). However, Randel et al. (2002a) found only weak correlations between midlatitude∆O3/∆t and upward
wave fluxes in November–December in contrast to stronger correlations in January– 20
March. Since midlatitude ozone buildup in the NH starts between October and Novem-ber (Fioletov and Shepherd, 2003) and this is thought to result from the meridional stratospheric transport, the lack of strong correlations in November–December seems somewhat surprising.
The residual circulation in the stratosphere can be estimated from the net radiative 25
heating rates using satellite observations (e.g. Solomon et al., 1986). Despite large uncertainties in the estimations (Eluszkiewich et al., 1996, 1997), there is a broad agreement between the circulations obtained from different data sources as well as between calculations and theoretical expectations. The calculations reproduce tropical
ACPD
5, 4223–4256, 2005
Mean circulation and ozone buildup G. Nikulin and A. Karpechko Title Page Abstract Introduction Conclusions References Tables Figures J I J I Back Close
Full Screen / Esc
Print Version Interactive Discussion
EGU
upwelling and extratropical downwelling and also demonstrate stronger velocities in the northern winter circulation than in the southern one. That agrees well, at least qualitatively, with general concepts of the “extratropical pump” theory (see Holton et al., 1995; Plumb and Eluszkiewich, 1999). However, only a few studies have aimed to investigate direct statistical connections between the residual circulation and ozone. 5
Geller et al. (1992) have shown positive correlations between the ozone mixing ratio and the vertical residual velocity above the ozone peak and negative correlations below the peak during December-February for 1979–1986. They have also pointed out a delay of the wintertime total ozone maximum at 60◦N relative to the vertical residual velocity maximum.
10
The present study aims at further exploration of the dynamical influence on the total ozone variability. The velocity of the residual circulation is a more straightforward proxy for the meridional stratospheric transport than HF though the latter is easier to derive. However, uncertainties in the diabatically-derived residual velocities may hamper its application as a dynamical proxy for total ozone. Here, the attempt is made to analyse 15
in detail the relationship of HF and the residual circulation to the NH midlatitude total ozone month by month from October to March. Of particular interest is how well the diabatically-derived residual circulation can mirror interannual variability of wave forcing and ozone buildup. The study starts with an examination of a spatial-time structure of monthly ozone tendencies and their relationship with HF. Then we demonstrate the 20
connection between the residual velocities and wave forcing as represented by HF. Finally, we link ozone tendencies to the residual circulation.
2. Data and method
We use the version 8 of monthly TOMS/SBUV merged total ozone data (the 5◦ zonal mean and 10◦×30◦gridded sets). The 50◦–60◦N midlatitude region where ozone data 25
is available in all winter months is chosen because∆O3/∆t in this region correlates
ACPD
5, 4223–4256, 2005
Mean circulation and ozone buildup G. Nikulin and A. Karpechko Title Page Abstract Introduction Conclusions References Tables Figures J I J I Back Close
Full Screen / Esc
Print Version Interactive Discussion
EGU
40◦–60◦N region. In the 1990s there are several years with missing zonal mean ozone data over 55◦–60◦N in December (1992–1994, 1998) and January (1993–1995). Also there is no data over 50◦–60◦N in December 1997. All gaps are filled by spatial extrap-olation that does not appreciably influence the obtained results. Monthly∆O3/∆t is
simply the difference of total ozone values between months. Monthly mean ozone val-5
ues are generally associated with ozone values near the middle of the month. Hence, for example, the January∆O3/∆t here as a difference between January and December
presents ozone changes from approximately 15 December to 15 January. We should emphasize that this period is not an exact rule because the period depends on total ozone distribution during the month.
10
For the September–March period (1979–2002) we calculate daily meridional and vertical residual mean velocities ( ¯v∗, ¯w∗) and HF. The residual velocities are estimated
from the quasi-geostrophic TEM thermodynamic and continuity equations:
∂ ¯T ∂t + ¯v ∗1 a ∂ ¯T ∂ϕ+ ¯w ∗S = ¯Q, (1) 1 a cos ϕ ∂ ∂ϕ( ¯v ∗cos ϕ)+ 1 ρ0 ∂ ∂z(ρ0w¯ ∗)= 0. (2) 15
Here ¯T is the zonal mean temperature; ¯Q is the zonal mean net diabatic heating;
S=HN2/R is the static stability parameter; the log-pressure vertical coordinate is
z=−H ln(p/1000 hPa) with H=7 km; and a, ϕ, R and ρ0 are the radius of the Earth, latitude, the gas constant and a basic state density, respectively (see for more details e.g. Dunkerton, 1978; Solomon et al., 1986; Gille et al., 1987). Temperature, wind 20
and net diabatic heating fields for calculations are taken from the ERA-40 reanalysis. Also, for comparison, we use temperature and wind data from the NCEP/NCAR re-analysis. Estimations of the residual circulation have large uncertainties mainly due to uncertainties in the calculated net heating rates (Eluszkiewicz et al., 1997). The usual consequence of these heating rate uncertainties is that the global mean mass balance 25
ACPD
5, 4223–4256, 2005
Mean circulation and ozone buildup G. Nikulin and A. Karpechko Title Page Abstract Introduction Conclusions References Tables Figures J I J I Back Close
Full Screen / Esc
Print Version Interactive Discussion
EGU
is not maintained (the global integral of ¯w∗on isobaric levels is not equal to zero). In or-der to reduce the global integral of ¯w∗to zero, we apply a correction factor for ¯w∗which is independent of latitude (e.g. Murgatroyd and Singelton, 1961; Shine, 1989). At an isobaric level such correction strongly influences accuracy of the estimated circulation in regions close to radiative equilibrium (small residual velocities). On average the cor-5
rection is about 5–10% of uncorrected values of ¯w∗ in winter polar regions, 10–20% in the tropics and up to 30–50% in summer polar regions. Values of 10–20% in the tropics are similar to the 15% reported by Randel et al. (2002b). Large errors in the net heat-ing rates and consequently in the estimated velocities also occur in regions closer to radiative equilibrium where the solar heating and the infrared cooling almost balance 10
each other (Olaguer et al., 1992). The combination of initial “radiative” uncertainties and the following correction can result in a really questionable quality of the estimated velocities under conditions close to radiative equilibrium. We did not find any consid-erable difference in ( ¯v∗, ¯w∗) calculated on a daily basis and then averaged monthly with
( ¯v∗, ¯w∗) based on monthly averaged data. Weighting with the cosine of the latitude is
15
applied for averaging in latitudinal belts.
3. Ozone tendencies
Figure 1 shows the total wintertime (November–March, Fig. 1a) and monthly (from October to March, Fig. 1b) zonal∆O3/∆t averaged over 50◦–60◦N. The year for the winter denotes the year as in January. The ozone merge dataset begins in November 20
1978 so there is no∆O3/∆t in October and November of the 1979 winter. Also there
is a data gap in October of the 1996 winter. The tendencies are always negative in September (not shown) and close to zero in October which presents a transition period between summer photochemical decay and wintertime dynamical buildup. On average the tendencies increase until January when they reach a seasonal maximum and than 25
symmetrically decrease towards spring becoming negative in April (not shown). The December and February values are of about the same magnitude. However, in some
ACPD
5, 4223–4256, 2005
Mean circulation and ozone buildup G. Nikulin and A. Karpechko Title Page Abstract Introduction Conclusions References Tables Figures J I J I Back Close
Full Screen / Esc
Print Version Interactive Discussion
EGU
years seasonal behaviour of∆O3/∆t differs strongly from the average, reflecting the
influence of various random dynamical and chemical processes on midlatitude ozone during winter. Monthly ozone tendencies do not correlate with each other and can be regarded as independent time series. In contrast, monthly total ozone has strong auto-correlations (Fioletov and Shepherd, 2003). Only the January and February tendencies 5
correlate significantly (r=0.52 and 0.48) with the total wintertime ∆O3/∆t. Indeed, low
January∆O3/∆t in 1993 and 1995 (high in 1982, 1991 and 1994) result in low (high)
total wintertime∆O3/∆t in those years. A combination of low ∆O3/∆t in November,
January and March of 2000 also leads to low wintertime∆O3/∆t even though ∆O3/∆t
is quite high in December and February. Thus, low∆O3/∆t at the end of winter does
10
not necessarily mean less poleward ozone transport or more chemical loss through the whole winter.
Estimated linear trends in ∆O3/∆t for the 1980–2002 period are presented in
Table 1. Though no significant trends are found for any month, it is interesting to note that the sign of the trend changes from positive in November (about zero) and Decem-15
ber to negative from January to March. Such∆O3/∆t trend distribution is similar to
the HF trends in November–February shown by Randel et al. (2002a): weak insignif-icant positive trends in November, December and negative ones in January (at the edge of statistical significance) and February (insignificant) for 1979–2000. Newman and Nash (2000) found significant negative trends in the January–February averaged 20
HF (1979–1999). Later Karpetchko and Nikulin (2004) confirmed significant negative trends in the January–February HF and positive trends in the November–December HF which are at the edge of statistical significance (1979–2002). Averaged in the same way ∆O3/∆t shows a similar picture: an insignificant positive trend for November–
December as well as a significant negative trend for January–February. The negative 25
trend becomes stronger and more significant for January–March (see Table 1) while the total wintertime trend is still negative but insignificant because of the positive trend in November–December. Hence the decline in∆O3/∆t occurs only during January–
ACPD
5, 4223–4256, 2005
Mean circulation and ozone buildup G. Nikulin and A. Karpechko Title Page Abstract Introduction Conclusions References Tables Figures J I J I Back Close
Full Screen / Esc
Print Version Interactive Discussion
EGU
data in November 1979. If, for example, we take into account 1979, the January and February trends become more negative as can be seen from Fig. 1b.
Figure 2 shows∆O3/∆t over the NH averaged for 1980–2002 in the initial (October),
middle (December) and final (March) stages of the ozone buildup. Though the October zonal mean∆O3/∆t is about zero (Fig. 1b), a longitudinal distribution of tendencies in
5
October is not uniform (Fig. 2a). A positive maximum is located over the north-eastern edge of Russia while the opposite part of the NH is covered by negative values. It is interesting to note that a subtropical minimum of∆O3/∆t is located over the Pacific just
south of the positive maximum. Presence of the north-south dipole suggests intensifi-cation of northward ozone transport which is confined within the Pacific region. Also, 10
deepening of the Aleutian low (from summer to winter) and associated decreasing of the tropopause height can result in accumulation of ozone in the lower stratosphere. In November (not shown) the positive maximum of ∆O3/∆t is still centred over the
north-eastern edge of Russia and positive tendencies spread eastward and westward from the maximum covering almost the whole region north of 30◦N with the exception 15
of a negative region over the Atlantic. The December ∆O3/∆t (Fig. 2b) is positive
over all NH midlatitudes and the second positive maximum which can be associated with the Icelandic low appears over the north-western Atlantic. The same structure with greater magnitude is seen in January (not shown). The February (not shown) and March (Fig. 2c) tendencies have less resemblance to the December-January ones 20
especially in March when the ∆O3/∆t pattern has smaller scale features and differs
strongly from other months.
The longitude distribution of ∆O3/∆t in October–January is similar to total ozone
distribution in the same months which is related to a structure of quasi-stationary plan-etary waves in the lower stratosphere (Kurzeja, 1984; Hood and Zaff, 1995). These 25
waves still exist in the lower stratosphere during the February–March period that is also mirrored in total ozone fields (not shown) but the∆O3/∆t patterns are not well
tied to the wave structure as in the preceding months. The less pronounced plane-tary wave pattern in∆O3/∆t during February and March is most probably a result of
ACPD
5, 4223–4256, 2005
Mean circulation and ozone buildup G. Nikulin and A. Karpechko Title Page Abstract Introduction Conclusions References Tables Figures J I J I Back Close
Full Screen / Esc
Print Version Interactive Discussion
EGU
chemical ozone loss inside the polar vortex and following dilution of the vortex air into midlatitudes. These processes are more intensive in late winter and early spring (Had-jinicolaou and Pyle, 2004) and can introduce strong spatial deviations in the midlatitude ∆O3/∆t fields, especially during the vortex breakup. Between 1980 and 2002 the vor-tex breakup at the 475 K level occurred 5 times in March (Karpechko et al., 2005)1. 5
As a summary of the chapter we conclude that the wintertime ozone buildup begins over the north-eastern edge of Russia in October, spreads over the NH in November and finally covers all NH midlatitudes in December. In October–January total ozone is more under dynamical control and the longitude structure of∆O3/∆t mirrors the
longi-tude structure of planetary waves in the lower stratosphere. Chemistry begins to play a 10
more significant role in the late winter-early spring when the∆O3/∆t fields show less
similarity with the planetary wave pattern.
4. Heat flux and ozone tendencies
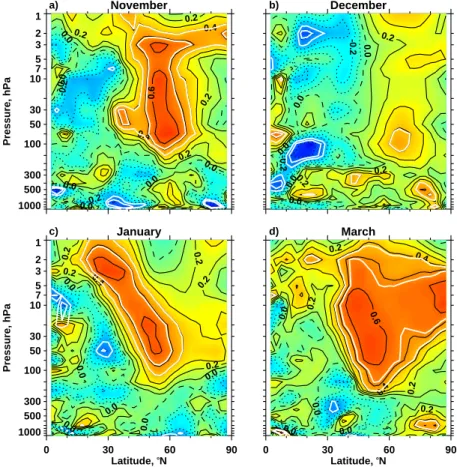
Figure 3 shows one-point correlations of∆O3/∆t averaged over 50◦–60◦N with HF for (a–c) November–January and (d) March. For these plots, daily values of HF are aver-15
aged over one-month periods consistent with monthly mean∆O3/∆t (15th of previous
month–15th of given month). For example the January HF means here an average from 15 December to 15 January. In November (Fig. 3a) an area of pronounced posi-tive correlations (rmax=0.69) is located in the midlatitude stratosphere with a maximum stretching from 100 to 10 hPa. The positive correlations in December are weak and 20
insignificant in most of the stratosphere north of 50◦N (Fig. 3b). A small region in the lower stratosphere is on the edge of statistical significance (rmax=0.45). Also, there are significant negative correlations in the tropical upper troposphere. This feature is absent in other months and looks random so we do not discuss it in the paper. In
1
Karpechko A., Kyro E., and Knudsen, B. M.: Arctic and Antarctic polar vortices 1957–2002 as seen from the ERA-40 reanalyses, in review, J. Geophys. Res., 2005.
ACPD
5, 4223–4256, 2005
Mean circulation and ozone buildup G. Nikulin and A. Karpechko Title Page Abstract Introduction Conclusions References Tables Figures J I J I Back Close
Full Screen / Esc
Print Version Interactive Discussion
EGU
January (Fig. 3c) positive correlations (rmax=0.68) cover all heights in the stratosphere with a slope from the upper subtropical to the lower midlatitude stratosphere. The February correlations north of 50◦N (not shown) are qualitatively almost identical to the December ones (Fig. 3b) but the lower stratospheric maximum is clearly pronounced (rmax=0.69, 70 hPa, 70◦N). In March (Fig. 3d) positive correlations (rmax=0.71) spread 5
over all extratropical stratosphere reaching the North Pole. The correlation pattern be-tween the wintertime ∆O3/∆t and HF for the same period (not shown) is similar to
the December and February ones. The maximal correlation coefficient is about 0.7, located at 70 hPa, 65◦N.
There are no significant correlations between the zonal mean ∆O3/∆t and HF in
10
October when the zonal mean∆O3/∆t is about zero. However, if we average ∆O3/∆t
over the region with maximal positive values in Fig. 2a (60◦–70◦N, 105◦–225◦E; the North Pacific hereafter), positive correlations (rmax=0.7) centred at 55◦–60◦N appear in the stratosphere (not shown). The pattern obtained is absolutely identical to the November one for the zonal mean ∆O3/∆t in Fig. 3a. Though the North Pacific
15
∆O3/∆t is not a zonal mean quantity, the strong correlation can be explained by the fact that the considerable contribution to the October zonal mean HF also comes from the Pacific. Zonal mean HF between 50◦N and 70◦N (the region with maximal cor-relations in Fig. 3a) shows significant coherence (r =0.75÷0.85) with the Pacific HF (50◦–70◦N, 105◦–225◦E) at all levels in the stratosphere. This finding supports the 20
idea that northward ozone transport strengthens over the Pacific already in October. We should note that the latitude belt 60◦–70◦N is different from other months. The Oc-tober∆O3/∆t averaged over 50–60◦N and the same longitudes (105◦–225◦E) shows only weak insignificant positive correlations with HF in the stratosphere.
Presence of positive correlations between ∆O3/∆t and HF is in agreement with
25
theoretical considerations and previous results (e.g. Randel et al., 2002a; Salby and Callaghan, 2002; Weber et al., 2003). However, the correlation patterns are not uni-form during winter and maximal values of correlations are often located above 100 hPa and at different latitudes. The region 45◦–75◦N, 100 hPa is usually taken to define
ACPD
5, 4223–4256, 2005
Mean circulation and ozone buildup G. Nikulin and A. Karpechko Title Page Abstract Introduction Conclusions References Tables Figures J I J I Back Close
Full Screen / Esc
Print Version Interactive Discussion
EGU
approximately the amount of wave activity entering into the stratosphere from the tro-posphere. As can be seen from Fig. 3, the HF averaged over this region is not always an optimal proxy of wave forcing for the regression models describing midlatitude total ozone.∆O3/∆t has a pronounced relation with HF in the early stage of ozone buildup
(October–November), although in October this relation is regional. It is not clear why 5
correlations are weaker in the middle stage of the buildup (December) in compari-son with the preceding and following months. Qualitatively the December correlation pattern is similar to the February one when correlations are strong. The November ∆O3/∆t is lower than the December ∆O3/∆t but shows the pronounced positive cor-relation with HF in the stratosphere. The extrapolation of the missing December data 10
in 1992–1994 and 1997–1998 can have influenced the results obtained, but removing these 5 years does not change the December correlations. The correlation patterns are identical in October and November during the formation of the polar vortex but not as homogeneous as in the following months with the presence of a developed polar vortex. The position and strength of the polar vortex strongly define ozone distribution 15
and conditions for wave propagation in the winter stratosphere. Nonuniform patterns may therefore be attributed to the behaviour of the polar vortex. Consistent results are obtained using the NCEP/NCAR Reanalysis (limited by the uppermost 10 hPa level) so both the ERA40 and NCEP/NCAR data sets are in agreement here. In general, maximal absolute values of correlation coefficients during winter are close to 0.7 (with 20
the exception of December) thus HF explains about 50% of variance in∆O3/∆t.
Randel et al. (2002) mention that one source of variability in the results is ran-dom episodic nature of wave forcing with the usual wave event duration being about 1–2 weeks. Hence the obtained correlation coefficients also depend on which part of individual wave events have fallen into an averaging period for HF from year to year. 25
Practically, in each month (not in December) we can select an averaging period (plus-minus several days) which gives higher maximal correlation coefficients (more than 0.7). However, this “optimal” period is different from month to month so in the study we use the same period giving more or less consistent results for all winter months.
ACPD
5, 4223–4256, 2005
Mean circulation and ozone buildup G. Nikulin and A. Karpechko Title Page Abstract Introduction Conclusions References Tables Figures J I J I Back Close
Full Screen / Esc
Print Version Interactive Discussion
EGU 5. Heat fluxes and the residual circulation
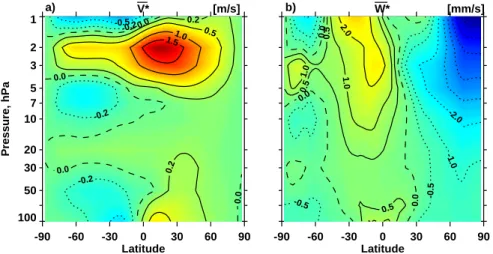
Since HF is the simplest proxy of the wave forcing we examine relations between HF and the calculated residual velocities. An example of the January ¯v∗and ¯w∗ averaged for 1980–2002 is shown in Fig. 4. Qualitatively the global patterns of ¯v∗ and ¯w∗ agree with previous studies (e.g. Solomon et al., 1986; Eluszkiewicz et al., 1997). Upward 5
motions in the tropics shifting to the summer hemisphere with altitude and poleward-downward motions in the winter extratropics are the prominent features of the residual circulation. A layered circulation south of 60◦S may be due both to the vertical oscil-lations in the ERA-40 temperature at high latitudes of the SH (SPARC 2002) and to larger uncertainties in the calculated residual velocities during the SH summer. The 10
summer stratosphere, especially the lower, is much closer to radiative equilibrium than its winter counterpart (e.g. Shine, 1987), leading to smaller values for the calculated velocities as well to larger uncertainties. The layered circulation is not observed for ex-ample in September when the SH stratosphere is not as close to radiative equilibrium as in January. Absolute values of ¯w∗are less than 1 mm s−1in the lower stratosphere 15
and increase up to 8 mm s−1in the upper polar stratosphere. ¯v∗has its maximum in the upper tropical stratosphere (about 2 m s−1) and values less than 0.5 m s−1below 5 hPa. A small region with higher ¯v∗and ¯w∗between 100 and 50 hPa centred at the equator is an exception that most likely represents an influence of the tropical convection. In this study we concentrate on the NH and limit the residual circulation to the region between 20
30◦S and 90◦N.
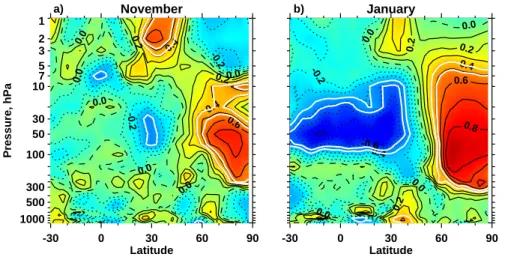
Figure 5 shows one-point correlations of HF averaged over 45◦–75◦N, 100 hPa with ¯
w∗ for (a) November and (b) January. Daily values of the residual velocities and HF are averaged over one-month periods in the same way as in the previous section (15th of previous month–15th of given month). An area of strong negative correlations north 25
of 60◦N appears in all months from November to March. December, February and March are identical to January and not shown here. Negative correlations are confined to the lower stratosphere in November (rmi n=–0.72) and spread up to 2–3 hPa in the
ACPD
5, 4223–4256, 2005
Mean circulation and ozone buildup G. Nikulin and A. Karpechko Title Page Abstract Introduction Conclusions References Tables Figures J I J I Back Close
Full Screen / Esc
Print Version Interactive Discussion
EGU
following months (rmi n≈–0.8÷–0.9). Positive correlations with upward motions exist in the tropical stratosphere but they are nonuniform and only some patches are signifi-cant in December-March. The obtained correlations are not sensitive to a choice of level for HF in the lower stratosphere. However, if HF is taken at levels higher than 20 hPa, the polar minimum shifts upward and the tropical positive correlations become 5
more homogeneous above 10 hPa. Newman et al. (2001) showed that correlation of HF and the polar stratospheric temperature depends on radiative damping time which is shorter in the middle and upper stratosphere and longer in the lower stratosphere (Newman and Rosenfield, 1997). One-month periods as used here can mask part of the variability in regions with shorter damping time than one month. Indeed, HF 10
taken at 10–5 hPa and 10-day averaging for both HF and ¯w∗bring pronounced positive correlation (rmax≈0.7÷0.9) between 30◦S–30◦N above 10 hPa. However, because of the shorter period, variability in the 10-day correlation patterns is higher than in the monthly samples. The fragmented correlation pattern in the lower tropical stratosphere for monthly samples lets us assume that interannual variability of ¯w∗ is not well cap-15
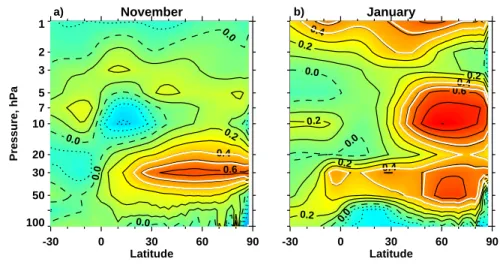
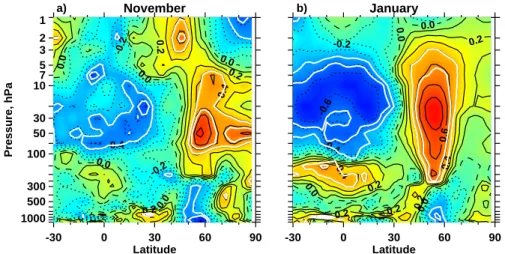
tured over the region because of larger uncertainties. We can test this suggestion by using temperature tendency (∆T/∆t) which operates coherently with HF over the entire winter hemisphere and even over the subtropics of the summer hemisphere (Randel 1993; Salby and Callaghan, 2002). Figure 6 shows correlations of HF with∆T/∆t for November and January by analogy with Fig. 5. A clear pronounced north-south dipole 20
like in January (Fig. 6b) is observed from December to March. Negative correlations (rmi n≈–0.7÷–0.9) cover the whole lower stratosphere in the tropics and subtropics of both hemispheres. In November (Fig. 6a) only weak negative correlations at the edge of significance exist in the NH subtropics but positive ones (rmax=0.74) are located in the polar lower stratosphere/upper troposphere. The∆T/∆t correlation patterns also 25
depend on radiative damping time and show similar behaviour to ¯w∗, moving upward with a 10-day averaging period and HF taken at 10–5 hPa. The strong correlation be-tween HF and∆T/∆t in the tropical lower stratosphere supports the presence of larger uncertainties in ¯w∗ over this region. In fact, the tropical lower stratosphere is close
ACPD
5, 4223–4256, 2005
Mean circulation and ozone buildup G. Nikulin and A. Karpechko Title Page Abstract Introduction Conclusions References Tables Figures J I J I Back Close
Full Screen / Esc
Print Version Interactive Discussion
EGU
to radiative equilibrium because the dynamical temperature response to extratropical wave forcing is much smaller (only several Kelvins) in the tropics as compared with the extratropics (Randel 1993; Salby and Callaghan, 2002). The correction applied to the velocities during calculations, as mentioned in Sect. 2, is about 10–20% of the uncor-rected values of ¯w∗ in the tropics, i.e. two times greater than for the NH high latitudes. 5
It is most likely that for the tropical lower stratosphere, the combination of small net heating rates and the correction procedure leads to large uncertainties in ¯w∗.
As expected, HF correlates positively with ¯v∗ in the extratropical stratosphere in all months from November to March. In November (Fig. 7a) an area of positive correla-tions (rmax=0.65) is narrow and elongated from the Equator to the North Pole along 10
the 30 hPa level. During December-March the extratropical correlation patterns be-low 3 hPa are nearly analogous to the January pattern (Fig. 7b). Positive correlations extend upward and the maximum (rmax≈0.7–0.8) is located in the polar middle strato-sphere north of 60◦N. At the same time the positive correlations for ¯v∗ are not as uniform during winter as the negative correlations for ¯w∗.
15
In October when only∆O3/∆t averaged over the North Pacific is coupled with HF, no
significant correlations were found between HF (45◦–75◦N, 100 hPa) and either ¯w∗nor ¯
v∗. However, HF taken above 30 hPa correlates well (|r|≈0.7–0.8) with both ¯w∗ and ¯v∗
in the middle stratosphere north of 60◦N. Also HF shows good coherence with∆T/∆t (rmax≈0.7) in the polar lower stratosphere that is similar with November (Fig. 6a). As 20
for HF, the main contribution to interannual variability of zonal mean∆T/∆t in October comes from the Pacific. Hence all relations between zonal mean quantities in October mainly mirror local processes over the Pacific.
Stronger HF into the stratosphere results in the stronger residual circulation and vice versa. There is a good agreement with theoretical expectations in the middle 25
and upper tropical stratosphere as well as in the polar winter stratosphere. However, the residual circulation in the lower tropical stratosphere which is close to radiative equilibrium shows a weak relation with the wave forcing because of larger uncertainties. At the same time interannual variations of∆T/∆t have much better coherence with HF
ACPD
5, 4223–4256, 2005
Mean circulation and ozone buildup G. Nikulin and A. Karpechko Title Page Abstract Introduction Conclusions References Tables Figures J I J I Back Close
Full Screen / Esc
Print Version Interactive Discussion
EGU
in regions close to radiative equilibrium than the estimated residual velocities. HF, ∆T/∆t and the residual circulation based on the NCEP/NCAR reanalysis (only heating rates from the ERA-40) give consistent results at levels presented in both datasets.
6. The residual circulation and ozone tendencies
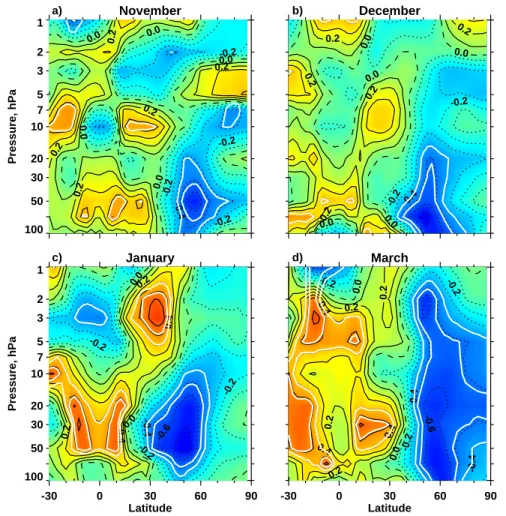
Finally we examine how∆O3/∆t is related to the estimated residual circulation. Here
5
we use time averaging for ¯w∗ and ¯v∗ from 20th of previous month to 20th of given month that results in approximately equal maximal absolute values of correlation coef-ficients in all months. Figure 8 shows one-point correlations of∆O3/∆t averaged over
50◦–60◦N with ¯w∗for (a–c) November–January and (d) March. Theoretically,∆O3/∆t
correlates negatively with downward velocities in the extratropics and positively with 10
upward ones in the tropics. Midlatitude correlation patterns are similar in November-February (November-February not shown): an area of negative correlations is located in the lower stratosphere and centred at 50◦–60◦N, 50–70 hPa (rmi n≈–0.65÷–0.75). The spatial structure of extratropical correlations is more uniform from month to month in compar-ison with HF (Fig. 3). Noticeable correlation is observed in December (Fig. 8b) when 15
correlation between∆O3/∆t and HF is weak (Fig. 3b). In March (Fig. 8d) negative
cor-relations spread upward and northward covering almost the whole extratropical strato-sphere. Positive correlations in the tropics are variable and more marked in January and March but weaker in other months.
The maximal response of ¯w∗ to wave forcing is observed north of 60◦N (Fig. 5), but 20
the strongest negative correlations between∆O3/∆t and ¯w∗ are found south of 60◦N where the correlation between ¯w∗ and HF (45◦–75◦N, 100 hPa) is weak. As noted in Sect. 4, the region 45◦–75◦N, 100 hPa does not always coincide with a region of the strongest correlations between∆O3/∆t and HF (Fig. 3). Indeed, HF averaged over
the regions with strongest correlation in separate months (Fig. 3) shows almost the 25
same correlation patterns with ¯w∗ as ∆O3/∆t in Fig. 8. Hence, HF averaged over
ACPD
5, 4223–4256, 2005
Mean circulation and ozone buildup G. Nikulin and A. Karpechko Title Page Abstract Introduction Conclusions References Tables Figures J I J I Back Close
Full Screen / Esc
Print Version Interactive Discussion
EGU
midlatitudes. Since the main dynamical contribution to total ozone variability comes from the lower stratosphere where ozone has a long photochemical lifetime (Brasseur and Solomon, 1986) it is not surprising that the strongest negative correlations with
¯
w∗ are observed in the lower stratosphere. Maximal absolute values of correlation coefficients (≈0.7) and accordingly explained variance (≈50%) are the same as for HF. 5
Changing the averaging period for ¯w∗ for several days can also give higher absolute correlation coefficients in separate months that is similar to the behaviour of the HF correlations.
Theoretically extratropical ∆O3/∆t correlates positively with the northward mean
meridional velocity in the stratosphere. Though there are expected positive correla-10
tions between ∆O3/∆t and ¯v∗ in all months (rmax≈0.6÷0.7), the correlation patterns are variable and differ from month to month contrary to the negative correlations for ¯w∗. In November (Fig. 9a) a narrow belt of positive correlations stretches from the Equator to the North Pole at 30 hPa. It is interesting to note that this feature is identical to the November correlation pattern between HF and ¯v∗(Fig. 7a). From the following months 15
January (Fig. 9b) with a wide area of positive correlations in the NH subtropics can be singled out. December, February and March (not shown) have two belts of significant correlations: one in the lower and another in the middle stratosphere that only is to some extent similar to November (Fig. 9a). Large uncertainties in the calculated ¯v∗
in comparison with ¯w∗ may explain why the positive correlations for ¯v∗are nonuniform 20
and differ from month to month while the negative correlations for ¯w∗ are almost simi-lar. Calculation of the residual circulation is an iteration procedure when at the first step we assume that ¯v∗ is equal 0 to get the first estimate of ¯w∗ from the thermodynamic equation (1). Then we get the first estimate of ¯v∗at a given latitude from the continuity equation (2) through integration of the vertical derivative ofρ0w¯∗( ¯w∗has already been 25
corrected) from a pole to this latitude, assuming that ¯v∗=0 at the Poles. In this case the
calculated ¯v∗ accumulates uncertainties in the vertical derivative of ρ0w¯∗ from a pole to the given latitude. Hence all uncertainties in ¯v∗ come non-locally from ¯w∗, and it is most likely that ¯v∗ has larger uncertainties than ¯w∗.
ACPD
5, 4223–4256, 2005
Mean circulation and ozone buildup G. Nikulin and A. Karpechko Title Page Abstract Introduction Conclusions References Tables Figures J I J I Back Close
Full Screen / Esc
Print Version Interactive Discussion
EGU
We showed in the previous section that temperature tendencies are strongly cou-pled with the wave forcing. Ozone tendencies should also be coherent with ∆T/∆t because interannual variability of both is controlled by the mean meridional circulation. The averaging period for∆T/∆t giving the best correlation with ∆O3/∆t is almost
con-sistent with the averaging period for ¯w∗(20th of previous month to 20th of given month) 5
in October–January but is shifted forward by approximately 10–15 days in February– March. Figure 10 shows correlations of the (a) November and (b) January∆O3/∆t with
∆T/∆t averaged for 20 October–20 November and 15 December–15 January, respec-tively. The observed north-south dipole in the stratosphere exists in all months with the exception of December, similar to the structure of correlation between HF and∆T/∆t 10
in Fig. 6. By analogy with ¯w∗, the maximum of extratropical correlation is located south of 60◦N while the strongest correlation of∆T/∆t with HF (45◦–75◦N, 100 hPa) is found north of 60◦N (Fig. 6). The explanation for the difference is the same as for ¯w∗: HF over 45◦–75◦N, 100 hPa does not describe the residual circulation in midlatitudes as well. HF taken over regions with maximal correlation in Fig. 3 brings almost the same 15
correlation patterns with∆T/∆t as ∆O3/∆t in Fig. 10. The observed dipole is weaker
in November (Fig. 10a) and becomes stronger in January (Fig. 10b) remaining similar in February and March. In December only the northward part of the dipole (rmax=0.45) centred at 50◦N is observed. In this respect, December with weaker correlation be-tween∆O3/∆t and both HF and ∆T/∆t is sharply distinguished from other months but
20
we could not find any reasonable explanation.
In the early stage of the ozone buildup the October∆O3/∆t averaged over the North
Pacific shows an small area of negative correlation with ¯w∗ in the polar lower strato-sphere but no correlation with ¯v∗. Also∆T/∆t averaged for 20 September–20 October correlates well (rmax=0.7) with the North Pacific ∆O3/∆t showing a north-south dipole
25
in the lower stratosphere. Though interannual variability in both tendencies is controled by the mean meridional circulation,∆T/∆t as one more “proxy” for ∆O3/∆t explains
50% of the variance in ozone tendencies thus consistent with the results for HF and ¯
ACPD
5, 4223–4256, 2005
Mean circulation and ozone buildup G. Nikulin and A. Karpechko Title Page Abstract Introduction Conclusions References Tables Figures J I J I Back Close
Full Screen / Esc
Print Version Interactive Discussion
EGU
7. Summary and discussion
This study focuses on development of the wintertime ozone buildup in the NH midlat-itudes (50◦–60◦N) during the October–March period and the statistical relationship of the buildup with the mean meridional circulation. The buildup begins locally in October when positive∆O3/∆t appears over the North Pacific. Two processes can be
respon-5
sible for the local beginning of the buildup: intensification of northward ozone transport confined in the Pacific and deepening of the Aleutian low leading to accumulation of ozone in the lower stratosphere. At the same time presence of negative∆O3/∆t over
the opposite part of the NH gives the October zonal mean∆O3/∆t close to zero. In
November positive ∆O3/∆t spreads eastward and westward from the North Pacific
10
and finally covers all NH midlatitudes in December. In the early and middle stages of the buildup (October-January), the longitude structure of ∆O3/∆t mirrors total ozone
distribution (maxima and minima) which is related to quasi-stationary planetary waves in the lower stratosphere. During the final stage (February and March)∆O3/∆t shows
less resemblance with the planetary wave pattern which may be explained by a dilution 15
of ozone depleted air from the polar vortex into midlatitudes as well as the vortex break-up for March. There are no significant linear trends in monthly zonal mean∆O3/∆t for
1980–2002. However the January-February trend is negative and significant while the November–December trend is positive and insignificant. Such behaviour of∆O3/∆t
trends is similar to the HF trends reported earlier (Randel et al., 2002; Karpetchko and 20
Nikulin, 2004).
Eddy heat flux, residual velocities and temperature tendency are used to estimate the contribution from the mean meridional circulation to interannnual variability of monthly ∆O3/∆t. On average for all months from November to March, absolute values of cor-relation coefficients between zonal mean ∆O3/∆t and HF, ∆T/∆t or ¯w∗ are close to 25
0.7. Two points should be noted. Firstly, the correlation patterns between∆O3/∆t and
HF are not uniform during the buildup and the maxima are located at different latitudes and levels. That is the opposite to correlation patterns of∆O3/∆t with ∆T/∆t and ¯w∗
ACPD
5, 4223–4256, 2005
Mean circulation and ozone buildup G. Nikulin and A. Karpechko Title Page Abstract Introduction Conclusions References Tables Figures J I J I Back Close
Full Screen / Esc
Print Version Interactive Discussion
EGU
which are almost homogeneous from month to month. As a consequence of hetero-geneity in the HF and∆O3/∆t correlation patterns, HF averaged over the usual region
45◦–75◦N, 100 hPa is not always an optimal proxy for total ozone variability in midlati-tudes. Secondly, one partial exception is December, in the middle stage of the buildup, when both∆T/∆t and ¯w∗ show a strong response to wave forcing presented by HF. 5
However,∆T/∆t and HF have weaker correlation (rmax=0.45) with ∆O3/∆t while the
¯
w∗ correlation coefficient (rmi n=–0.7) is similar to that in other months. We have not found any explanation for this feature. Based on several parameters approximating the strength of the mean meridional circulation, an average correlation coefficient equal to 0.7 can be confidently accepted. Hence, assuming a linear relation, half of the interan-10
nual variability in the 50◦–60◦N zonal mean∆O3/∆t for 1980–2002 can be explained
by the mean meridional circulation. The results based on the NCEP/NCAR reanaly-sis show very good qualitative and quantitative agreements with the results based on the ERA-40, suggesting that the obtained results are independent of which dataset is chosen.
15
A similar relation is found for positive ∆O3/∆t over the North Pacific (60◦–70◦N, 105◦–225◦E) in October when the zonal mean∆O3/∆t is about zero but the NH ozone
buildup begins locally. The October correlation patterns of the North Pacific∆O3/∆t
with HF or∆T/∆t are clearly pronounced and identical to the November ones for zonal mean∆O3/∆t. These facts, as well as presence of the ∆O3/∆t minimum in the
sub-20
tropical Pacific, support the local onset of the ozone buildup over the Pacific already in October. Though the 60◦–70◦N belt is not exactly midlatitudes, the observed develop-ment of the NH ozone buildup emphasizes the presence of zonal asymmetries in the Brewer-Dobson circulation which are especially noticeable in October.
The worst observed correlation of ¯w∗with HF and∆O3/∆t in the tropical lower
strato-25
sphere most likely resulted from uncertainties in the estimated residual circulation. These uncertainties come from errors in the radiative heating rates and the follow-ing latitude independent correction, reducfollow-ing the global integral of ¯w∗on isobaric levels to zero. Such latitude-independent corrections, however, have a latitude-dependent
re-ACPD
5, 4223–4256, 2005
Mean circulation and ozone buildup G. Nikulin and A. Karpechko Title Page Abstract Introduction Conclusions References Tables Figures J I J I Back Close
Full Screen / Esc
Print Version Interactive Discussion
EGU
sponse which introduces larger uncertainties in regions close to radiative equilibrium. During November–March ¯w∗ shows strong coherence with HF and ∆O3/∆t north of
50◦N where the stratosphere is far from radiative equilibrium. Of course practical im-plementation of the residual circulation is not as simple as HF or∆T/∆t and can be used more as an additional method to check theoretically-expected relations as in the 5
study. One useful point here is also the possibility to test the accuracy of the estimated ¯
w∗, comparing the response in ¯w∗to wave forcing with the distinct response in∆T/∆t. The NH midlatitude ozone buildup has a stable relation with the mean meridional cir-culation in all months from October to March, though in October this relation is regional and December is somewhat questionable. The obtained half of the explained variance 10
in∆O3/∆t is lower than in the results of Salby and Callaghan (2002) and Weber et
al. (2003) where total ozone was averaged over wider latitude belts including the polar region and∆O3/∆t was calculated for the whole winter period. The explained variance
in both studies is about 80%. At the same time 50% of explained variance is higher than the results of Randel et al. (2002) for 35◦–60◦N zonal mean∆O3/∆t where the
15
explained variance is typically less than 50%. Hence our results correspond with the previous results according to the chosen latitude belt (50◦–60◦N). The absence of total ozone data at high latitudes during the polar night does not allow the same relationship for polar ozone month by month through winter to be examined.
Acknowledgements. The authors thank the TOMS science team (NASA/GSFC), ECMWF and
20
CPC for providing data. The work of G. Nikulin is supported by the Swedish Research Council. The work of A. Karpechko is supported by the EU Commission under the project CANDIDOZ.
References
Andrews, D. G., Holton, J. R., and Leovy C. B.: Middle Atmosphere Dynamics, Academic Press, 489, 1987.
25
Brasseur, G. and Solomon, S.: Aeronomy of the middle atmosphere, D. Reidel Publishing Company, 441, 1986.
ACPD
5, 4223–4256, 2005
Mean circulation and ozone buildup G. Nikulin and A. Karpechko Title Page Abstract Introduction Conclusions References Tables Figures J I J I Back Close
Full Screen / Esc
Print Version Interactive Discussion
EGU
Brewer, A. E.: Evidence for a world circulation provided by the measurements of helium and water vapour distribution in the stratosphere, Q. J. Roy. Meteorol. Soc., 75, 351–363, 1949. Dobson, G. M. B.: Origin of distribution of the polyatomic molecules in the atmosphere, Proc.
Roy. Soc. London, 236A, 187–193, 1956.
Dunkerton, T.: On the mean meridional mass motions of the stratosphere and mesosphere, J. 5
Atmos. Sci., 35, 2325–2333, 1978.
Eluszkiewicz, J., Crisp, D., Zurek, R., Elson, L., Fishbein, E., Froidevaux, L., Waters, J., Grainger, R. G., Lambert, A., Harwood, R., and Peckham, G.: Residual circulation in the stratosphere and lower mesosphere as diagnosed from Microwave Limb Sounder data, J. Atmos. Sci., 53, 217–240, 1996.
10
Eluszkiewicz, J., Crisp, D., Grainger, R. G., Lambert, A., Roche, A. E., Kumer, J. B., and Mergenthaler, J. L.: Sensitivity of the residual circulation diagnosed from the UARS data to the uncertainties in the input fields and to the inclusion of aerosols, J. Atmos. Sci., 54, 1739–1757, 1997.
Fioletov, V. E. and Shepherd, T. G.: Seasonal persistence of midlatitude total ozone anomalies, 15
Geophys. Res. Lett., 30(7), 1417, doi:10.1029/2002GL016739, 2003.
Fusco, A. C. and Salby, M. L.: Interannual variations of total ozone and their relationship to variations of planetary wave activity, J. Climate, 12, 1619–1629, 1999.
Geller, M. A., Nash, E. R., Wu, M. F., and Rosenfield, J. E.: Residual circulations calculated from satellite data: their relations to observed temperature and ozone distributions, J. Atmos. 20
Sci., 49, 1127–1137, 1992.
Gille, J. C., Lyjak, L. W., and Smith, A. K.: The global residual mean circulation in the middle atmosphere for the Northern winter period, J. Atmos. Sci., 44, 1437–1454, 1987.
Hadjinicolaou, P. and Pyle, J. A.: The impact of Arctic ozone depletion on northern middle latitudes: interannual variability and dynamical control, J. Atmos. Chem., 47, 25–43, 2004. 25
Holton, J. R., Haynes, P. H., McIntyre, M. E., Douglass, A. R., Rood, R. B., and Pfister, L.: Stratosphere-troposphere exchange, Rev. Geophys., 33, 403–439, 1995.
Hood, L. L. and Zaff, D. A.: Lower stratospheric stationary waves and the longitude dependence of ozone trends in winter, J. Geophys. Res., 100, 25 791–25 800, 1995.
Karpetchko, A. and Nikulin, G.: Influence of early winter upward wave activity flux on midwinter 30
circulation in the stratosphere and troposphere, J. Climate, 17, 4443–4452, 2004.
Kurzeja, R. J.: Spatial variability of total ozone at high latitudes in winter, J. Atmos. Sci., 41, 695–697, 1984.
ACPD
5, 4223–4256, 2005
Mean circulation and ozone buildup G. Nikulin and A. Karpechko Title Page Abstract Introduction Conclusions References Tables Figures J I J I Back Close
Full Screen / Esc
Print Version Interactive Discussion
EGU
Murgatroyd, R. J. and Singleton, F.: Possible meridional circulations in the stratosphere and mesosphere, Q. J. Roy. Meteorol. Soc., 87, 125–135, 1961.
Nagatani, R. M. and Miller, A. J.: The influence of lower stratosphere forcing on the October Antarctic ozone decrease, Geophys. Res. Lett., 14, 202–205, 1987.
Newman, P. A. and Rosenfield, J. E.: Stratospheric thermal damping times, Geophys. Res. 5
Lett., 24, 433–436, 1997.
Newman, P. A. and Nash, E. R.: Quantifying the wave driving of the stratosphere, J. Geophys. Res., 105, 12 485–12 497, 2000.
Newman, P. A., Nash, E. R., and Rosenfield, J. E.: What controls the temperature of the Arctic stratosphere during the spring?, J. Geophys. Res., 106, 19 999–20 010, 2001.
10
Olaguer, E. P., Yang, H., and Tung, K. K.: A reexamination of the radiative balance of the stratosphere, J. Atmos. Sci., 49, 1242–1263, 1992.
Plumb, R. A. and Eluszkiewicz, J.: The Brewer-Dobson circulation: dynamics of the tropical upwelling, J. Atmos. Sci., 56, 868–890, 1999.
Randel, W. J.: Global variation of zonal mean ozone during stratospheric warming events, J. 15
Atmos. Sci., 50, 3308–3321, 1993.
Randel, W. J., Wu, F., and Stolarski, R.: Changes in column ozone correlated with the strato-spheric EP flux, J. Meteorol. Soc. Japan, 80, 849–862, 2002a.
Randel, W. J., Garcia, R. R., and Wu, F.: Time-dependent upwelling in the tropical lower strato-sphere estimated from the zonal-mean momentum budget, J. Atmos. Sci., 59, 2141–2152, 20
2002b.
Salby, M. L. and Callaghan, P. F.: Interannual changes of the stratospheric circulation: relation-ship to ozone and tropospheric structure, J. Climate, 15, 3673–3685, 2002.
Shine, K.: The middle atmosphere in the absence of dynamical heat fluxes, Q. J. Roy. Meteorol. Soc., 113, 603–633, 1987.
25
Shine, K.: Sources and sinks of zonal momentum in the middle atmosphere diagnosed using the diabatic circulation, Q. J. Roy. Meteorol. Soc., 115, 265–292, 1989.
Solomon, S., Kiehl, J. T., Garcia, R. R., and Grose, W.: Tracer transport by the diabatic circula-tion deduced from satellite observacircula-tions, J. Atmos. Sci., 43, 1603–1617, 1986.
SPARC: SPARC intercomparison of middle-atmosphere climatologies, SPARC Rep.3, 96, 30
2002.
Weber, M., Dhomse, S., Wittrock, F., Richter, A., Sinnhuber, B.-M., and Burrows, J. P.: Dynam-ical control of NH and SH winter/spring total ozone from GOME observations in 1995–2002,
ACPD
5, 4223–4256, 2005
Mean circulation and ozone buildup G. Nikulin and A. Karpechko Title Page Abstract Introduction Conclusions References Tables Figures J I J I Back Close
Full Screen / Esc
Print Version Interactive Discussion
EGU
ACPD
5, 4223–4256, 2005
Mean circulation and ozone buildup G. Nikulin and A. Karpechko Title Page Abstract Introduction Conclusions References Tables Figures J I J I Back Close
Full Screen / Esc
Print Version Interactive Discussion
EGU Table 1. Linear trends (DU/month decade) and confidence levels (%) in zonal mean∆O3/∆t
(50◦–60◦N) during 1980–2002.
Season Trend Conf. level
November 0.3 11.8 December 4.5 94.5 January –4.9 86.1 February –3.6 86.8 March –3.0 69.3 Nov.–Dec. 4.8 91.0 Jan.–Feb. -8.5 96.6 Jan.–Mar. –11.5 99.4 Nov.–Mar. –6.7 83.5
ACPD
5, 4223–4256, 2005
Mean circulation and ozone buildup G. Nikulin and A. Karpechko Title Page Abstract Introduction Conclusions References Tables Figures J I J I Back Close
Full Screen / Esc
Print Version Interactive Discussion EGU 1980 1985 1990 1995 2000 60 80 100 120 NOV-MAR 1980 1985 1990 1995 2000 Year 0 20 40 60 ∆ O3 / ∆ t
OCT NOV DEC JAN FEB MAR
a)
b)
Fig. 1. Time series of zonal mean ∆O3/∆t averaged over 50◦–60◦N (a) for whole winter
ACPD
5, 4223–4256, 2005
Mean circulation and ozone buildup G. Nikulin and A. Karpechko Title Page Abstract Introduction Conclusions References Tables Figures J I J I Back Close
Full Screen / Esc
Print Version Interactive Discussion EGU October -12 -8 -8 -8 -8 -4 -4 0 0 48 12 16 20 a) December 0 6 6 6 12 12 12 18 18 18 24 24 30 b) March 0 4 4 8 8 8 8 8 12 12 16 16 c) October -12 -8 -8 -8 -8 -4 -4 0 0 48 12 16 20 a) December 0 6 6 6 12 12 12 18 18 18 24 24 30 b) March 0 4 4 8 8 8 8 8 12 12 12 16 16 c) October -12 -8 -8 -8 -8 -4 -4 0 0 48 12 16 20 a) December 0 6 6 6 12 12 12 18 18 18 24 24 30 b) March 0 4 4 8 8 8 8 8 12 12 12 16 16 c)
Fig. 2. ∆O3/∆t (DU/month) in (a) October, (b) December and (c) March, averaged for
1980–2002. Contour interval is 4 DU/month for (a) and (c), and 6 DU/month for (b). 4248
ACPD
5, 4223–4256, 2005
Mean circulation and ozone buildup G. Nikulin and A. Karpechko Title Page Abstract Introduction Conclusions References Tables Figures J I J I Back Close
Full Screen / Esc
Print Version Interactive Discussion EGU 1000 500 300 100 50 30 10 7 5 3 2 1 Pressure, hPa November -0.2 -0.2 0.0 0.0 0.0 0.0 0.0 0.0 0.2 0.2 0.2 0.2 0.4 0.4 0.6 a) December -0.2 -0.2 0.0 0.0 0.0 0.0 0.0 0.2 0.2 0.2 b) 0 30 60 90 Latitude, o N 1000 500 300 100 50 30 10 7 5 3 2 1 Pressure, hPa January 0.0 0.0 0.0 0.0 0.0 0.0 0.2 0.2 0.2 0.2 0.2 0.4 c) 0 30 60 90 Latitude, o N March 0.0 0.0 0.0 0.0 0.2 0.2 0.2 0.2 0.4 0.4 0.6 d)
Fig. 3. Correlation between∆O3/∆t (50◦–60◦N) and HF in(a) November, (b) December, (c)
January and(d) March. HF is averaged from 15th of previous month to 15th of given month.
Positive contour values are solid, negative values are dotted and zero contours are dashed. The first and second white lines are the 95% and 99% confidence levels. Contour interval is 0.1.
ACPD
5, 4223–4256, 2005
Mean circulation and ozone buildup G. Nikulin and A. Karpechko Title Page Abstract Introduction Conclusions References Tables Figures J I J I Back Close
Full Screen / Esc
Print Version Interactive Discussion EGU -90 -60 -30 0 30 60 90 Latitude 100 50 30 20 10 7 5 3 2 1 Pressure, hPa -0.5 -0.2 -0.2 -0.2 0.0 0.0 0.0 0.0 0.2 0.2 0.5 1.0 1.5 a) V* [m/s] -90 -60 -30 0 30 60 90 Latitude -2.0 -1.0 -0.5 -0.5 0.0 0.0 0.0 0.5 0.5 0.5 1.0 1.0 2.0 b) W* [mm/s]
Fig. 4. The January (a) ¯v∗ and(b) ¯w∗ averaged for 1980–2002. Contours are: 0, ±0.2, ±0.5, ±1.0, ±1.5 m s−1for (a), and 0, ±0.5, ±1.0, later increased by 1.0 mm s−1for (b).
ACPD
5, 4223–4256, 2005
Mean circulation and ozone buildup G. Nikulin and A. Karpechko Title Page Abstract Introduction Conclusions References Tables Figures J I J I Back Close
Full Screen / Esc
Print Version Interactive Discussion EGU -30 0 30 60 90 Latitude 100 50 30 20 10 7 5 3 2 1 Pressure, hPa November -0.6 -0.4 -0.2 -0.2 0.0 0.0 0.0 0.0 0.0 0.2 0.2 0.2 0.2 0.2 a) -30 0 30 60 90 Latitude January -0.8 -0.6 -0.4 -0.2 0.0 0.0 0.2 0.2 0.2 0.2 0.2 0.4 0.4 0.4 b)
Fig. 5. Correlation between HF (45◦–75◦N, 100 hPa) and ¯w∗in(a) November and (b) January.
HF and ¯w∗ are averaged from 15th of previous month to 15th of given month. Contours and shading as in Fig. 3.
ACPD
5, 4223–4256, 2005
Mean circulation and ozone buildup G. Nikulin and A. Karpechko Title Page Abstract Introduction Conclusions References Tables Figures J I J I Back Close
Full Screen / Esc
Print Version Interactive Discussion EGU -30 0 30 60 90 Latitude 1000 500 300 100 50 30 10 7 5 3 2 1 Pressure, hPa November -0.2 -0.2 0.0 0.0 0.0 0.0 0.0 0.0 0.2 0.2 0.4 0.4 0.6 a) -30 0 30 60 90 Latitude January -0.6 -0.4 -0.2 0.0 0.0 0.0 0.0 0.2 0.2 0.2 0.4 0.6 0.8 b)
Fig. 6. Correlation between HF (45◦–75◦N, 100 hPa) and ∆T/∆t in (a) November and
(b) January. HF and∆T/∆t are averaged from 15th of previous month to 15th of given month.
ACPD
5, 4223–4256, 2005
Mean circulation and ozone buildup G. Nikulin and A. Karpechko Title Page Abstract Introduction Conclusions References Tables Figures J I J I Back Close
Full Screen / Esc
Print Version Interactive Discussion EGU -30 0 30 60 90 Latitude 100 50 30 20 10 7 5 3 2 1 Pressure, hPa November 0.0 0.0 0.0 0.0 0.2 0.4 0.6 a) -30 0 30 60 90 Latitude January 0.0 0.0 0.0 0.2 0.2 0.2 0.2 0.2 0.4 0.4 0.4 0.6 b)
ACPD
5, 4223–4256, 2005
Mean circulation and ozone buildup G. Nikulin and A. Karpechko Title Page Abstract Introduction Conclusions References Tables Figures J I J I Back Close
Full Screen / Esc
Print Version Interactive Discussion EGU 100 50 30 20 10 7 5 3 2 1 Pressure, hPa November -0.4 -0.2 -0.2 -0.2 -0.2 0.0 0.0 0.0 0.0 0.0 0.2 0.2 0.2 0.2 0.2 a) December -0.4 -0.2 -0.2 0.0 0.0 0.0 0.0 0.0 0.2 0.2 0.2 0.2 0.2 b) -30 0 30 60 90 Latitude 100 50 30 20 10 7 5 3 2 1 Pressure, hPa January -0.6 -0.4 -0.2 -0.2 -0.2 0.0 0.00.2 0.2 0.4 0.4 c) -30 0 30 60 90 Latitude March -0.6 -0.4 -0.4 -0.2 -0.2 -0.2 0.0 0.0 0.2 0.2 0.2 0.2 0.4 0.4 0.4 d)
Fig. 8. Correlation between ∆O3/∆t (50◦–60◦N) and ¯w∗ in (a) November, (b) December, (c) January and (d) March. ¯w∗is averaged from 20th of previous month to 20th of given month. Contours and shading as in Fig. 3.
ACPD
5, 4223–4256, 2005
Mean circulation and ozone buildup G. Nikulin and A. Karpechko Title Page Abstract Introduction Conclusions References Tables Figures J I J I Back Close
Full Screen / Esc
Print Version Interactive Discussion EGU -30 0 30 60 90 Latitude 100 50 30 20 10 7 5 3 2 1 Pressure, hPa November -0.2 -0.2 0.0 0.0 0.0 0.0 0.2 0.2 0.2 0.2 0.4 0.4 0.4 a) -30 0 30 60 90 Latitude January -0.2 -0.2 0.0 0.0 0.0 0.0 0.0 0.0 0.0 0.2 0.2 0.4 b)
Fig. 9. Correlation between∆O3/∆t (50◦–60◦N) and ¯v∗ in(a) November and (b) January. ¯v∗
is averaged from 20th of previous month to 20th of given month. Contours and shading as in Fig. 3.