HAL Id: hal-00302395
https://hal.archives-ouvertes.fr/hal-00302395
Submitted on 10 Jan 2007HAL is a multi-disciplinary open access
archive for the deposit and dissemination of sci-entific research documents, whether they are pub-lished or not. The documents may come from teaching and research institutions in France or abroad, or from public or private research centers.
L’archive ouverte pluridisciplinaire HAL, est destinée au dépôt et à la diffusion de documents scientifiques de niveau recherche, publiés ou non, émanant des établissements d’enseignement et de recherche français ou étrangers, des laboratoires publics ou privés.
Middle atmosphere water vapour and dynamical
features in aircraft measurements and ECMWF analyses
D. G. Feist, A. J. Geer, S. Müller, N. Kämpfer
To cite this version:
D. G. Feist, A. J. Geer, S. Müller, N. Kämpfer. Middle atmosphere water vapour and dynamical features in aircraft measurements and ECMWF analyses. Atmospheric Chemistry and Physics Dis-cussions, European Geosciences Union, 2007, 7 (1), pp.247-287. �hal-00302395�
ACPD
7, 247–287, 2007 Middle atmosphere humidity measurements and ECMWF analyses D. G. Feist et al. Title Page Abstract Introduction Conclusions References Tables Figures ◭ ◮ ◭ ◮ Back CloseFull Screen / Esc
Printer-friendly Version Interactive Discussion
Atmos. Chem. Phys. Discuss., 7, 247–287, 2007 www.atmos-chem-phys-discuss.net/7/247/2007/ © Author(s) 2007. This work is licensed
under a Creative Commons License.
Atmospheric Chemistry and Physics Discussions
Middle atmosphere water vapour and
dynamical features in aircraft
measurements and ECMWF analyses
D. G. Feist1,*, A. J. Geer2,**, S. M ¨uller1, and N. K ¨ampfer1
1
Institute of Applied Physics, University of Bern, Switzerland
2
Data Assimilation Research Centre, University of Reading, UK
*
now at: Max-Planck-Institute for Biogeochemistry, Jena, Germany
**
now at: European Centre for Medium-Range Weather Forecasts (ECMWF), Reading, UK Received: 20 November 2006 – Accepted: 14 December 2006 – Published: 10 January 2007 Correspondence to: D. G. Feist ([email protected])
ACPD
7, 247–287, 2007 Middle atmosphere humidity measurements and ECMWF analyses D. G. Feist et al. Title Page Abstract Introduction Conclusions References Tables Figures ◭ ◮ ◭ ◮ Back CloseFull Screen / Esc
Printer-friendly Version Interactive Discussion
Abstract
The European Centre for Medium-Range Weather Forecasts (ECMWF) provides global analyses of atmospheric humidity from the ground to the lower mesosphere. Unlike in the troposphere, in the stratopshere no humidity observations are assimilated. Hu-midity analyses here are essentially the results of a free-running model constrained
5
by the ECMWF’s well-analysed wind fields. So far only the broad-scale features of the resulting stratospheric water vapour distribution have been validated. This study provides the first in-depth comparison of stratospheric humidity from ECMWF with ob-servations from an airborne microwave radiometer that has measured the distribution of stratospheric water vapour over an altitude range of roughly 15–60 km on several
10
flight campaigns since 1998. The aircraft measurements provide a horizontal reso-lution that cannot be achieved by current satellite instruments. This study examines dynamical features in the moisture fields such as filamentation and the vortex edge, finding that features in the ERA-40 humidity analyses often do correspond to real at-mospheric events that are seen in the aircraft measurements. However, the
compar-15
isons also show that in general the ECMWF model produces an unrealistically moist mesosphere. As a result it cannot replicate the descent of relatively dry mesospheric air into the polar vortex in winter and spring.
1 Introduction
Stratospheric water vapour and its variability over time has been an issue of continuous
20
scientific interest ever sinceBrewer(1949) explained the dryness of the stratosphere. He proposed that air is dehydrated as it enters the stratosphere through the very low temperatures at the tropical tropopause. Stratospheric H2O entry values in the tropics can now be simulated with good accuracy from synoptic-scale velocity and temperature fields (Fueglistaler et al.,2005). Seasonal variability in tropopause temperature causes
25
ACPD
7, 247–287, 2007 Middle atmosphere humidity measurements and ECMWF analyses D. G. Feist et al. Title Page Abstract Introduction Conclusions References Tables Figures ◭ ◮ ◭ ◮ Back CloseFull Screen / Esc
Printer-friendly Version Interactive Discussion
are transported upwards and polewards in the stratospheric Brewer-Dobson circulation (e.g. Plumb,2002). The gradual upward progress of these anomalies, over a period of several years, is known as the tape-recorder effect (Mote et al.,1995). Interannual variability in the amount of water vapour entering the stratosphere can be explained with tropical tropopause temperature anomalies (Randel et al.,2004b).
5
In the wintertime polar vortex, in the lower stratosphere, low temperatures can cause rapid dehydration associated with the formation of Polar Stratospheric Clouds (PSCs). Outside these areas, water vapour is a long-lived tracer in the stratosphere; water vapour amounts are increased through methane oxidation, with a timescale of years in the lower stratosphere and ∼100 days near the stratopause (Le Texier et al.,1988).
10
In the mesosphere, water vapour is lost through photolysis. During winter, dry air from the mesosphere descends into the stratosphere through the polar vortex, as modelled byLe Texier et al.(1988) and observed by e.g.Aellig et al.(1996);Plumb et al.(2002); Engel et al.(2006).
Observations of stratospheric H2O are limited in time and space and there are large
15
biases between different instruments (Kley et al.,2000). This study investigates strato-spheric H2O profiles derived from measurements of the airborne microwave radiometer AMSOS (Airborne Microwave Stratospheric Observing System). Given the very lo-calised nature of the AMSOS observations, it is particularly difficult to find collocations with independent data sources. Instead we compare AMSOS to the H2O and
dynam-20
ical fields from the ECMWF (European Centre for Medium Range Weather Forecasts) analyses. We compare to ERA-40 (Uppala et al.,2005) reanalyses in the years up to 2001, and to the operational analyses for 2002.
The AMSOS instrument has covered large parts of the northern hemisphere onboard a Learjet 35 A of the Swiss Air Force during yearly campaigns since 1998. It follows
25
in the footsteps of earlier measurements with an older instrument on the same aircraft by Peter (1998). The data set for this analysis covered five missions from 1998 to 2002. AMSOS measures the H2O distribution from the flight altitude up to about 60 km, thus providing a 2-D cut through the atmosphere with very good horizontal resolution.
ACPD
7, 247–287, 2007 Middle atmosphere humidity measurements and ECMWF analyses D. G. Feist et al. Title Page Abstract Introduction Conclusions References Tables Figures ◭ ◮ ◭ ◮ Back CloseFull Screen / Esc
Printer-friendly Version Interactive Discussion
Such a unique view of the atmosphere cannot easily be produced by other methods, especially not by most satellite instruments.
In the ECMWF system, no water vapour observations are assimilated in the strato-sphere. Hence the water vapour field is largely determined by input from the tropo-sphere, modelled stratospheric transport and methane oxidation in the stratotropo-sphere,
5
and water vapour photolysis in the mesosphere (Dethof,2003).Simmons et al.(1999) examined a development version of the ERA-40 system, finding a broadly realistic dis-tribution of water vapour in the stratosphere. Oikonomou and O’Neill(2006) compared analysed ERA-40 humidities to observations from the Upper Atmosphere Research Satellite (UARS) and to aircraft measurements. ERA-40 specific humidities were found
10
to be too low by 10–20% in the mid- and upper-stratosphere (50 hPa upwards). An-other problem in the ERA-40 humidities is the representation of the tape recorder sig-nal; Oikonomou and O’Neill (2006) showed that ERA-40 transports the signal far too rapidly in the stratosphere, with mean ascent rates over the tropics of 0.5×10⁻³m/s
compared to observed values of 0.2–0.4×10⁻³m/s. Equivalently, the Brewer-Dobson 15
circulation is too fast. ECMWF stratospheric humidities have otherwise seen little val-idation though operational moisture analyses were useful in illustrating the dynamical evolution of the remarkable 2002 SH vortex split and showed many similarities with the PV fields (Simmons et al.,2005).
Here we investigate stratospheric humidities in the ECMWF system by comparison
20
to the very high horizontal resolution measurements of AMSOS. In reverse, we can use ECMWF dynamical and moisture fields to investigate the geophysical reality of the AM-SOS data at horizontal resolutions in the range of 50–100 km which are not available from any other observation type. Of particular interest are the sharp gradients in the water vapour field at the boundaries between the vortex and the surf-zone, between
25
the surf-zone and the tropical pipe (seePlumb,2002, for the terminology), and where very different air masses are brought into close proximity through filamentation.
ACPD
7, 247–287, 2007 Middle atmosphere humidity measurements and ECMWF analyses D. G. Feist et al. Title Page Abstract Introduction Conclusions References Tables Figures ◭ ◮ ◭ ◮ Back CloseFull Screen / Esc
Printer-friendly Version Interactive Discussion
2 ECMWF analyses
We examine analyses from two different versions of the ECMWF system, which is extensively documented at http://www.ecmwf.int/research/ifsdocs/. For comparisons from 1998 to 2001, ERA-40 re-analyses (Uppala et al.,2005) are used. For compar-isons in 2002, operational analyses are used. In ERA-40, observations are assimilated
5
using three-dimensional variational (3D-Var) data assimilation, and in the operational analyses, four-dimensional variational (4D-Var) data assimilation. In both cases, the assimilating model has 60 levels in the vertical, extending to 0.1 hPa. The horizontal resolution is T159 in ERA-40 and T511 in the operational analyses. Apart from one difference noted below, stratospheric water vapour is treated in the same way in both
10
ECMWF variants. 2.1 Dynamical fields
In the stratosphere in the ECMWF analyses, temperature information comes primarily from satellite observations. The ERA-40 stratospheric analyses show a reasonable description of dynamical features such as major warmings, but there are a few known
15
problems, especially in the pre-1979 era (Uppala et al., 2005). Problems that affect the time period studied are are an unrealistic oscillatory temperature structure in the vertical in polar regions (Randel et al.,2004a), and the excessively fast Brewer-Dobson circulation (Oikonomou and O’Neill,2006).
In this paper we have obtained ECMWF temperature, pressure, geopotential height
20
and wind fields. From the wind and temperature fields we have derived Ertel’s poten-tial vorticity, which is not archived at levels above 850 K. From the ECMWF potenpoten-tial vorticity we derived equivalent latitude using the technique outlined in the introduction ofAllen and Nakamura (2003), though note we did not use the PV-like tracer method described in the bulk of that paper.
ACPD
7, 247–287, 2007 Middle atmosphere humidity measurements and ECMWF analyses D. G. Feist et al. Title Page Abstract Introduction Conclusions References Tables Figures ◭ ◮ ◭ ◮ Back CloseFull Screen / Esc
Printer-friendly Version Interactive Discussion
2.2 Stratospheric water vapour
In the ECMWF analyses, water vapour observations are not assimilated in the strato-sphere. Instead, water vapour increments are forced to be zero above a diagnosed model tropopause. The model removes any supersaturation of water vapour, which is important in the cold temperatures of the lower stratosphere in the wintertime polar
5
vortices, and at the tropical tropopause.
Methane oxidation and the photolysis of H2O are parametrised by changing specific humidity,q, at a rate, R, set by:
R = k1(Q − q) − k2q. (1)
The first term describes methane oxidation as a relaxation towards a fixed specific
10
humidityQ, based on the observation that the sum of mixing ratios 2[CH4] + [H2O] is observed to be approximately conserved over much of the stratosphere (e.g.Randel et al., 1998), and by assuming the rate of conversion from methane to water vapour is proportional to the amount of methane. The rate coefficient k1 is zero at 100 hPa and below, and increases towards the mesosphere, where at 0.5 hPa it corresponds to
15
a time constant of 100 days. The second term accounts for photolysis of H2O in the mesosphere, where q decreases at a rate set byk2, which is zero at all levels below 0.2 hPa. It is important to note that the value ofQ was set to 6 ppmv in ERA-40, and
to 6.8 ppmv in the operational analyses. This was intended to increase, and hence improve, upper stratospheric humidities. It was introduced as a result of comparing the
20
first few years of ERA-40 analyses (done in a production stream that started in 1989) with the UARS climatology ofRandel et al.(1998). This new value has been used in the operational analyses since April 2002 (A. Simmons, personal communication, and Uppala et al.,2005, pages 2998–2999).
ACPD
7, 247–287, 2007 Middle atmosphere humidity measurements and ECMWF analyses D. G. Feist et al. Title Page Abstract Introduction Conclusions References Tables Figures ◭ ◮ ◭ ◮ Back CloseFull Screen / Esc
Printer-friendly Version Interactive Discussion
2.3 Long-term stability of ECMWF humidities
Before comparing ECMWF humidities against AMSOS retrievals from 1998 to 2002, it is interesting to examine the long-term stability of the analyses, and especially to look for any discontinuity between ERA-40 and the operational analyses. Interannual variability in data assimilation systems can arise simply from changes in the number,
5
type, or calibration of observations used (e.g.Bengtsson et al.,2004), as well as from more obvious mechanisms such as changes in the model or data assimilation system, such as there is between ERA-40 and the operational analyses.
Figure 1 shows humidity anomalies in the tropical stratosphere from the ECMWF analyses. Humidity anomalies have been calculated with respect to the mean
sea-10
sonal cycle of the ERA-40 analyses for the period 1990 to 2002. There are clear interannual variations, with the analyses moister than usual between 1998 and 2000 at 100 hPa. The anomalies appear to propagate upward, as would be expected in the as-cending branch of the Brewer-Dobson circulation. Figure1can be compared to Fig. 2 ofRandel et al.(2004b), which shows water vapour anomalies calculated from HALOE
15
data. Both datasets show interannual variability of a similar magnitude. However, the anomalies propagate to the upper stratosphere with about two years’ time lag in the HALOE observations, but only a year in the ECMWF analyses, illustrating the exces-sively fast Brewer-Dobson circulation in ERA-40. Between 1992 and 1998 there are large discrepancies between the interannual variability seen in the HALOE and
ERA-20
40 datasets, but after this, there is broad agreement: higher than normal humidities in the lower stratosphere from 1998 to 2001, and lower than normal afterwards.
From January 2002 onwards, Fig. 1 shows operational ECMWF humidity anoma-lies, but they are still calculated as departures from the 1990 to 2002 mean ERA-40 seasonal cycle. The operational analyses are dryer in the mid and lower stratosphere,
25
particularly in the moist phase of the tape recorder (at 100 hPa, roughly July to Oc-tober). In the upper stratosphere, the analyses are moister, due to a change in the methane oxidation parameterisation. The relaxation value in Eq. (1) was increased
ACPD
7, 247–287, 2007 Middle atmosphere humidity measurements and ECMWF analyses D. G. Feist et al. Title Page Abstract Introduction Conclusions References Tables Figures ◭ ◮ ◭ ◮ Back CloseFull Screen / Esc
Printer-friendly Version Interactive Discussion
from 6 to 6.8 ppmv in April 2002 and there is a clear spin-up in upper-stratospheric humidities over the following year, consistent with the ∼100 day chemical timescale in the parametrisation at these levels.
Figure2is similar to Fig.1but for the north pole. It appears that the moist anomalies seen at the equatorial tropopause between 1998 and 2000 have propagated as far as
5
the north pole with a timescale of about a year. However, none of the other anomalies seen in the ERA-40 data in Fig.1 appear to propagate to the north pole. The opera-tional analyses after January 2002 are dryer in the lower stratosphere and moister in the upper stratosphere, similar to the behaviour in the tropics. In the following com-parisons, we should clearly expect to treat the ERA-40 analyses and the post-2002
10
operational analyses as two separate datasets with somewhat different properties.
3 AMSOS observations
The microwave radiometer AMSOS observes spectral emissions of atmospheric water vapour near 183.3 GHz from an aircraft. Details of the instrument are given byVasi´c et al. (2005). From the spectra, altitude profiles of water vapour volume mixing ratio
15
over an altitude range of roughly 15–60 km were retrieved along the flight track. In our preparatory work for this study, we compared AMSOS version 1 retrievals to ECMWF analyses and UARS climatology. Those comparisons revealed a number of artifacts in the retrievals. The most obvious was that the AMSOS humidities were typi-cally 20% drier than ECMWF and the UARS climatology. The retrievals also contained
20
sections in which the data appeared unphysical (for example, the usual vertical gradient in stratospheric moisture was reversed). Such artifacts were perhaps to be expected given the difficulty of finding collocated observational data to verify such an instrument. Knowing which atmospheric features were likely to be realistic (because they appeared in the ECMWF data) helped to identify the conditions under which recorded spectra
25
were unusable. We found that such artifacts were due to drift effects and sudden changes in the operating conditions of the instrument. In spring 2006 the whole
AM-ACPD
7, 247–287, 2007 Middle atmosphere humidity measurements and ECMWF analyses D. G. Feist et al. Title Page Abstract Introduction Conclusions References Tables Figures ◭ ◮ ◭ ◮ Back CloseFull Screen / Esc
Printer-friendly Version Interactive Discussion
SOS dataset was reprocessed, weeding out these unusable spectra and at the same time integrating more spectra that were measured under very similar conditions. The retrieval algorithm was also improved. The reprocessed data is known as version 2; we use it throughout this study. The data quality in version 2 has improved significantly. AMSOS version 2 uses the software packages ARTS (Buehler et al., 2005) and
5
QPack (Eriksson et al.,2005) to retrieve water vapour profiles from the measured spec-tra with the Optimal Estimation Method (Rodgers, 2000). The a priori profile and the covariance matrix that is required by this retrieval method was derived from the humid-ity climatology data of the ERA-40 data set. The same a priori information was used for all profiles to avoid time or latitude-dependent influences on the retrieved profiles.
Ex-10
ternal retrieval parameters like temperature and pressure profiles along the flight track were taken from ECMWF analysis data on model levels. Above the ECMWF model top (0.1 hPa), the CIRA-86 climatology (Fleming et al.,1990) was used instead.
Compared to the AMSOS version 1 profiles which have been used in earlier studies (Morland et al., 2006; Vasi´c et al., 2005), the new version 2 provides roughly four
15
times as many retrieved profiles over the same flight distance due to the more efficient integration scheme. It also suffers less from instrumental artifacts in the lower retrieval layers. However, the individual profiles have become slightly noisier as a result of the reduced integration time and less regularization in the retrieval.
The vertical resolution of such retrieved profiles is typically low because the vertical
20
profiles are smoothed with averaging kernels that have typical widths in the range of 8– 10 km. The horizontal resolution is in the order of 50 km and depends on the distance and the course that the aircraft travels during the integration time.
Since 1998, the AMSOS instrument has taken part in yearly campaigns with a Learjet of the Swiss Air Force. A typical campaign took about one week and covered large
25
parts of the northern hemisphere. Most AMSOS missions were coordinated with other European aircraft or balloon campaigns. Table1shows the time frame, latitude range and partner campaigns of the individual AMSOS missions that were used for this study.
ACPD
7, 247–287, 2007 Middle atmosphere humidity measurements and ECMWF analyses D. G. Feist et al. Title Page Abstract Introduction Conclusions References Tables Figures ◭ ◮ ◭ ◮ Back CloseFull Screen / Esc
Printer-friendly Version Interactive Discussion
4 UARS climatology
The object of this comparison is to understand the strengths and weaknesses of both ECMWF and AMSOS humidities. Hence neither can or should be treated as the “truth” to which the other is being compared. To help understand differences between the datasets, we take the climatology ofRandel et al.(1998) as an independent estimate
5
of the stratospheric water vapour distribution.
Randel and coworkers binned water vapour retrievals from HALOE on UARS by equivalent latitude and pressure level and constructed a seasonal climatology from this using harmonic regression analysis. Water vapour observations from MLS, also on UARS, were used to fill gaps in HALOE coverage at polar latitudes in winter. We
10
use the version of this climatology available from the SPARC data centre at http:// www.sparc.sunysb.edu/html/uars index.html, based on the years 1991 to 1999, hence incorporating 2 more years’ data than was available when Randel et al. (1998) was written.
The UARS climatology was mapped to AMSOS observation locations using the
15
ECMWF analyses. In the vertical, this was done using ECMWF temperatures and pressures, and in the horizontal, using PV equivalent latitude derived from the analy-ses (see Sect. 2.1). Climatological monthly means were treated as representing the 15th day of the month, and were interpolated in time to the AMSOS dates.
5 Detailed comparisons of AMSOS and ECMWF data
20
Figure 3 shows all AMSOS retrievals from mission 3 (March 2000) ordered by mea-surement time. It also shows ECMWF analysed humidities interpolated to the same positions. The aircraft flew from Switzerland to the North Pole, then south towards the equator, and finally back to Switzerland. Hence the centre-left of the figure (profiles 1 to 420) represents the high latitudes and the polar vortex, and the right of the figure
25
ACPD
7, 247–287, 2007 Middle atmosphere humidity measurements and ECMWF analyses D. G. Feist et al. Title Page Abstract Introduction Conclusions References Tables Figures ◭ ◮ ◭ ◮ Back CloseFull Screen / Esc
Printer-friendly Version Interactive Discussion
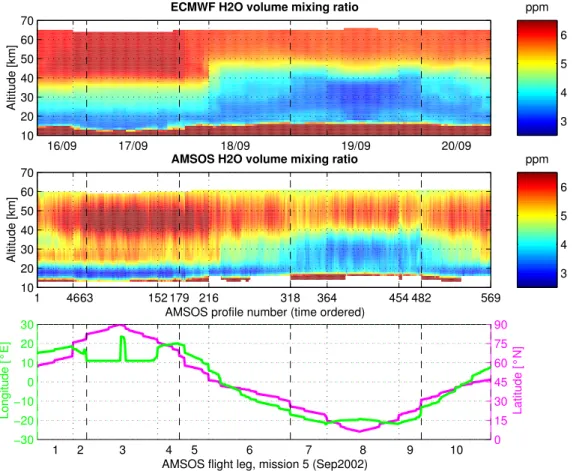
As an example for a typical late summer mission, Fig.4shows ECMWF and AMSOS moisture along the AMSOS flight tracks for mission 5 (September 2002). Profiles 0– 216 were taken in the region of the north pole; 318–482 in the subtropics; the rest of the profiles are representative of the midlatitudes. As before, the largest scale features are similar in both, except for the lack of dry air in the ECMWF mesosphere. Note that,
5
since this is summer, there is no sign of descent of dry air in the upper stratosphere at high latitudes in the AMSOS observations. This special situation will further be discussed in Sect.5.4.
Both datasets show the expected zonal distribution of stratospheric water vapour, which results from the upwards and polewards transport of dry air from the
tropi-10
cal tropopause, with that air, over time, being moistened through methane oxidation. Hence both AMSOS and ECMWF show an increase in humidity from the tropopause to the stratopause, and show lower humidities in the tropics and subtropics compared to the high latitudes. However, only AMSOS shows decreasing humidities above the stratopause. Here, water vapour is removed through photolysis. These levels are very
15
close to the ECMWF model top, and the photolysis term included in the water vapour chemistry parametrisation (Eq. 1) does not appear to be capable of reducing water vapour amounts to those observed by AMSOS.
In the late winter/early spring situation of mission 3 (March 2000), mesospheric air has descended into the wintertime vortex (Fig.3, profiles 64 to 186). AMSOS
obser-20
vations show low humidities characteristic of mesospheric air down to ∼45 km. The ECMWF model has no source of dry mesospheric air, and cannot replicate this phe-nomenon.
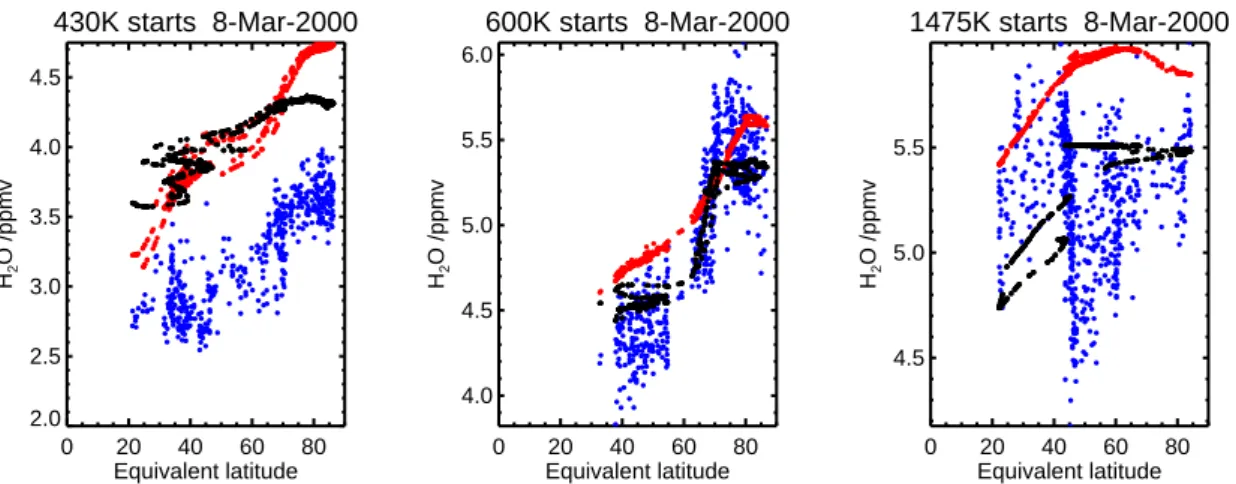
Figure 5 shows AMSOS retrievals for mission 3 (March 2000) on three isentropic levels, mapped to the corresponding ECMWF-derived equivalent latitude. Also shown
25
are the UARS climatology and the ECMWF humidities at the corresponding AMSOS locations. There is a larger scatter in the AMSOS observations than in the other ob-servations. It is likely that some of the scatter in AMSOS reflects true atmospheric variability on horizontal scales smaller than those represented in the analyses, but
ACPD
7, 247–287, 2007 Middle atmosphere humidity measurements and ECMWF analyses D. G. Feist et al. Title Page Abstract Introduction Conclusions References Tables Figures ◭ ◮ ◭ ◮ Back CloseFull Screen / Esc
Printer-friendly Version Interactive Discussion
some variability may be due to instabilities in the measurement system. We do not expect the climatology to represent such scales at all.
At 430 K, all the datasets show higher humidities at high equivalent latitudes than at low equivalent latitudes, but the range of values is much smaller in the ECMWF analyses.
5
At 600 K, there is a clear vortex edge in all three datasets at around 70◦N in equiva-lent latitude. Both ECMWF and AMSOS show a sharp boundary and relatively constant mixing ratios either side of this. The UARS climatology shows a less distinct edge, and mixing ratios that vary continuously with equivalent latitude. This is likely explained by the nature of the UARS climatology, being an average of many years’ behaviour,
com-10
pared to the instantaneous nature of the other two datasets. At 600 K the agreement between AMSOS and ECMWF is extremely good at all latitudes sampled; this holds throughout the mid-stratosphere (475 K to 1000 K, figures not shown).
At 1475 K AMSOS observes low moisture values, which in Sect. 5.1 we associate with mesospheric air that has descended into the stratosphere in the polar vortex. As
15
already noted, this is not represented in ECMWF analyses. The AMSOS observations of dry mesospheric air are, surprisingly, associated with equivalent latitudes of 45◦N to 60◦N, and not the high equivalent latitudes that would be expected of the centre of the vortex. We used ERA-40 PV distributions to map AMSOS observations onto equivalent latitudes. As we explain in Sect. 5.1, the unusual equivalent latitudes assigned to
20
these observations are due to a feature in the ERA-40 PV distributions in the upper stratosphere winter vortex. In that section we also discuss the fact that the UARS climatology shows little sign of dry air at these levels.
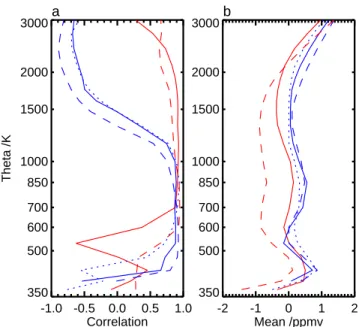
To summarise similar comparisons covering all 5 missions and all levels, (Figs. 6 and7) show the correlation and mean difference between ECMWF and AMSOS and
25
between ECMWF and UARS climatology respectively. For each chosen level and each mission, statistics are calculated from the set of AMSOS, ECMWF and UARS data at AMSOS locations. We chose to summarise the agreement between datasets in terms of the linear (Pearson) correlation coefficient. This statistic is insensitive both to
ACPD
7, 247–287, 2007 Middle atmosphere humidity measurements and ECMWF analyses D. G. Feist et al. Title Page Abstract Introduction Conclusions References Tables Figures ◭ ◮ ◭ ◮ Back CloseFull Screen / Esc
Printer-friendly Version Interactive Discussion
mean differences between datasets, and differences in standard deviations between datasets, a useful property given the obvious discrepancies at some levels in Fig.5. A value of +1 indicates an exact linear dependence between two datasets.
Figure6a shows that AMSOS and ECMWF are reasonably well correlated between 1200 K and 530 K in all missions except the first, which shows particularly poor
corre-5
lations in the lower stratosphere. Above 1200 K, there is good agreement for the sum-mer missions but poor agreement for the winter missions, due to the lack of wintertime descent of mesospheric air in the ECMWF analyses. This poor agreement actually manifests itself as an inverse correlation at these levels: due to the Brewer-Dobson circulation, air at the poles in the ECMWF model will be older than that at the equator,
10
and without a significant drying through photolysis in the model, the methane oxida-tion scheme makes this older, polar air moister. Hence the zonal pattern is completely opposite to that in the AMSOS observations.
At 475 K and below, correlations between AMSOS and ECMWF are in general worse (Fig.6a). This reflects two main problems. First, there are deficiencies in the ERA-40
15
lower stratospheric moisture. For exampleOikonomou and O’Neill(2006) showed that there is excessive transport of moisture through the tropopause in summer; this is par-ticularly obvious in mission 1 (not shown, see supplementary material athttp://www. atmos-chem-phys-discuss.net/7/247/2007/acpd-7-247-2007-supplement.pdf), where ERA-40 has excessively high mixing ratios in the tropical lower stratosphere.
Sec-20
ond, the quality of the AMSOS retrievals declines near the tropopause. Comparing to the ECMWF profiles, Fig.3suggests there is little useful information from AMSOS below ∼18 km.
Figure6b shows that ECMWF humidities are generally within ±0.5 ppmv of the AM-SOS humidities. In 2002, however, the operational analyses are ∼0.8 ppmv lower than
25
AMSOS in the mid stratosphere (600 K to 1500 K). This is indicative of the substantially drier lower and mid stratosphere in the 2002 operational analyses, compared to ERA-40 (Sects.2.3and 5.4). Also, AMSOS retrievals appear to show a vertical oscillation that is quite consistent through all five missions, with humidities too low by ∼1 ppmv at
ACPD
7, 247–287, 2007 Middle atmosphere humidity measurements and ECMWF analyses D. G. Feist et al. Title Page Abstract Introduction Conclusions References Tables Figures ◭ ◮ ◭ ◮ Back CloseFull Screen / Esc
Printer-friendly Version Interactive Discussion
425 K and up to 0.5 ppmv too low at 850 K. This is even evident in Fig.3. Later, we see that this vertical oscillation is a problem with the AMSOS data.
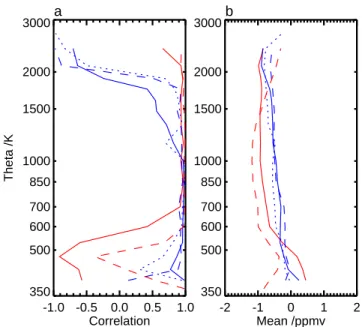
Comparing ECMWF analyses to UARS climatology (Fig.7a) reveals features broadly similar to the comparisons with AMSOS. The best correlations are in the mid and upper stratosphere (530 to 1500 K). Winter correlations are negative above ∼2000 K, where
5
the UARS climatology also shows some sign of lower humidities due to mesospheric descent, and the ECMWF analyses do not. Correlations are relatively poor below 530 K, particularly for the summer missions. This helps confirm that the poor agree-ment between AMSOS and ECMWF in the summer missions in the lower stratosphere (400 K to 600 K), particularly in August 1998, is due to problems with the ECMWF
10
humidities, and not just limitations in the AMSOS retrievals.
Where correlations between ECMWF analyses and UARS climatology are large and positive, they are typically a little larger than the correlations obtained between ECMWF and AMSOS. This is likely because both the ECMWF and UARS climatology vary smoothly with equivalent latitude (Fig.5), in contrast to the noisy distribution of
AM-15
SOS humidities.
ECMWF humidities are of order 0.5 ppmv lower than UARS climatology (Fig. 7b), with the largest differences at the time of the 2002 missions, again reflecting differences between the 2002 operational analyses and the ERA-40 data examined in other years. However, 2002 does not stand out as much as in the AMSOS comparisons (Fig.6b).
20
That there is no vertical oscillation in the UARS comparisons suggests the oscillation found in the AMSOS comparisons is a problem of the AMSOS data.
The following sections examine some of the differences between ECMWF and AM-SOS in more detail. At a broad scale, above 600 K there is general agreement between AMSOS, ECMWF and UARS expect that the ECMWF analyses do not represent the
25
descent of dry mesospheric air in the winter polar vortex, and the UARS climatology shows only a limited representation of this. ERA-40 analyses also exhibit problems in the lowermost stratosphere (below 530 K), and in particular there is excessive moisture in much of the lower stratosphere (430 K to 600 K) in ERA-40 in August 1998.
ACPD
7, 247–287, 2007 Middle atmosphere humidity measurements and ECMWF analyses D. G. Feist et al. Title Page Abstract Introduction Conclusions References Tables Figures ◭ ◮ ◭ ◮ Back CloseFull Screen / Esc
Printer-friendly Version Interactive Discussion
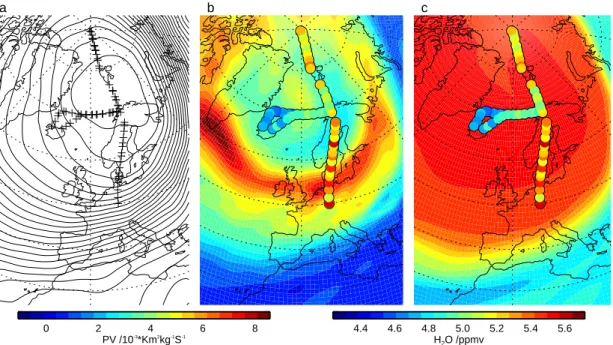
5.1 Mesospheric descent
Here we further examine the descent of mesospheric air in the stratospheric wintertime polar vortex. Plumb et al. (2002) simulated the descent of mesospheric air (strongly diluted with surrounding stratospheric air) to 450 K (or ∼20 km) by the end of the winter. Aellig et al.(1996) observed descent of mesospheric air only to 1850–2000 K (∼50 km)
5
in March 1992. However, in winter/spring 2003, Engel et al. (2006) and Huret et al. (2006) observed a layer of air of mesospheric origin in the northern hemisphere vortex, descending from 30 km (January 2003) to 22 km (March 2003).
Figure 8 shows the meteorological situation in the upper stratosphere during the March 2000 mission, from ECMWF analyses. AMSOS moisture observations from
10
8 March 2000 to 10 March 2000 are superimposed. The geopotential height field at 2 hPa (Fig.8a) shows the polar vortex centred just N of Scandinavia; Fig.8b shows that PV is typically higher inside the vortex than outside. However, PV is lower in the centre of the vortex than it is elsewhere in the vortex. This is in contrast to the usual situation at lower levels (not shown), in which the vortex is defined by its relatively high
15
PV. ,The origin of these low PV values is not clear. If the low PV region had resulted from the transport of mid-latitude air to the vortex centre, there would likely be a similar low patch in the ECMWF water vapour mixing ratios. Instead, perhaps one hypothesis is the known problem of an oscillatory temperature structure in the polar winter/spring stratosphere in ERA-40 (Randel et al., 2004a; Uppala et al., 2005). These low PV
20
values are the reason for the surprisingly low equivalent latitudes of 45◦N to 60◦N assigned to the lowest AMSOS mixing ratios at 1475 K in Fig.5c.
In the ECMWF moisture field, the vortex is clearly marked by high mixing ratios. In contrast the overlaid AMSOS observations show that mixing ratios are very low in some areas of the centre of the vortex, and this can be explained by the
de-25
scent of mesospheric air. Figure 3 shows that, according to the AMSOS observa-tions, air with low humidities and hence likely of mesospheric origin has descended as low as 45 km. Low humidity air is also seen inside the vortex down to 45 km in the
ACPD
7, 247–287, 2007 Middle atmosphere humidity measurements and ECMWF analyses D. G. Feist et al. Title Page Abstract Introduction Conclusions References Tables Figures ◭ ◮ ◭ ◮ Back CloseFull Screen / Esc
Printer-friendly Version Interactive Discussion
February 1999 AMSOS observations (mission 2, see e.g. Fig.9). In November 2001 (mission 4) there are also indications of dry air descending in the vortex (not shown, see supplementary material athttp://www.atmos-chem-phys-discuss.net/7/247/2007/ acpd-7-247-2007-supplement.pdf). Again, these features are not replicated in the ECMWF analyses. As already discussed, the ECMWF analyses cannot represent this
5
because there is no effective source of dry mesospheric air in the model.
In contrast to the dry values seen in the AMSOS observations, the UARS climatology shows only a small decrease in moisture values in the winter upper stratosphere vortex (e.g. Fig.5c). In January (Fig. 7, Randel et al.,1998), mixing ratios are relatively low in the upper stratosphere winter vortex (north of 60 N equivalent latitude), but typical
10
mixing ratios are ∼5.8 ppmv, much higher than the ∼5 ppmv observed by AMSOS. Lahoz et al.(1994) examine some of the northern hemisphere winter MLS moisture observations on which the UARS climatology is based at polar latitudes. They observe relatively dry air in the mid-stratosphere (∼1000 K) and link this to descent from the mesosphere, but this relatively dry air still has mixing ratios of ∼6.2 ppmv. It is clear
15
from the above-mentioned observational studies that mesospheric air descending in the stratospheric vortex may be patchy in spatial or temporal extent, and subject to interannual variability. Hence such features as we observe in AMSOS in March 2000 could easily be averaged out of the UARS climatology, or alternatively may not have been observed in the years for which MLS data was available.
20
To find out how representative the AMSOS observations are, it would be interesting to examine recent MLS observations from the Aura satellite (e.g.Manney et al.,2006); unfortunately the Envisat water vapour observations are of very poor quality in the winter vortex above 10 hPa (Lahoz et al.,2006).
5.2 Vortex boundaries
25
During winter, below the level at which mesospheric air is important, diabatic descent in the vortex creates a situation of relatively high moisture inside the vortex, and low mois-ture outside. This is often explained in terms of the diabatic descent turning vertical
ACPD
7, 247–287, 2007 Middle atmosphere humidity measurements and ECMWF analyses D. G. Feist et al. Title Page Abstract Introduction Conclusions References Tables Figures ◭ ◮ ◭ ◮ Back CloseFull Screen / Esc
Printer-friendly Version Interactive Discussion
gradients into “radial” (i.e. horizontal, equator to pole) gradients. Hence if the ECMWF analyses start with a reasonable approximation of the vertical gradient of moisture at the beginning of winter, as long as the diabatic descent is well-modelled in the system, the model should produce a reasonable estimate of the moisture distribution inside and outside the vortex, and should correctly simulate a vortex edge, represented by a sharp
5
moisture gradient.
We see here that, in general, ECMWF moisture analyses do agree with AMSOS in terms of the positions of the vortex edge. Examples of this are Figs.5a and b, with both datasets showing the vortex edge at very similar equivalent latitudes. More generally, this agreement in terms of vortex location is reflected in the good correlations between
10
AMSOS and ECMWF in all the winter missions through much of the mid stratosphere (Fig. 6a, 475 K to 1000 K). However, the limited temporal and spacial coverage of the AMSOS missions does not allow more quantitative statistics on the exact positional agreement. As a qualitative example, Fig.10shows a typical example of the agreement between AMSOS and ECMWF. Three AMSOS flight legs are shown, for convenience,
15
on the same figure, but note that the ECMWF data are valid for 9 March 2000, the day on which only the westerly flight leg was performed. This leg passed through the vortex edge, whose location in AMSOS matches well to the sharp gradient in both ECMWF PV and moisture. The southerly leg was performed on 8 March 2000 and the northerly leg was performed on 10 March 2000; when overlaid on the corresponding
20
day’s analyses, the location of the vortex edge is as well captured as for the westerly leg. However, there is a stronger contrast in water vapour amounts inside and outside the vortex in the AMSOS data (3.5 ppmv versus 4.5 ppmv) than in the ECMWF data (4.2 ppmv versus 4.7 ppmv). Without much further analysis, we cannot say if this is due to poorly modelled descent or mixing, or if the stratospheric moisture distribution was
25
incorrect even before the onset of wintertime descent. Nonetheless, the vortex edge appears consistently located in both the AMSOS and ECMWF humidities.
ACPD
7, 247–287, 2007 Middle atmosphere humidity measurements and ECMWF analyses D. G. Feist et al. Title Page Abstract Introduction Conclusions References Tables Figures ◭ ◮ ◭ ◮ Back CloseFull Screen / Esc
Printer-friendly Version Interactive Discussion
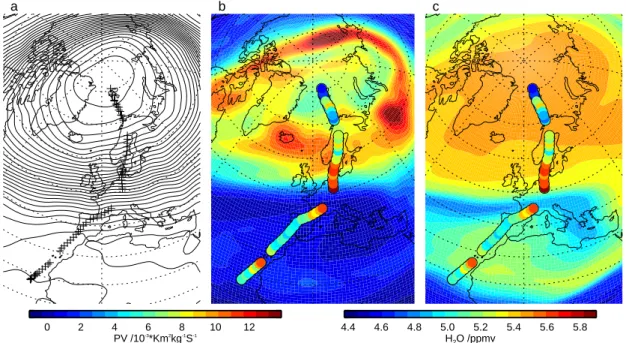
5.3 Filamentation
Filamentation is expected in the winter half of the year at the vortex edge, throughout the vertical extent of the stratosphere (Appenzeller and Holton,1997). Filaments tend to have a tilt with altitude, so they often appear as laminar structures in vertical profiles such as from satellite or radiosonde. A number of studies have observed filamentation
5
or lamination events (e.g.Sutton et al.,1994;Manney et al.,2000;M ¨uller et al.,2003; Lahoz et al.,2006).
We examined the ECMWF PV and moisture fields, and the AMSOS observations, for signs of filamentation. Only four examples coincided with the flight tracks. In the upper stratosphere in February 1999 there were clear signs of filamentation in both
10
ECMWF and AMSOS observations (Fig.9). In November 2001 and September 2002 the ECMWF fields showed indications of filaments, though they did not cross the flight track as clearly or perpendicularly as in Fig.9, and the AMSOS observations did not show anything at all (figures not shown). In August 1998, AMSOS shows signs of fila-mentation, but there is no confirmation from the ECMWF fields. Hence we concentrate
15
on the February 1999 example.
Figure 9 shows the meteorological and moisture fields from ECMWF at 2 hPa (geopotential height) and 1475 K (PV and moisture) for 6 February 1999. The polar vortex is centred near the North Pole, and encloses a region of high PV and high mois-ture. As discussed in Sect. 5.1 the patches of lower PV in the centre of the vortex
20
may be erroneous. Overlaid are the AMSOS moisture values at 1150 K along the flight tracks for 6 February 1999 to 9 February 1999. The observations southwest of Spain were taken on 6 February 1999 itself. The AMSOS observations show clear signs of the descent of dry mesospheric air into the centre of the vortex.
There are filaments of dry and moist air in the ECMWF analyses in the lower half of
25
Fig.9c, associated with a small anticyclonic ridge. The analyses show dry midlatitude air being wrapped around the vortex and drawn eastwards over Europe, and a filament of moist vortex air being drawn westward over North Africa. There is a similar pattern
ACPD
7, 247–287, 2007 Middle atmosphere humidity measurements and ECMWF analyses D. G. Feist et al. Title Page Abstract Introduction Conclusions References Tables Figures ◭ ◮ ◭ ◮ Back CloseFull Screen / Esc
Printer-friendly Version Interactive Discussion
in the PV field (Fig.9b), though the PV values in the vortex filament have only a small contrast with that of the midlatitude air. The AMSOS observations show a moist vor-tex filament in approximately the same position as in the ECMWF analyses, over the Canary Islands, but in AMSOS it is much narrower. A filament of dry midlatitude air is found to the southwest of Spain in the AMSOS observations, about 15◦ to the south of
5
its position in the ECMWF analyses.
The contrasting filaments of midlatitude and vortex air are visible in the AMSOS fields at levels from 1150 K to 2400 K (∼35 km to ∼55 km), and in the ECMWF mois-ture fields from 1150 K to 1900 K. Above this level, there is no gradient between the vortex and the midlatitudes in the ECMWF moisture fields, and so no filament could
10
appear in the moisture fields anyway. Therefore the lack of a filament in the ECMWF analyses between 1900 and 2400 K does not mean it should not exist in the AMSOS observations.
In summary, it appears that the ERA-40 analyses do produce a partial representa-tion of the February 1999 filamentarepresenta-tion observed by AMSOS in the water vapour and
15
to a lesser extent, in PV. Though the amplitudes and positions are not in exact agree-ment, its stratospheric vertical extent is similar in both datasets. Three other possible filamentation events in ECMWF or AMSOS were identified, but not shown, as there was no agreement between the two datasets. However, in two of those cases the AM-SOS flight track was not very well positioned in time and space to capture the potential
20
filament. Comparisons with more recent ECMWF operational analyses (Lahoz et al., 2006) have shown that the ECMWF PV distributions were able to match extremely well with satellite tracer observations of a planetary-scale filament extending around 180◦of longitude. The filaments investigated here are smaller in scale (only 90◦of longitude), and the ERA-40 assimilation system is in comparison less advanced in both algorithm
25
(3D-Var instead of 4D-Var) and resolution (T159 vs. T511). Most other studies which have compared modelled and observed filaments have done so using Lagrangian tra-jectory techniques (e.g.Sutton et al.,1994;Manney et al.,2000), or PV-like advected tracers (M ¨uller et al.,2003). The representation of the February 1999 filament directly
ACPD
7, 247–287, 2007 Middle atmosphere humidity measurements and ECMWF analyses D. G. Feist et al. Title Page Abstract Introduction Conclusions References Tables Figures ◭ ◮ ◭ ◮ Back CloseFull Screen / Esc
Printer-friendly Version Interactive Discussion
in the ERA-40 moisture field and analysed PV is encouraging, especially considering that more recent operational analyses are likely of much better quality, as seen by Lahoz et al.(2006).
5.4 2002 operational analyses
Section2.3 showed that there were substantial differences in stratospheric moisture
5
between ERA-40 and the 2002 operational ECMWF analyses. The upper stratosphere is moister in the operational analyses due to the change in the methane oxidation scheme. In the mid and lower stratosphere, operational analyses are drier, particularly in the moist phase of the tape-recorder. Note however that in late 2002, the moisture values in the upper stratosphere are still spinning up to a new level (see Figs.1and4).
10
We examine the 2002 operational analyses in more detail in this section.
In the tropics in both datasets, there is a minimum in moisture at about 30 km. Values are higher at around 20 km. This is consistent with the tape-recorder effect: higher moisture values come into the lowermost stratosphere around August. Above is a layer of drier air which would have come into the lowermost stratosphere around February,
15
and has since ascended. However, this layer is much broader in the vertical in the ECMWF analyses than in the AMSOS observations, which at 40 km show a sharp transition in the vertical to higher moisture values. In the ECMWF analyses, the dry region extends higher in the atmosphere.
Figures11 and 12 show isentropic cuts through this data, at 850 K and 1475 K
re-20
spectively. ECMWF mixing ratios are generally lower than AMSOS at both levels. In tropical regions at 1475 K, and in polar regions at 850 K, the ECMWF data are as much as ∼1 ppmv lower. The ECMWF PV analyses are also shown on the figure, and have variations with latitude similar to the moisture analyses.
At 1475 K, the moisture difference between the north pole and the tropics in the
25
ECMWF analyses is ∼2 ppmv, larger than that in the AMSOS data, which is ∼1.5 ppmv. The ECMWF operational analyses appear to be too dry in the tropical upper strato-sphere, and comparisons with the UARS climatology (figures not shown) confirm this.
ACPD
7, 247–287, 2007 Middle atmosphere humidity measurements and ECMWF analyses D. G. Feist et al. Title Page Abstract Introduction Conclusions References Tables Figures ◭ ◮ ◭ ◮ Back CloseFull Screen / Esc
Printer-friendly Version Interactive Discussion
Looking at figures similar to Fig. 12 for other levels (not shown), the ECMWF oper-ational analyses in September 2002 are 0.5 to 1 ppmv drier than AMSOS between 1150 K and 1900 K (approximately 35 km to 50 km) in the tropics.
At 850 K, the AMSOS observations show a higher contrast (∼2 ppmv) in moisture values between the north pole and the tropics compared to the ECMWF analyses
5
(∼1.5 ppmv). Here, the UARS observations (not shown) agree more with the ECMWF analyses.
A possible explanation for excessive dryness in the tropical upper stratosphere could be the speed of the upwards propagation of the dry air that comes through the tropical tropopause. If the air is moved too quickly to the upper stratosphere, it will not have
10
had time to undergo sufficient moistening through methane oxidation. This would make the tropical upper stratosphere too dry. However, an equally valid hypothesis would be that the parametrised rate of methane oxidation is too slow. However, it is more likely that dryness in the tropical upper stratosphere would be explained by too-fast vertical ascent. Operational ECMWF wind fields are known to produce too-young age-of-air
15
in the stratosphere and only the very most recent analysis versions have been able to correct this problem (Monge-Sanz et al., 20071). In contrast to the dry air in the tropics, air in the polar upper stratosphere has been subject to the methane oxidation scheme for more than enough time to relax the humidities to the levels typically found in those regions. Hence in the upper stratosphere, this would explain why the polar
20
regions appear sufficiently moist but the tropics appear too dry compared to AMSOS and (figures not shown here) UARS climatology.
1
Monge-Sanz, B. M., Chipperfield, M. P., Simmons, A. J., and Uppala, S. M.: Mean age of air and transport in a CTM: Comparison of different ECMWF analyses, Geophys. Res. Lett., submitted, 2007.
ACPD
7, 247–287, 2007 Middle atmosphere humidity measurements and ECMWF analyses D. G. Feist et al. Title Page Abstract Introduction Conclusions References Tables Figures ◭ ◮ ◭ ◮ Back CloseFull Screen / Esc
Printer-friendly Version Interactive Discussion
6 Conclusions
The comparison between AMSOS microwave humidity profiles and ECMWF wa-ter vapour analyses has helped to understand the qualities and limitations of both datasets. The comparison is necessarily limited to individual case studies since the flight tracks are extremely heterogeneous in space and time, and the five missions
5
sample a wide range of different seasonal behaviour. ECMWF meteorological and moisture fields have helped confirm the geophysical realism of the AMSOS measure-ments, in particular supporting observations of filamentation around the polar vortex in the February 1999 missions. Though three other candidate filamentation events were represented only in one of the two datasets, we would ascribe this mostly to the fact
10
that the AMSOS flight tracks were not in a such a good position to bisect the filament. The AMSOS observations also reveal the descent of dry air from the mesosphere in the polar vortex in the northern hemisphere winter missions of February 1999, March 2000 and November 2001. Relatively dry mesospheric air was observed to descend as low as 45 km in March 2000 in the AMSOS data.
15
Several interesting aspects of the stratospheric water vapour distribution in the ECMWF model can be learned from this study. Two that were already known ( Up-pala et al.,2005;Oikonomou and O’Neill,2006) are that in ERA-40 the tape recorder is too fast and that the lower stratosphere in summer appears excessively moist. This appears particularly in the comparisons with the measurements from August 1998.
20
There have also been important changes from ERA-40 to the operational analysis in 2002. The operational analyses have a moister upper stratosphere than ERA-40 which is probably more realistic. The mid and lower stratosphere are drier, particularly in the moist phase of the tape recorder. But the upper stratosphere shows too great a contrast between the tropics and the pole compared to AMSOS measurements because the
25
tropical upper stratosphere appears too dry. Again, this may be due to too-fast vertical transport.
ACPD
7, 247–287, 2007 Middle atmosphere humidity measurements and ECMWF analyses D. G. Feist et al. Title Page Abstract Introduction Conclusions References Tables Figures ◭ ◮ ◭ ◮ Back CloseFull Screen / Esc
Printer-friendly Version Interactive Discussion
moist above 2000 K/55 km. Neither represents a realistically dry lower mesosphere, despite a parametrisation of the photolysis of water vapour. Good behaviour here is hardly to be expected, as the lower mesosphere is represented only by a few levels close to the model top. However, as a result, the descent of dry mesospheric air in the winter polar vortex to 45 km (as observed by AMSOS) is not represented in ECMWF.
5
Humidity from ECMWF is therefore potentially unreliable throughout the winter polar stratosphere, since other observational studies have shown that such dry air can de-scend as low as 22 km. It would certainly be worthwhile to re-examine ECMWF’s future operational analyses against future data, as the new operational system now reaches further into the mesosphere. After the introduction of cycle31r1 in the fall of 2006
10
(A. Simmons, personal communication) this should allow at least in principle for polar wintertime descent of dry air into the stratosphere.
There are discrepancies between PV and water vapour in the centre of the upper stratospheric vortex in ERA-40: the centre of the vortex shows patches of unexpectedly low PV. These remain unexplained. Despite this, vortex boundaries show reasonable
15
approximate agreement with AMSOS observations and the filament example showed positional agreement to 15 degrees of latitude. This suggests that despite other lim-itations, filaments and vortex boundaries are at least represented approximately in the ERA-40 moisture analyses. More recent ECMWF analyses are likely substantially better at representing such events, as suggested by the good agreement between a
20
filament in ECMWF PV and Envisat observations inLahoz et al.(2006)
This study has also improved understanding of the AMSOS observations. Initial comparisons using AMSOS version 1 retrievals revealed a number of artifacts that could be traced back to problems in the observed spectra. In response we developed version 2 of the retrievals, with better screening of spectra and an improved retrieval
25
method. Version 2 is used throughout this paper and shows substantially better data quality. This shows the advantage of comparing to analyses rather than just the few possible collocations that can usually be found with independent data. In this approach, every AMSOS profile could be included and put into meteorological context. One new
ACPD
7, 247–287, 2007 Middle atmosphere humidity measurements and ECMWF analyses D. G. Feist et al. Title Page Abstract Introduction Conclusions References Tables Figures ◭ ◮ ◭ ◮ Back CloseFull Screen / Esc
Printer-friendly Version Interactive Discussion
artifact was discovered in the Version 2 data: there are coherent vertical oscillations that did not appear in version 1. They are most likely due to the fact that fewer (and therefore noisier) spectra were used to retrieve the individual profiles and that a weaker regularization scheme based on ERA-40 climatology was used.
The results of this study also illustrate another feature of the AMSOS data set. Given
5
the rather broad vertical resolution of roughly 10 km in the AMSOS averaging kernels it was quite surprising to see features of the tropical upper troposphere appear in the retrieved AMSOS water vapour profiles. There was only qualitative agreement in this region but it has helped to understand how the AMSOS retrieval reacts to upper tro-pospheric humidity. In addition to the vertical weighting functions in the stratosphere
10
there is an additional weighting function that is sensitive only to the total integrated wa-ter vapour between the aircraft and the hygropause. The quantitatively reliable strato-spheric water vapour retrievals which provide vertical information therefore start above the hygropause.
Later AMSOS missions like the SCOUT-O3 campaign to Darwin, Australia, in
15
November 2005 have focused more on the tropics than on the arctic. The retrieved profiles will be analysed using the same techniques that have been established in this study and will probably benefit from the enhanced vertical and horizontal resolution of the ECMWF data. The upper-tropospheric humidity layer in the AMSOS retrievals which has not been exploited yet may be useful in this context. Another issue that may
20
be investigated further with the help of AMSOS data is the role of mesospheric descent in the polar vortex which has recently drawn some attention in the published literature (e.g.Engel et al.,2006;Huret et al.,2006).
Acknowledgements. We would like to thank the Swiss Air Force and especially the pilots for
their excellent support that they have given us during our campaigns.
25
Thanks are due to the British Atmospheric Data Centre for providing access to the Met Office Stratospheric Assimilated Data which was used for AMSOS version 1 and also for ECMWF data used by the University of Reading. We would also like to thank ECMWF for providing their analyses, to P. Berrisford and A. Stephens for helping prepare the ECMWF monthly mean
ACPD
7, 247–287, 2007 Middle atmosphere humidity measurements and ECMWF analyses D. G. Feist et al. Title Page Abstract Introduction Conclusions References Tables Figures ◭ ◮ ◭ ◮ Back CloseFull Screen / Esc
Printer-friendly Version Interactive Discussion
humidities, and to A. Simmons from ECMWF for providing helpful comments and insight into the inner workings of the ECMWF stratospheric humidity model.
This work has been funded by COST action 723 and the Swiss National Science Foundation under grant 200020-107665. A. Geer was funded by the Assimilation of Envisat Data project (ASSET,http://darc.nerc.ac.uk/asset/), which is a shared-cost project (contract
EVK2-CT-2002-5
00137) co-funded by the Research DG of the European Commission within the RTD activities of the Environment and Sustainable Development sub-programme (5th Framework Programme).
References
Aellig, C. P., Bacmeister, J., Bevilacqua, R. M., Daehler, M., Kriebel, D., Pauls, T., Siskind, D., K ¨ampfer, N., Langen, J., Hartmann, G., Berg, A., Park, J. H., and Russell III, J. M.:
Space-10
borne H2O observations in the Arctic stratosphere and mesosphere in the spring of 1992,
Geophys. Res. Lett., 23, 2325–2328, doi:10.1029/96GL01571, 1996.249,261
Allen, D. R. and Nakamura, N.: Tracer Equivalent Latitude: A Diagnostic Tool for Isentropic Transport Studies, J. Atmos. Sci., 60, 287–304, doi:10.1175/1520-0469(2003)060h0287: TELADTi2.0.CO;2, 2003.251
15
Appenzeller, C. and Holton, J. R.: Tracer lamination in the stratosphere: A global climatology, J. Geophys. Res., 102, 13 555–13 570, doi:10.1029/97JD00066, 1997. 264
Bengtsson, L., Hagemann, S., and Hodges, K. I.: Can climate trends be calculated from re-analysis data?, J. Geophys. Res., 109, D11111, doi:10.1029/2004JD004536, 2004. 253
Brewer, A. W.: Evidence for a world circulation provided by the measurements of helium and
20
water vapour distribution in the stratosphere, Quart. J. Roy. Meteorol. Soc., 75, 351–363, 1949. 248
Buehler, S. A., Eriksson, P., Kuhn, T., von Engeln, A., and Verdes, C.: ARTS, the atmospheric radiative transfer simulator, J. Quant. Spectrosc. Radiat. Transfer, 91, 65–93, doi:10.1016/j. jqsrt.2004.05.051, 2005.255
25
Dethof, A.: Aspects of Modelling and Assimilation for the Stratosphere at ECMWF, SPARC Newsletter 21, 2003.250
Engel, A., M ¨obius, T., Haase, H.-P., B ¨onisch, H., Wetter, T., Schmidt, U., Levin, I., Reddmann, T., Oelhaf, H., Wetzel, G., Grunow, K., Huret, N., and Pirre, M.: Observation of mesospheric air inside the arctic stratospheric polar vortex in early 2003, Atmos. Chem. Phys., 6, 267–
ACPD
7, 247–287, 2007 Middle atmosphere humidity measurements and ECMWF analyses D. G. Feist et al. Title Page Abstract Introduction Conclusions References Tables Figures ◭ ◮ ◭ ◮ Back CloseFull Screen / Esc
Printer-friendly Version Interactive Discussion
282, 2006,
http://www.atmos-chem-phys.net/6/267/2006/. 249,261,270
Eriksson, P., Jimen ´es, C., and Buehler, S. A.: Qpack, a general tool for instrument simulation and retrieval work, J. Quant. Spectrosc. Radiat. Transfer, 91, 47–64, doi:10.1016/j.jqsrt.2004. 05.050, 2005. 255
5
Fleming, E. L., Chandra, S., Barnett, J. J., and Corney, M.: Zonal mean temperature, pressure, zonal wind and geopotential as functions of latitude, in: CIRA 1986, COSPAR International Reference Atmosphere Part I: Middle Atmosphere Models, edited by: Rees, D., Barnett, J. J., and Labitzke, K., Adv. Space Res., 10(2), (12)11–(12)59, doi:10.1016/0273-1177(90) 90386-E, 1990. 255
10
Fueglistaler, S., Bonazzola, M., Haynes, P. H., and Peter, T.: Stratospheric water vapor pre-dicted from the Lagrangian temperature history of air entering the stratosphere in the tropics, J. Geophys. Res., 110, D08107, doi:10.1029/2004JD005516, 2005. 248
Huret, N., Pirre, M., Hauchecorne, A., Robert, C., and Catoire, V.: On the vertical structure of the stratosphere at midlatitudes during the first stage of the polar vortex formation and
15
in the polar region in the presence of a large mesospheric descent, J. Geophys. Res., 111, D06111, doi:10.1029/2005JD006102, 2006. 261,270
Kley, D., Russell III, J. M., and Phillips, C., eds.: SPARC assessment of upper tropospheric and stratospheric water vapour, no. WCRP-113 in World Climate Research Programme Reports, SPARC Office, BP 3, 91371 Verri `eres le Buisson Cedex, France, 2000. 249
20
Lahoz, W. A., O’Neill, A., Carr, E. S., Harwood, R. S., Froidevaux, L., Read, W. G., Waters, J. W., Kumer, J. B., Mergenthaler, J. L., Roche, A. E., Peckham, G. E., and Swinbank, R.: Three-Dimensional Evolution of Water Vapor Distributions in the Northern Hemisphere Stratosphere as Observed by the MLS, J. Atmos. Sci., 51, 2914–2930, doi: 10.1175/1520-0469(1994)051h2914:TDEOWVi2.0.CO;2, 1994.262
25
Lahoz, W. A., Geer, A. J., and O’Neill, A.: Dynamical evolution of the 2003 southern hemi-sphere stratospheric winter using Envisat trace-gas observations, Q. J. R. Meteorol. Soc., 132, 1985–2008, doi:10.1256/qi.05.221, 2006.262,264,265,266,269
Le Texier, H., Solomon, S., and Garcia, R. R.: The role of molecular hydrogen and methane oxidation in the water vapour budget of the stratosphere, Q. J. R. Meteorol. Soc., 114, 281–
30
295, doi:10.1256/smsqj.48001, 1988. 249
Manney, G. L., Michelsen, H. A., Irion, F. W., Toon, G. C., Gunson, M. R., and Roche, A. E.: Lamination and polar vortex development in fall from ATMOS long-lived trace gases observed
ACPD
7, 247–287, 2007 Middle atmosphere humidity measurements and ECMWF analyses D. G. Feist et al. Title Page Abstract Introduction Conclusions References Tables Figures ◭ ◮ ◭ ◮ Back CloseFull Screen / Esc
Printer-friendly Version Interactive Discussion
during November 1994, J. Geophys. Res., 105, 29 023–29 038, doi:10.1029/2000JD900428, 2000. 264,265
Manney, G. L., Livesey, N. J., Jimenez, C. J., Pumphrey, H. C., Santee, M. L., MacKenzie, I. A., and Waters, J. W.: EOS Microwave Limb Sounder observations of “frozen-in-anticyclonic air in Arctic summer, Geophys. Res. Lett., 33, L06810, doi:10.1029/2005GL025418, 2006.262
5
Morland, J., Deuber, B., Feist, D. G., Martin, L., Nyeki, S., K ¨ampfer, N., M ¨atzler, C., Jeannet, P., and Vuilleumier, L.: The STARTWAVE atmospheric water vapour database, Atmos. Chem. Phys., 6, 2039–2056, 2006,
http://www.atmos-chem-phys.net/6/2039/2006/. 255
Mote, P. W., Rosenlof, K. H., Holton, J. R., Harwood, R. S., and Waters, J. W.: Seasonal
10
variations of water vapor in the tropical lower stratosphere, Geophys. Res. Lett., 22, 1093– 1096, doi:10.1029/95GL01234, 1995. 249
M ¨uller, M., Neuber, R., Fierli, F., Hauchecorne, A., V ¨omel, H., and Oltmans, S. J.: Stratospheric water vapour as tracer for vortex filamentation in the Arctic winter 2002/2003, Atmos. Chem. Phys., 3, 1991–1997, 2003,
15
http://www.atmos-chem-phys.net/3/1991/2003/. 264,265
Oikonomou, E. K. and O’Neill, A.: Evaluation of ozone and water vapor fields from the ECMWF reanalysis ERA-40 during 19911999 in comparison with UARS satellite and MOZAIC aircraft observations, J. Geophys. Res., 111, D14109, doi:10.1029/2004JD005341, 2006.250,251,
259,268
20
Peter, R.: Stratospheric and mesospheric latitudinal water vapor distributions obtained by an airborne millimeter-wave spectrometer, J. Geophys. Res., 103, 16 275–16 290, doi:10.1029/ 98JD00968, 1998. 249
Plumb, R. A.: Stratospheric transport, J. Meteorol. Soc. Japan, 80, 793–809, 2002.249,250
Plumb, R. A., Heres, W., Neu, J. L., Mahowald, N. M., del Corral, J., Toon, G. C., Ray, E.,
25
Moore, F., and Andrews, A. E.: Global tracer modeling during SOLVE: High-latitude descent and mixing, J. Geophys. Res., 108, 8309, doi:10.1029/2001JD001023, 2002. 249,261
Randel, W., Udelhofen, P., Fleming, E., Geller, M., Gelman, M., Hamilton, K., Karoly, D., Ortland, D., Pawson, S., Swinbank, R., Wu, F., Baldwin, M., Chanin, M.-L., Keckhut, P., Labitzke, K., Remsberg, E., Simmons, A., and Wu, D.: The SPARC Intercomparison of
30
Middle-Atmosphere Climatologies, J. Climate, 17, 986–1002, doi:10.1175/1520-0442(2004) 017h0986:TSIOMCi2.0.CO;2, 2004a. 251,261
ACPD
7, 247–287, 2007 Middle atmosphere humidity measurements and ECMWF analyses D. G. Feist et al. Title Page Abstract Introduction Conclusions References Tables Figures ◭ ◮ ◭ ◮ Back CloseFull Screen / Esc
Printer-friendly Version Interactive Discussion
QBO variations in stratospheric CH4 and H2O observed in UARS HALOE data, J. Atmos.
Sci., 55, 163–185, doi:10.1175/1520-0469(1998)055h0163:SCAQVIi2.0.CO;2, 1998. 252,
256,262
Randel, W. J., Wu, F., Oltmans, S. J., Rosenlof, K., and Nedoluha, G. E.: Interannual Changes of Stratospheric Water Vapor and Correlations with Tropical Tropopause Temperatures,
5
J. Atmos. Sci., 61, 2133–2148, doi:10.1175/1520-0469(2004)061h2133:ICOSWVi2.0.CO;2, 2004b.249,253
Rodgers, C. D.: Inverse Methods for Atmospheric Sounding: Theory and Practice, vol. 2 of Series on atmospheric, oceanic and planetary physics, World Scientific Publishing Co. Pte. Ltd., P O Box 128, Farrer Road, Singapore 912805, 2000.255
10
Simmons, A. J., Untch, A., Jakob, C., Kallberg, P., and Unden, P.: Stratospheric water vapour and tropical tropopause temperatures in ECMWF analyses and multi-year simula-tions, Quart. J. Roy. Meteorol. Soc., 125, 353–386, doi:10.1256/smsqj.55316, 1999. 250
Simmons, A. J., Hortal, M., Kelly, G., McNally, A., Untch, A., and Uppala, S.: ECMWF Analyses and Forecasts of Stratospheric Winter Polar Vortex Breakup: September 2002 in the
South-15
ern Hemisphere and Related Events, J. Atmos. Sci., 62, 668–689, doi:10.1175/JAS-3322.1, 2005. 250
Sutton, R. T., Maclean, H., Swinbank, R., O’Neill, A., and Taylor, F. W.: High-Resolution Stratospheric Tracer Fields Estimated from Satellite Observations Using Lagrangian Trajec-tory Calculations, J. Atmos. Sci., 51, 2995–3005, doi:10.1175/1520-0469(1994)051h2995:
20
HRSTFEi2.0.CO;2, 1994. 264,265
Uppala, S. M., K ˚allberg, P. W., Simmons, A. J., Andrae, U., da Costa Bechtold, V., Fiorino, M., Gibson, J. K., Haseler, J., Hernandez, A., Kelly, G. A., Li, X., Onogi, K., Saarinen, S., Sokka, N., Allan, R. P., Andersson, E., Arpe, K., Balmaseda, M. A., Beljaars, A. C. M., Van De Berg, L., Bidlot, J., Bormann, N., Caires, S., Chevallier, F., Dethof, A., Dragosavac, M., Fisher,
25
M., Fuentes, M., Hagemann, S., H ´olm, E., Hoskins, B. J., Isaksen, L., Janssen, P. A. E. M., Jenne, R., McNally, A. P., Mahfouf, J.-F., Morcrette, J.-J., Rayner, N. A., Saunders, R. W., Simon, P., Sterl, A., Trenberth, K. E., Untch, A., Vasiljevic, D., Viterbo, P., and Woollen, J.: The ERA-40 re-analysis, Q. J. R. Meteorol. Soc., 131, 2961–3012, doi:10.1256/qj.04.176, 2005. 249,251,252,261,268
30
Vasi´c, V., Feist, D. G., M ¨uller, S., and K ¨ampfer, N.: An airborne radiometer for stratospheric water vapor measurements at 183 GHz, IEEE Trans. Geosci. Remote Sens., 43, 1563–1570, doi:10.1109/TGRS.2005.846860, 2005.254,255
ACPD
7, 247–287, 2007 Middle atmosphere humidity measurements and ECMWF analyses D. G. Feist et al. Title Page Abstract Introduction Conclusions References Tables Figures ◭ ◮ ◭ ◮ Back CloseFull Screen / Esc
Printer-friendly Version Interactive Discussion
Table 1.AMSOS mission overview.
Mission Time period Lat. range Campaign 1 24/08/1998–28/08/1998 8–90◦N WAVE 2 05/02/1999–12/02/1999 17–81◦N THESEO 1999 3 08/03/2000–14/03/2000 29–90◦N THESEO 2000/SOLVE 4 09/11/2001–13/11/2001 9–87◦N SPURT 2001 5 16/09/2002–20/09/2002 5–90◦N Envisat validation
ACPD
7, 247–287, 2007 Middle atmosphere humidity measurements and ECMWF analyses D. G. Feist et al. Title Page Abstract Introduction Conclusions References Tables Figures ◭ ◮ ◭ ◮ Back CloseFull Screen / Esc
Printer-friendly Version Interactive Discussion Specific Humidity /kgkg-1 1991 1992 1993 1994 1995 1996 1997 1998 1999 2000 2001 2002 2003 2004 2005 100 10 1 Pressure /hPa -1.0 -0.5 0.0 0.5 1.0 ppmm
Fig. 1. Time series of deseasonalised humidity anomalies from the ECMWF analyses, aver-aged over the region 20◦S to 20◦N. ERA-40 analyses are presented up until December 2001; operational analyses thereafter.