HAL Id: hal-00296876
https://hal.archives-ouvertes.fr/hal-00296876
Submitted on 7 May 2005
HAL is a multi-disciplinary open access
archive for the deposit and dissemination of
sci-entific research documents, whether they are
pub-lished or not. The documents may come from
teaching and research institutions in France or
abroad, or from public or private research centers.
L’archive ouverte pluridisciplinaire HAL, est
destinée au dépôt et à la diffusion de documents
scientifiques de niveau recherche, publiés ou non,
émanant des établissements d’enseignement et de
recherche français ou étrangers, des laboratoires
publics ou privés.
Comparing microphysical/dynamical outputs by
different cloud resolving models: impact on passive
microwave precipitation retrieval from satellite
C. M. Medaglia, C. Adamo, F. Baordo, S. Dietrich, S. Di Michele, V. Kotroni,
K. Lagouvardos, A. Mugnai, S. Pinori, E. A. Smith, et al.
To cite this version:
C. M. Medaglia, C. Adamo, F. Baordo, S. Dietrich, S. Di Michele, et al.. Comparing
microphysi-cal/dynamical outputs by different cloud resolving models: impact on passive microwave precipitation
retrieval from satellite. Advances in Geosciences, European Geosciences Union, 2005, 2, pp.195-199.
�hal-00296876�
Advances in Geosciences, 2, 195–199, 2005 SRef-ID: 1680-7359/adgeo/2005-2-195 European Geosciences Union
© 2005 Author(s). This work is licensed under a Creative Commons License.
Advances in
Geosciences
Comparing microphysical/dynamical outputs by different cloud
resolving models: impact on passive microwave precipitation
retrieval from satellite
C. M. Medaglia1, C. Adamo1, F. Baordo1, S. Dietrich1, S. Di Michele1,2, V. Kotroni3, K. Lagouvardos3, A. Mugnai1, S. Pinori1, E. A. Smith4, and G. J. Tripoli5
1Istituto di Scienze dell’Atmosfera e del Clima, Consiglio Nazionale delle Ricerche, Roma, Italy 2European Centre for Medium-Range Weather Forecasts, Reading, UK
3Institute of Environmental Research, National Observatory of Athens, Athens, Greece
4Goddard Space Flight Center, National Aeronautics and Space Administration, Greenbelt, Maryland, USA 5Department of Atmospheric and Oceanic Sciences, University of Wisconsin, Madison, Wisconsin, USA
Received: 28 February 2005 – Accepted: 18 May 2005 – Published: 7 June 2005
Abstract. Mesoscale cloud resolving models (CRM’s) are often utilized to generate consistent descriptions of the mi-crophysical structure of precipitating clouds, which are then used by physically-based algorithms for retrieving precip-itation from satellite-borne microwave radiometers. How-ever, in principle, the simulated upwelling brightness tem-peratures (TB’s) and derived precipitation retrievals
gener-ated by means of different CRM’s with different microphys-ical assumptions, may be significantly different even when the models simulate well the storm dynamical and rainfall characteristics.
In this paper, we investigate this issue for two well-known models having different treatment of the bulk microphysics, i.e. the UW-NMS and the MM5. To this end, the models are used to simulate the same 24–26 November 2002 flood-producing storm over northern Italy. The model outputs that best reproduce the structure of the storm, as it was observed by the Advanced Microwave Scanning Radiometer (AMSR) onboard the EOS-Aqua satellite, have been used in order to compute the upwelling TB’s. Then, these TB’s have been
utilized for retrieving the precipitation fields from the AMSR observations. Finally, these results are compared in order to provide an indication of the CRM-effect on precipitation retrieval.
1 Introduction
Physically-based passive-microwave precipitation retrieval algorithms make use of cloud radiation databases (CRD’s) that are composed of thousands of detailed microphysical
Correspondence to: C. M. Medaglia
cloud profiles, obtained from cloud resolving model (CRM) simulations, coupled with the corresponding brightness tem-peratures (TB’s), calculated by applying radiative transfer
(RT) schemes to the CRM outputs (e.g., Smith et al., 1994). As a consequence, the accuracy of precipitation retrievals may be very much dependent on the CRM skill to provide a consistent and realistic description of the microphysical structure of precipitating clouds – besides reproducing their dynamical behavior and cumulated rainfall.
On the other hand, CRM’s adopt bulk microphysical schemes that provide a rather crude representation of the very complex and storm-dependent microphysical character-istics of the iced and melted hydrometeors. Thus, it would be important to perform sensitivity studies aiming at assess-ing the impact of different CRM microphysical schemes and simulations on the generated CRD’s and on the derived re-trievals. This problem, however, has been largely overlooked in the past – even though some authors (e.g., Panegrossi et al., 1998) have performed comparative analyses of cloud-radiation features generated by different storm simulations.
In this paper, we extend a previous work by Dietrich et al. (2003) who made a preliminary comparison of the mi-crophysics and the microwave signatures of two simulations of the 24–26 November 2002 flood-producing storm over Northern Italy, that were performed by the University of Wisconsin – Non-hydrostatic Modeling System (UW-NMS) (Tripoli, 1992) and by the Penn State University/NCAR Mesoscale Model (MM5) (Dudhia, 1993).
2 Description of the heavy-precipitation event
On 24 November 2002, at 00:00 UTC, the northern part of Italy was under the influence of a diffluent trough with its axis spanning from Ireland trough western Spain and
196 C. M. Medaglia et al.: Impact on passive microwave precipitation retrieval from satellite
2
its axis spanning from Ireland trough western Spain and
Portugal. At low levels warm and humid air originating
from the Mediterranean area was driven northward
towards the Alps where it met cold and dry air originating
from the eastern Atlantic. An intense Sirocco wind was
present throughout the Italian peninsula, raising surface
temperatures up to 25° C in northwest Sardinia. Rainfall
began on November 24 in the western part of the Alps,
over the Liguria and Lombardia regions. On November
25, the storm system moved towards the eastern Italian
Alps, spawning intense thunderstorms, and in some cases
hail, over the Lombardia and Friuli regions. Heavy rains
continued until November 26 when precipitation ended in
response to subsidence from a high-pressure system
centered over Eastern Europe. As described by Tripoli et
al. (2001), heavy precipitation in these areas results as the
Sirocco wind is channeled around the topography
surrounding the Tyrrhenian Sea.
The present study focuses on the late morning – early
afternoon of November 24, as there was an AMSR-E
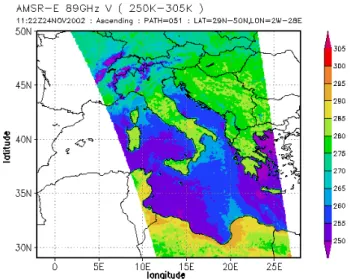
overpass at 11:22 UTC over the Italian peninsula (Fig. 1).
Fig. 1. AMSR-E 89 GHz upwelling TB’s at 11:22 UTC, 24
November 2002.
3 Cloud
model
simulations
The November 24-26, 2002 flood-producing storm over
Northern Italy, has been simulated by two models: the
UW-NMS and the MM5. These are two well-known
three-dimensional time-dependent explicit
non-hydrostatic cloud resolving models, that have different
treatments of the bulk microphysics.
The UW-NMS model employs a two-way multiple
nested grid system that allows any nest to move along a
specified trajectory or to move with the surface pressure
minimum. The UW-NMS generalized bulk microphysics
scheme predicts the mixing ratios of six different
hydrometeor categories (cloud droplets, rain drops,
graupel particles, pristine ice crystals, snowflakes, and ice
aggregates). To simulate this event, three nested grids
were used: grid 1 (with 37.5 km resolution) covering a
large region spanning much of Europe, the Mediterranean
and North Africa; grid 2 (9.4 km resolution) covering
North-Central Italy and the Southern regions of Germany
and France; and grid 3 (3.1 km resolution) covering
Northern Italy. Grid 3 uses 141x261 horizontal grid
points and 35 vertical levels (up to 18 km). The NCEP
Global Forecasting System (GFS) gridded analysis fields
at 00:00 UTC, 24 November 2002 have been used to
initialize the model and to nudge the boundaries of grid 1
during the simulation period. The simulations for all
three grids lasted for 72 hours.
The MM5 model (Version 3) is a non-hydrostatic
primitive equation model using terrain-following
coordinates. Several physical parameterization schemes
are available in the model for the boundary layer, the
microphysics and the cumulus convection. For the
simulations performed for this study, the same schemes
used by Kotroni and Lagouvardos (2001).have been
adopted. In particular, the mixing ratios of five different
hydrometeors (cloud droplets, rain drops, graupel
particles, pristine ice crystals, and snowflakes) are
predicted. To simulate this event, three nested grids were
used that cover roughly the same regions than the
corresponding grids of the UW-NMS model, however,
with a different resolution – i.e., 24 km resolution for grid
1; 8 km resolution for grid 2; and 2 km resolution for grid
3. Grid 3 uses 250x250 horizontal grid points and 30
vertical levels (up to 16 km). Again, the NCEP GFS
gridded analysis fields at 00:00 UTC, 24 November 2002
have been used to initialize the model and to nudge the
boundaries of grid 1 during the simulation period. The
simulations lasted for 72 hours for all three grids.
For the purposes of this study, the model outputs from
the inner grid of both models have been analyzed in order
to select those outputs that best reproduce the storm
structure as observed by the AMSR-E overpass (Fig. 1).
Based on this criterion, the model output of UW-NMS at
15:00 UTC, 24 November 2002 and the model output of
MM5 at 13:00 UTC, 24 November 2002 are used in the
rest of this study.
Fig. 2 shows the columnar equivalent water contents
(CWC’s) for selected hydrometeor species as a function
of rainfall rate, at the selected times from both model
simulations. The different bulk microphysics schemes
adopted by the two models produce remarkable
differences in the hydrometeor CWC’s despite the overall
similarity of the rainfall fields. The rain CWC’s
generated by the UW-NMS are considerably
higher than
those for the MM5. The ice CWC’s show even larger
differences: the MM5 produces many more hard-ice
Fig. 1. AMSR-E 89 GHz upwelling TB’s at 11:22 UTC, 24
Novem-ber 2002.
Portugal. At low levels warm and humid air originating from the Mediterranean area was driven northward towards the Alps where it met cold and dry air originating from the east-ern Atlantic. An intense Sirocco wind was present through-out the Italian peninsula, raising surface temperatures up to 25◦C in northwest Sardinia. Rainfall began on 24 November in the western part of the Alps, over the Liguria and Lom-bardia regions. On 25 November, the storm system moved towards the eastern Italian Alps, spawning intense thunder-storms, and in some cases hail, over the Lombardia and Friuli regions. Heavy rains continued until 26 November when precipitation ended in response to subsidence from a high-pressure system centered over Eastern Europe. As described by Tripoli et al. (2001), heavy precipitation in these areas re-sults as the Sirocco wind is channeled around the topography surrounding the Tyrrhenian Sea.
The present study focuses on the late morning – early af-ternoon of 24 November, as there was an AMSR-E overpass at 11:22 UTC over the Italian peninsula (Fig. 1).
3 Cloud model simulations
The 24–26 November 2002 flood-producing storm over Northern Italy, has been simulated by two models: the UW-NMS and the MM5. These are two well-known three-dimensional time-dependent explicit non-hydrostatic cloud resolving models, that have different treatments of the bulk microphysics.
The UW-NMS model employs a two-way multiple nested grid system that allows any nest to move along a specified trajectory or to move with the surface pressure minimum. The UW-NMS generalized bulk microphysics scheme pre-dicts the mixing ratios of six different hydrometeor cate-gories (cloud droplets, rain drops, graupel particles, pristine ice crystals, snowflakes, and ice aggregates). To simulate
this event, three nested grids were used: grid 1 (with 37.5 km resolution) covering a large region spanning much of Eu-rope, the Mediterranean and North Africa; grid 2 (9.4 km resolution) covering North-Central Italy and the Southern re-gions of Germany and France; and grid 3 (3.1 km resolution) covering Northern Italy. Grid 3 uses 141×261 horizontal grid points and 35 vertical levels (up to 18 km). The NCEP Global Forecasting System (GFS) gridded analysis fields at 00:00 UTC, 24 November 2002 have been used to initialize the model and to nudge the boundaries of grid 1 during the simulation period. The simulations for all three grids lasted for 72 h.
The MM5 model (Version 3) is a non-hydrostatic primitive equation model using terrain-following coordinates. Several physical parameterization schemes are available in the model for the boundary layer, the microphysics and the cumulus convection. For the simulations performed for this study, the same schemes used by Kotroni and Lagouvardos (2001).have been adopted. In particular, the mixing ratios of five differ-ent hydrometeors (cloud droplets, rain drops, graupel parti-cles, pristine ice crystals, and snowflakes) are predicted. To simulate this event, three nested grids were used that cover roughly the same regions than the corresponding grids of the UW-NMS model, however, with a different resolution – i.e., 24 km resolution for grid 1; 8 km resolution for grid 2; and 2 km resolution for grid 3. Grid 3 uses 250×250 horizontal grid points and 30 vertical levels (up to 16 km). Again, the NCEP GFS gridded analysis fields at 00:00 UTC, 24 Novem-ber 2002 have been used to initialize the model and to nudge the boundaries of grid 1 during the simulation period. The simulations lasted for 72 h for all three grids.
For the purposes of this study, the model outputs from the inner grid of both models have been analyzed in order to se-lect those outputs that best reproduce the storm structure as observed by the AMSR-E overpass (Fig. 1). Based on this criterion, the model output of UW-NMS at 15:00 UTC, 24 November 2002 and the model output of MM5 at 13:00 UTC, 24 November 2002 are used in the rest of this study.
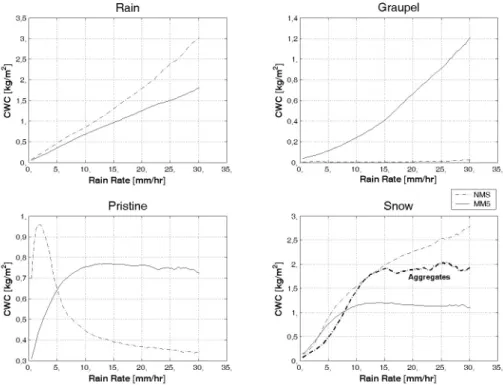
Figure 2 shows the columnar equivalent water contents (CWC’s) for selected hydrometeor species as a function of rainfall rate, at the selected times from both model simula-tions. The different bulk microphysics schemes adopted by the two models produce remarkable differences in the hy-drometeor CWC’s despite the overall similarity of the rain-fall fields. The rain CWC’s generated by the UW-NMS are considerably higher than those for the MM5. The ice CWC’s show even larger differences: the MM5 produces many more hard-ice (graupel) particles than the UW-NMS, which, in turn, produces much more soft-ice (snowflakes + ice aggre-gates) than the MM5. Noteworthy, while there is a consider-able dispersion (not shown) around the average values shown in this figure, these results provide useful information for our following analyses on the simulated TB’s and the resulting rainfall retrievals.
Finally, we mention that the average surface tempera-ture for the MM5 simulation is constantly lower (about 2– 3 K) than for the UW-NMS simulation, while the UW-NMS
C. M. Medaglia et al.: Impact on passive microwave precipitation retrieval from satellite 197
3
(graupel) particles than the UW-NMS, which, in turn,
produces much more soft-ice (snowflakes + ice
aggregates) than the MM5. Noteworthy, while there is a
considerable dispersion (not shown) around the average
values shown in this figure, these results provide useful
information for our following analyses on the simulated
TB’s and the resulting rainfall retrievals.
Fig. 2. Average CWC’s of the indicated hydrometeor species as
a function of rain rate for the inner grids of the UW-NMS
(dashed) and MM5 (solid) simulations at the selected times.
Note that in the bottom right panel (snow) the UW-NMS
aggregates are also shown (heavy dashed).
Finally, we mention that the average surface
temperature for the MM5 simulation is constantly lower
(about 2-3 K) than for the UW-NMS simulation, while
the UW-NMS simulation is significantly more humid
than the MM5 simulation. The average columnar water
vapor content is always higher for the UW-NMS
simulation and, in contrast to the MM5 simulation, it
increases monotonically with rain rate.
4
Simulated brightness temperatures
In order to generate the cloud-radiation databases to be
used for retrieving precipitation from the AMSR
observations of Fig. 1, we have simulated the AMSR
upwelling brightness temperatures by applying a radiative
transfer code to the microphysical outputs of the
UW-NMS and MM5 simulations presented in Section 3. Fig.
3 shows the average upwelling T
B’s at four AMSR
frequencies (18.7, 23.8, 36.5, and 89 GHz) as a function
of rain rate for the UW-NMS and MM5 simulations.
At the two lower frequencies, the upwelling T
B’s are
basically responsive to surface emission, (cloud + rain)
liquid water emission and water vapor emission. At 18.7
GHz, the UW-NMS T
B’s for low rain rates are a few
degrees higher than those for the MM5, because of higher
surface temperature and columnar water vapor content.
As rain rate increases, the MM5 T
B’s first increase
because of increasing rain liquid water emission, then
(around 10 mm/hr) level off because of signal saturation,
and finally (for rain rates larger than about 20 mm/hr)
decrease because emission occurs at increasingly high
altitudes (and therefore at increasingly cold temperatures)
due to increasing atmospheric optical depth. A similar
behavior is observed for the UW-NMS T
B’s; however, in
this case signal saturation occurs at lower rain rates while
the subsequent decrease is faster because of larger rain
CWC’s and water vapor amounts. The behavior of the
23.8 GHz T
B’s can be explained in a quite similar way
and differs from the 18.7 GHz case because of increased
water vapor absorption. At the two higher frequencies,
the upwelling T
B’s are responsive to ice scattering,
besides emission and scattering by liquid water and water
vapor emission. That is why the upwelling T
B’s steadily
decrease as rain rate increases – i.e., as rain and ice
CWC’s increase. These T
Bdepressions span a range of
15-20 K at 36.5 GHz, which increases up to 60-70 K at
89 GHz due to the fact that scattering effects increase
with frequency. The MM5 upwelling T
B’s at 36.5 GHz
are constantly lower (2-5 K) than for the UW-NMS
simulation because ice scattering is mainly due to the
denser graupel particles, which are basically present only
in the MM5 simulation. In contrast, the UW-NMS
upwelling T
B’s at 89 GHz, become increasingly lower (up
to 10 K) than for the MM5 above about 10 mm/hr
soft-ice because of the increasingly larger scattering effect due
to snowflakes and ice aggregates.
Fig. 3. Average upwelling T
B’s at four AMSR frequencies
(18.7, 23.8, 36.5, and 89 GHz) as a function of rain rate for the
inner grids of the UW-NMS (dashed) and MM5 (solid)
simulations.
Fig. 2. Average CWC’s of the indicated hydrometeor species as a function of rain rate for the inner grids of the UW-NMS (dashed) and MM5 (solid) simulations at the selected times. Note that in the bottom right panel (snow) the UW-NMS aggregates are also shown (heavy dashed).
simulation is significantly more humid than the MM5 simu-lation. The average columnar water vapor content is always higher for the UW-NMS simulation and, in contrast to the MM5 simulation, it increases monotonically with rain rate.
4 Simulated brightness temperatures
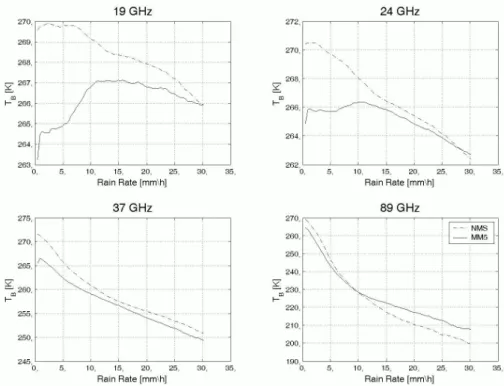
In order to generate the cloud-radiation databases to be used for retrieving precipitation from the AMSR observations of Fig. 1, we have simulated the AMSR upwelling brightness temperatures by applying a radiative transfer code to the microphysical outputs of the UW-NMS and MM5 simula-tions presented in Sect. 3. Figure 3 shows the average up-welling TB’s at four AMSR frequencies (18.7, 23.8, 36.5,
and 89 GHz) as a function of rain rate for the UW-NMS and MM5 simulations.
At the two lower frequencies, the upwelling TB’s are
ba-sically responsive to surface emission, (cloud + rain) liquid water emission and water vapor emission. At 18.7 GHz, the UW-NMS TB’s for low rain rates are a few degrees higher
than those for the MM5, because of higher surface tem-perature and columnar water vapor content. As rain rate increases, the MM5 TB’s first increase because of
increas-ing rain liquid water emission, then (around 10 mm/hr) level off because of signal saturation, and finally (for rain rates larger than about 20 mm/hr) decrease because emission oc-curs at increasingly high altitudes (and therefore at increas-ingly cold temperatures) due to increasing atmospheric opti-cal depth. A similar behavior is observed for the UW-NMS
TB’s; however, in this case signal saturation occurs at lower
rain rates while the subsequent decrease is faster because of larger rain CWC’s and water vapor amounts. The behavior of the 23.8 GHz TB’s can be explained in a quite similar way
and differs from the 18.7 GHz case because of increased wa-ter vapor absorption. At the two higher frequencies, the up-welling TB’s are responsive to ice scattering, besides
emis-sion and scattering by liquid water and water vapor emisemis-sion. That is why the upwelling TB’s steadily decrease as rain rate
increases – i.e., as rain and ice CWC’s increase. These TB
depressions span a range of 15–20 K at 36.5 GHz, which in-creases up to 60–70 K at 89 GHz due to the fact that scat-tering effects increase with frequency. The MM5 upwelling TB’s at 36.5 GHz are constantly lower (2–5 K) than for the
UW-NMS simulation because ice scattering is mainly due to the denser graupel particles, which are basically present only in the MM5 simulation. In contrast, the UW-NMS upwelling TB’s at 89 GHz, become increasingly lower (up to 10 K) than
for the MM5 above about 10 mm/hr soft-ice because of the increasingly larger scattering effect due to snowflakes and ice aggregates.
5 Precipitation retrievals
The simulated upwelling TB’s described in Section 4 have
been used to generate two different CRD’s that correspond to the two simulations. Then, these two CRD’s have been utilized within the algorithm developed by Di Michele et al. (2003, 2005 – see also Mugnai et al., 2001) to perform two
198 C. M. Medaglia et al.: Impact on passive microwave precipitation retrieval from satellite
3
(graupel) particles than the UW-NMS, which, in turn,
produces much more soft-ice (snowflakes + ice
aggregates) than the MM5. Noteworthy, while there is a
considerable dispersion (not shown) around the average
values shown in this figure, these results provide useful
information for our following analyses on the simulated
TB’s and the resulting rainfall retrievals.
Fig. 2. Average CWC’s of the indicated hydrometeor species as
a function of rain rate for the inner grids of the UW-NMS
(dashed) and MM5 (solid) simulations at the selected times.
Note that in the bottom right panel (snow) the UW-NMS
aggregates are also shown (heavy dashed).
Finally, we mention that the average surface
temperature for the MM5 simulation is constantly lower
(about 2-3 K) than for the UW-NMS simulation, while
the UW-NMS simulation is significantly more humid
than the MM5 simulation. The average columnar water
vapor content is always higher for the UW-NMS
simulation and, in contrast to the MM5 simulation, it
increases monotonically with rain rate.
4
Simulated brightness temperatures
In order to generate the cloud-radiation databases to be
used for retrieving precipitation from the AMSR
observations of Fig. 1, we have simulated the AMSR
upwelling brightness temperatures by applying a radiative
transfer code to the microphysical outputs of the
UW-NMS and MM5 simulations presented in Section 3. Fig.
3 shows the average upwelling T
B’s at four AMSR
frequencies (18.7, 23.8, 36.5, and 89 GHz) as a function
of rain rate for the UW-NMS and MM5 simulations.
At the two lower frequencies, the upwelling T
B’s are
basically responsive to surface emission, (cloud + rain)
liquid water emission and water vapor emission. At 18.7
GHz, the UW-NMS T
B’s for low rain rates are a few
degrees higher than those for the MM5, because of higher
surface temperature and columnar water vapor content.
As rain rate increases, the MM5 T
B’s first increase
because of increasing rain liquid water emission, then
(around 10 mm/hr) level off because of signal saturation,
and finally (for rain rates larger than about 20 mm/hr)
decrease because emission occurs at increasingly high
altitudes (and therefore at increasingly cold temperatures)
due to increasing atmospheric optical depth. A similar
behavior is observed for the UW-NMS T
B’s; however, in
this case signal saturation occurs at lower rain rates while
the subsequent decrease is faster because of larger rain
CWC’s and water vapor amounts. The behavior of the
23.8 GHz T
B’s can be explained in a quite similar way
and differs from the 18.7 GHz case because of increased
water vapor absorption. At the two higher frequencies,
the upwelling T
B’s are responsive to ice scattering,
besides emission and scattering by liquid water and water
vapor emission. That is why the upwelling T
B’s steadily
decrease as rain rate increases – i.e., as rain and ice
CWC’s increase. These T
Bdepressions span a range of
15-20 K at 36.5 GHz, which increases up to 60-70 K at
89 GHz due to the fact that scattering effects increase
with frequency. The MM5 upwelling T
B’s at 36.5 GHz
are constantly lower (2-5 K) than for the UW-NMS
simulation because ice scattering is mainly due to the
denser graupel particles, which are basically present only
in the MM5 simulation. In contrast, the UW-NMS
upwelling T
B’s at 89 GHz, become increasingly lower (up
to 10 K) than for the MM5 above about 10 mm/hr
soft-ice because of the increasingly larger scattering effect due
to snowflakes and ice aggregates.
Fig. 3. Average upwelling T
B’s at four AMSR frequencies
(18.7, 23.8, 36.5, and 89 GHz) as a function of rain rate for the
inner grids of the UW-NMS (dashed) and MM5 (solid)
simulations.
Fig. 3. Average upwelling TB’s at four AMSR frequencies (18.7, 23.8, 36.5, and 89 GHz) as a function of rain rate for the inner grids of the
UW-NMS (dashed) and MM5 (solid) simulations.
4
5 Precipitation retrievals
The simulated upwelling TB’s described in Section 4 have
been used to generate two different CRD’s that correspond to the two simulations. Then, these two CRD’s have been utilized within the algorithm developed by Di Michele et al. (2003, 2005 – see also Mugnai et al., 2001) to perform two different rainfall retrievals from the AMSR observations of Section 2. Fig. 4 is a scatterplot of the retrieved precipitation fields, obtained from the UW-NMS and the MM5 CRD’s. This result demonstrates that significant differences (up to 10 mm/hr) may be found for any rain rate regime between the UW-NMS and the MM5 derived rainfall rates – despite their overall similar behavior.
Fig. 4. Rainfall retrievals based on the MM5 CRD vs.
corresponding retrievals based on the UW-NMS CRD.
6 Conclusions
This study has clearly demonstrated that: a), important differences may be found in cloud-radiation databases generated by different cloud resolving models adopting different bulk microphysical schemes – even when the models are used to simulate the same event(s) and all model simulations reproduce reasonably well the observed accumulated precipitation and rainfall patterns; and b), these CRD differences may produce significant differences in the retrieved rain rates. This problem has to be seriously tackled in order to produce global, reliable and consistent precipitation retrievals. However, it has been so far largely overlooked. This study is a first step towards that direction. In the future, we plan to consider additional case studies and cloud resolving models, so as to achieve more general conclusions and quantify the CRM-effect on rainfall retrieval uncertainties.
Acknowledgements. This study has been supported by the
National Group for Prevention from Hydro-geological Hazards (GNDCI) of the Italian National Research Council (CNR), by the Italian Space Agency (ASI), the European Community Initiative INTERREG III B CADSES - RISK AWARE project, and the Greek-Italian collaboration project financed by the General Secretariat for Research and Technology.
References
Dietrich, S., Di Michele, S., Kotroni, V., Lagouvardos, K., Medaglia, C.M., Mugnai, A., Panegrossi, G., Smith, E.A., and Tripoli, G.J.: Comparing cloud microphysics and derived microwave signatures generated by different cloud resolving models, in 5th Plinius Conference on Mediterranean Storms, edited by J. Testud, A. Mugnai, and J-F Santucci, pp. 433-442, 2003.
Di Michele, S., Marzano, F.S., Mugnai, A., Tassa, A., and Poiares Baptista, J.P.V.: Physically-based statistical integration of TRMM microwave measurements for precipitation profiling, Radio Sci., 38, 8072, 2003.
Di Michele, S., Tassa, A., Mugnai, A., Marzano, F.S., Bauer, P., and Poiares Baptista, J.P.V.: Bayesian Algorithm for Microwave-based Precipitation Retrieval: Description and application to TMI measurements over ocean, IEEE Trans. Geosci. Remote Sens., in press, 2005.
Dudhia, J.: A non-hydrostatic version of the Penn State/NCAR mesoscale model: validation tests and simulation of an Atlantic cyclone and cold front, Mon.Wea. Rev., 121, 1493-1513, 1993.
Kotroni, V., and Lagouvardos, K.: Precipitation forecast skill of different convective parameterization and microphysical schemes: application for the cold season over Greece, Geoph. Res. Let., 108, 1977-1980, 2001.
Mugnai, A., Di Michele, S., Marzano, F.S., and Tassa, A.: Cloud-model based Bayesian techniques for precipitation profile retrieval from TRMM microwave sensors, in Proc. ECMWF/EuroTRMM Workshop on Assimilation of Clouds and Precipitation, ECMWF, Reading, U.K., pp. 323-345, 2001.
Panegrossi, G., Dietrich, S., Marzano, F.S., Mugnai, A., Smith, E.A., Xiang, X., Tripoli, G.J., Wang, P.K., and Poiares Baptista, J.P.V.: Use of cloud model microphysics for passive microwave-based precipitation retrieval: significance of consistency between model and measurement manifolds, J. Atmos. Sci., 55, 1644-1673, 1998.
Smith, E.A., Kummerow, C., and Mugnai, A.: The emergence of inversion-type profile algorithms for estimation of precipitation from satellite passive microwave measurements, Remote Sens. Rev., 11, 211-242, 1994.
Tripoli, G.J.: A nonhydrostatic model designed to simulate scale interaction, Mon. Wea. Rev.,120,1342-1359, 1992.
Tripoli, G.J., Panegrossi, G., Mugnai, A., Dietrich, S., and Smith, E.A.: A numerical study of the Friuli, 1998 and the Genoa, 1992 floods, in 2nd Plinius Conference on Mediterranean Storms, edited by A. Mugnai, F. Guzzetti, and G. Roth, pp. 127-140, 2001.
Fig. 4. Rainfall retrievals based on the MM5 CRD vs. correspond-ing retrievals based on the UW-NMS CRD.
different rainfall retrievals from the AMSR observations of Sect. 2. Figure 4 is a scatterplot of the retrieved precipitation fields, obtained from the UW-NMS and the MM5 CRD’s. This result demonstrates that significant differences (up to 10 mm/hr) may be found for any rain rate regime between the UW-NMS and the MM5 derived rainfall rates – despite their overall similar behavior.
6 Conclusions
This study has clearly demonstrated that: a), important dif-ferences may be found in cloud-radiation databases gener-ated by different cloud resolving models adopting different bulk microphysical schemes – even when the models are used to simulate the same event(s) and all model simula-tions reproduce reasonably well the observed accumulated precipitation and rainfall patterns; and b), these CRD dif-ferences may produce significant difdif-ferences in the retrieved rain rates. This problem has to be seriously tackled in or-der to produce global, reliable and consistent precipitation retrievals. However, it has been so far largely overlooked. This study is a first step towards that direction. In the future, we plan to consider additional case studies and cloud resolv-ing models, so as to achieve more general conclusions and quantify the CRM-effect on rainfall retrieval uncertainties.
Acknowledgements. This study has been supported by the National Group for Prevention from Hydro-geological Hazards (GNDCI) of the Italian National Research Council (CNR), by the Italian Space Agency (ASI), the European Community Initiative INTERREG III B CADSES – RISK AWARE project, and the Greek-Italian collaboration project financed by the General Secretariat for Research and Technology.
Edited by: L. Ferraris
C. M. Medaglia et al.: Impact on passive microwave precipitation retrieval from satellite 199
References
Dietrich, S., Di Michele, S., Kotroni, V., Lagouvardos, K., Medaglia, C. M., Mugnai, A., Panegrossi, G., Smith, E. A., and Tripoli, G. J.: Comparing cloud microphysics and derived mi-crowave signatures generated by different cloud resolving mod-els, in: 5th Plinius Conference on Mediterranean Storms, edited by: Testud, J., Mugnai, A., and Santucci, J.-F., pp. 433–442, 2003.
Di Michele, S., Marzano, F. S., Mugnai, A., Tassa, A., and Poiares Baptista, J. P. V.: Physically-based statistical integration ofTRMM microwave measurements for precipitation profiling, Radio Sci., 38 (4), 8072–8090, 2003.
Di Michele, S., Tassa, A., Mugnai, A., Marzano, F. S., Bauer, P., and Poiares Baptista, J. P. V.: Bayesian Algorithm for Microwave-based Precipitation Retrieval: Description and application to TMI measurements over ocean, IEEE Trans. Geosci. Remote Sens., in press, 2005.
Dudhia, J.: A non-hydrostatic version of the Penn State/NCAR mesoscale model: validation tests and simulation of an Atlantic cyclone and cold front, Mon. Wea. Rev., 121, 1493–1513, 1993. Kotroni, V. and Lagouvardos, K.: Precipitation forecast skill of dif-ferent convective parameterization and microphysical schemes: application for the cold season over Greece, Geophys. Res. Lett., 108, 1977–1980, 2001.
Mugnai, A., Di Michele, S., Marzano, F. S., and Tassa, A.: Cloud-model based Bayesian techniques for precipita-tion profile retrieval from TRMM microwave sensors, in Proc. ECMWF/EuroTRMM Workshop on Assimilation of Clouds and Precipitation, ECMWF, Reading UK, pp. 323–345, 2001. Panegrossi, G., Dietrich, S., Marzano, F. S., Mugnai, A., Smith, E.
A., Xiang, X., Tripoli, G. J., Wang, P. K., and Poiares Baptista, J. P. V.: Use of cloud model microphysics for passive microwave-based precipitation retrieval: significance of consistency between model and measurement manifolds, J. Atmos. Sci., 55, 1644– 1673, 1998.
Smith, E. A., Kummerow, C., and Mugnai, A.: The emergence of inversion-type profile algorithms for estimation of precipitation from satellite passive microwave measurements, Remote Sens. Rev., 11, 211–242, 1994.
Tripoli, G. J.: A nonhydrostatic model designed to simulate scale interaction, Mon. Wea. Rev., 120, 1342–1359, 1992.
Tripoli, G. J., Panegrossi, G., Mugnai, A., Dietrich, S., and Smith, E. A.: A numerical study of the Friuli, 1998 and the Genoa, 1992 floods, in: 2nd Plinius Conference on Mediterranean Storms, edited by: Mugnai, A., Guzzetti, F., and Roth, G., pp. 127–140, 2001.