HAL Id: inserm-00973201
https://www.hal.inserm.fr/inserm-00973201
Submitted on 4 Apr 2014
HAL is a multi-disciplinary open access
archive for the deposit and dissemination of
sci-entific research documents, whether they are
pub-lished or not. The documents may come from
teaching and research institutions in France or
abroad, or from public or private research centers.
L’archive ouverte pluridisciplinaire HAL, est
destinée au dépôt et à la diffusion de documents
scientifiques de niveau recherche, publiés ou non,
émanant des établissements d’enseignement et de
recherche français ou étrangers, des laboratoires
publics ou privés.
Relationship between CT air trapping criteria and lung
function in small airway impairment quantification.
Sébastien Bommart, Grégory Marin, Arnaud Bourdin, Nicolas Molinari,
François Klein, Maurice Hayot, Isabelle Vachier, Pascal Chanez, Jacques
Mercier, Hélène Vernhet-Kovacsik
To cite this version:
Sébastien Bommart, Grégory Marin, Arnaud Bourdin, Nicolas Molinari, François Klein, et al..
Rela-tionship between CT air trapping criteria and lung function in small airway impairment
quantifica-tion.. BMC Pulmonary Medicine, BioMed Central, 2014, 14 (1), pp.29. �10.1186/1471-2466-14-29�.
�inserm-00973201�
R E S E A R C H A R T I C L E
Open Access
Relationship between CT air trapping criteria and
lung function in small airway impairment
quantification
Sébastien Bommart
1,2*, Grégory Marin
3, Arnaud Bourdin
2,4, Nicolas Molinari
3, François Klein
1, Maurice Hayot
2,5,
Isabelle Vachier
4, Pascal Chanez
6, Jacques Mercier
2,5and Hélène Vernhet-Kovacsik
1Abstract
Background: Small airways are regarded as the elective anatomic site of obstruction in most chronic airway diseases. Expiratory computed tomography (CT) is increasingly used to assess obstruction at this level but there is no consensus regarding the best quantification method. We aimed to evaluate software-assisted CT quantification of air trapping for assessing small airway obstruction and determine which CT criteria better predict small airway obstruction on single breath nitrogen test (SBNT).
Methods: Eighty-nine healthy volunteers age from 60 to 90 years old, underwent spirometrically-gated inspiratory (I) and expiratory (E) CT and pulmonary function tests (PFTs) using SBNT, performed on the same day. Air trapping was estimated using dedicated software measuring on inspiratory and expiratory CT low attenuation area (LAA) lung proportion and mean lung density (MLD). CT indexes were compared to SBNT results using the Spearman correlation coefficient and hierarchical dendrogram analysis. In addition, receiver operating characteristic (ROC) curve analysis was performed to determine the optimal CT air-trapping criterion.
Results: 43 of 89 subjects (48,3%) had dN2 value above the threshold defining small airway obstruction (i.e. 2.5% N2/l). Expiratory to inspiratory MLD ratio (r = 0.40) and LAA for the range −850 -1024 HU (r = 0.29) and for the range −850 -910 HU (r = 0.37) were positively correlated with SBNT results. E/IMLDwas the most suitable criterion
for its expression. Expiratory to inspiratory MLD ratio (E/IMLD) showed the highest AUC value (0.733) for small airway
obstruction assessment.
Conclusion: Among all CT criteria, all correlating with small airway obstruction on SBNT, E/IMLDwas the most
suitable criterion for its expression in asymptomatic subjects with mild small airway obstruction Trial registration: Registered at Clinicaltrials.gov, identifier: NCT01230879.
Keywords: Air trapping, Bronchiole, Single breath nitrogen test, Biomarker, Software-assisted CT quantification Background
Chronic airway diseases are obstructive lung disorders oc-curring more and more frequently, therefore becoming a major public health burden worldwide [1]. Severity assess-ment and manageassess-ment of these diseases are defined ac-cording to clinical examination and routine pulmonary function tests (PFTs). However, these measurements are
not strong enough to accurately discriminate patients re-garding clinical outcomes [2]. Chronic obstructive pul-monary disease (COPD) and asthma are the most common causes of such chronic airflow limitation. From a pathophysiological point of view, small airways (defined from 2 mm in internal diameter and downward) are regarded as the underlying elective anatomic level of air-way obstruction for both disorders [3,4], but are inad-equately investigated using conventional PFTs, namely “the lung’s quiet zone” [5]. Specific structural changes at this level can be assessed using tools such as the single-breath or multiple-single-breath nitrogen washout test (SBNT,
* Correspondence:[email protected]
1Radiology Department, CHU Montpellier, 371 avenue Doyen Gaston Giraud
34295, Montpellier cedex 05, France
2INSERM U 1046 Université Montpellier 1, Montpellier 2, Montpellier, France
Full list of author information is available at the end of the article
© 2014 Bommart et al.; licensee BioMed Central Ltd. This is an Open Access article distributed under the terms of the Creative Commons Attribution License (http://creativecommons.org/licenses/by/2.0), which permits unrestricted use, distribution, and reproduction in any medium, provided the original work is properly credited.
MBNT respectively) [6]. SBNT and MBNT are time con-suming and the routine uses are not widely available owing to limited access to the equipment. Due to the fact that expiratory acquisition allows indirect evaluation of bronchiolar involvement [7], computed tomography (CT) has been increasingly put forward as an appropriate non-invasive tool for refinement in the classification and treat-ment monitoring of COPD and asthma [8-14]. The appli-cation of an increasingly wide range of technological tools also allows post-processing by segmentation software and thus quantifies air trapping objectively. Both a decrease in mean lung density and the percentage of low attenuation area on expiratory CT have been used in various study and correlated with disease severity in COPD and asthma [15-17]. Some authors have also suggested the role of paired expiratory to inspiratory ratio or difference as a small airway marker [18-20]. However, the choice of one of these criteria may affect the results and there is, there-fore, a crucial need for standardization in CT air trapping expression.
This prospective study was designed firstly to explore the validity of air trapping software-assisted CT quantifi-cation for the assessment of small airway obstruction by using SBNT as standard of reference and, secondly, to assess which was the most accurate criterion.
Methods
Subjects and eligibility criteria
Between August 2009 and April 2012, we prospectively conducted a cross-sectional study on lung aging. This specific population was chosen to select a range of sub-tle small airway obstruction. Eligible participants were asymptomatic, non-smokers for at least 20 years with a cumulative history <10 pack-years of tobacco use and without a past history of lung disease. Subjects were asked to be in good mental and physical health as assessed by medical interview and physical activity using the Voorips score questionnaire [21]. All the final study participants had normal range spirometry, specifically regarding forced expiratory volume. They were informed of the aims of the study and gave their informed consent for both pulmonary function testing and chest CT.
This study received the approval of the local research ethics committee (CPP sud Méditerranée IV) and the agreement of the French Health Products Safety Agency (ANSM) before the start of the research.
Scanning techniques
All CT examinations were performed using a 64–de-tector row CT scanner (LightSpeed VCT; GE Healthcare, Waukesha, USA) without the administration of contrast material. Patients were placed in the supine position. The entire chest from apex to posterior recesses was in-cluded in the cranio-caudal direction according to the
following protocol: tube voltage: 120 kV, automatic tube current modulation with maximal current limited to 300 mAs, collimation: 64 × 0.6 mm, increment: 0.9, recon-structed slice thickness: 1.25 mm, tube rotation: 0.5 s, acquisition field of view ranged from 320 to 380 mm de-pending on the patient’s body habitus. Each chest CT examination was reconstructed using a standard filter.
Images were acquired using spirometric gating (Win-spiroPRO; Medical International Research Waukesha, USA) to monitor lung volumes and determine respira-tory endpoints. Patients were trained to breathe into a mouthpiece connected to the handheld spirometer after calibration of the spirometer according to manufacturer specifications. Breath-hold was obtained at least 3 times in inspiration and expiration using the spirometric equipment just before CT acquisition in supine position. Image sets were then acquired during single-breath-hold helical scanning between 90 and 100% of previously re-corded slow vital capacity in supine position. Four add-itional slices were acquired in the same conditions at end expiration: one through the upper lobes, one through the tracheal carina and two between the tra-cheal carina and the diaphragm. All DICOM images were anonymously archived and transferred to a dedi-cated computer for post-treatment.
Quantitative assessment of air trapping by CT
De-identified data was processed independently and blindly by a senior radiologist with 8 years of experience interpreting chest CT images (S.B.) and also by a chest radiology fellow (F.K.). Lung parenchyma was automatic-ally isolated from the chest wall, mediastinum and air contained within the segmental bronchi (Additional file 1: Figure S1) and then analyzed using threshold tech-niques and histogram computation in order to quantify lung air trapping objectively and to provide reproducible data with the use of commercially available software (Myrian, Intrasense, Montpellier, France). Measurements were done for the four levels described above combining the values found for both sides at each level. Air trap-ping was defined in expiratory CT as lung regions that failed to increase in attenuation or decrease in volume in a normal fashion compared with findings on the ini-tial inspiratory images [22]. Given the absence of a sin-gle, validated method of CT air trapping quantification, the inspiratory and expiratory chest CT scans were scored in 3 ways, most frequently used in the literature [23].
The percentage of lung parenchyma that fell within a range of low attenuating area (LAA%) was considered representative of air trapping: voxels between −850 and −1024 HU, called exp −850-1024 on expiratory slices were isolated. A second threshold was also applied between −850 and −910 HU (exp −850-910) to avoid
Bommart et al. BMC Pulmonary Medicine 2014, 14:29 Page 2 of 7 http://www.biomedcentral.com/1471-2466/14/29
low-density values due to emphysematous or cystic lesions. Finally, mean lung density was automatically measured.
Expiratory to inspiratory ratio and the difference be-tween these values were calculated. 4 expiratory images were matched visually by using anatomical landmarks with 4 inspiratory images with the same slice thickness from the inspiratory images. E/I, E-I and (E-I)/I were expressed using the two thresholds described above for LAA% and for MLD.
Single breath nitrogen test (SBNT)
SBNT was performed the same day, just before CT scan-ning. This test was used to look specifically for small airway abnormalities. This test was performed as previ-ously reported by Bourdin and colleagues [24], using the Vmax apparatus (Vmax; Sensomedics, Yorba Linda, CA, USA) under the supervision of an expert in clinical physiology (M.H.), blinded to the CT results. Subjects were asked to breathe slowly and deeply to reach re-sidual volume. They were then asked to inhale as deeply as possible to obtain total lung volume capacity at which point the breathing valve started the delivery of 100% O2 gas. Subjects were then asked to exhale immediately at a 0.3–0.5 l/s flow giving visual feedback on the com-puter screen to allow for the procedure to be followed correctly. The fractional expiratory nitrogen concentra-tion was plotted against the expired volume. This helped determine the closing volume and the slope of this rela-tionship when it reached the plateau known as the phase III nitrogen slope (delta N2 or dN2). See the Additional file 2: Figure S2 for the single breath nitrogen washout test curve.
Statistical analysis
Quantitative variables were expressed as means or medians and compared using the Student t test or the Wilcoxon test. Qualitative variables were expressed as numbers (percentages) and compared using the Chi 2 test or the Fisher test as appropriate.
Non-parametric Spearman test was carried out to as-sess the relationship between functional and CT param-eters. Distance and similarity between dN2 and CT air trapping criteria were then analyzed using dendrogram analysis based on the agglomerative hierarchical cluster tree. The best CT parameter was determined using re-ceiver operating characteristic (ROC) curve analysis using standard dN2 cut-off = 2.5% N2/l. To test the diag-nostic consistency of air trapping quantification for the two readers, inter-observer agreement was calculated using intra-class correlation coefficient [25]. A p-value of ≤ 0.05 was considered statistically significant. The stat-istical analysis was performed using statstat-istical software
SAS 9.3 (SAS Institute; Cary, NC), R 2.14.1 and SPSS 17.0 for Windows (SPSS, Chicago, Ill).
Results
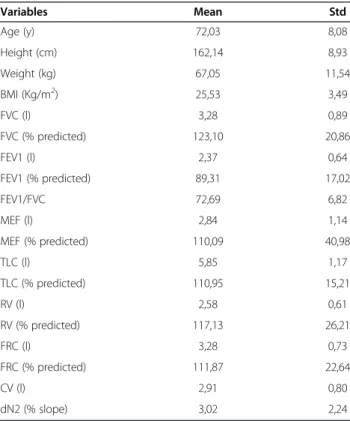
Among the 101 eligible subjects, a total of 89 performed adequate spirometric maneuvers for both PFTs and CT acquisitions. Software-assisted inspiratory and expira-tory lung segmentation was achievable for all these sub-jects. Description of the study population is provided in Table 1.
Intra-class correlation coefficient values
Raw data quantitative air trapping measures were assessed using MLD and LAA% having attenuation below −850 HU or between −850 and −910 HU. The match between the two observers yielded good to excel-lent inter-reader reliability for each (Additional file 3: Table S1). The lowest inter-class correlation coefficient between junior and senior radiologists was 0.91 for the fourth slice EXP-850–910.
Table 1 Demographic and spirometric characteristics of study subjects Variables Mean Std Age (y) 72,03 8,08 Height (cm) 162,14 8,93 Weight (kg) 67,05 11,54 BMI (Kg/m2) 25,53 3,49 FVC (l) 3,28 0,89 FVC (% predicted) 123,10 20,86 FEV1 (l) 2,37 0,64 FEV1 (% predicted) 89,31 17,02 FEV1/FVC 72,69 6,82 MEF (l) 2,84 1,14 MEF (% predicted) 110,09 40,98 TLC (l) 5,85 1,17 TLC (% predicted) 110,95 15,21 RV (l) 2,58 0,61 RV (% predicted) 117,13 26,21 FRC (l) 3,28 0,73 FRC (% predicted) 111,87 22,64 CV (l) 2,91 0,80 dN2 (% slope) 3,02 2,24
Note. Data are means ± standard deviations for quantitative variables. Percentages are expressed as a ratio of measured to predicted values. FVC = forced vital capacity, FEV1 = forced expiratory volume in 1 second, MEF = mid forced expiratory flow, TLC = total lung capacity, RV = residual volume, FRC = functional residual capacity, CV = closing volume, dN2 = phase III nitrogen slope.
Spatial Heterogeneity
As shown in Figure 1, CT air trapping assessed by E/I
MLD ratio obtained at all four levels was statistically
dif-ferent (p = 0.02) but all the four expiratory mean lung density values remained significantly correlated with dN2 as demonstrated by the Spearman correlation coef-ficient (Additional file 4: Table S2).
Comparison of CT indexes for small airway obstruction assessment
43 of 89 subjects (48,3%) had dN2 value above the cut-off (2.5% N2/l).
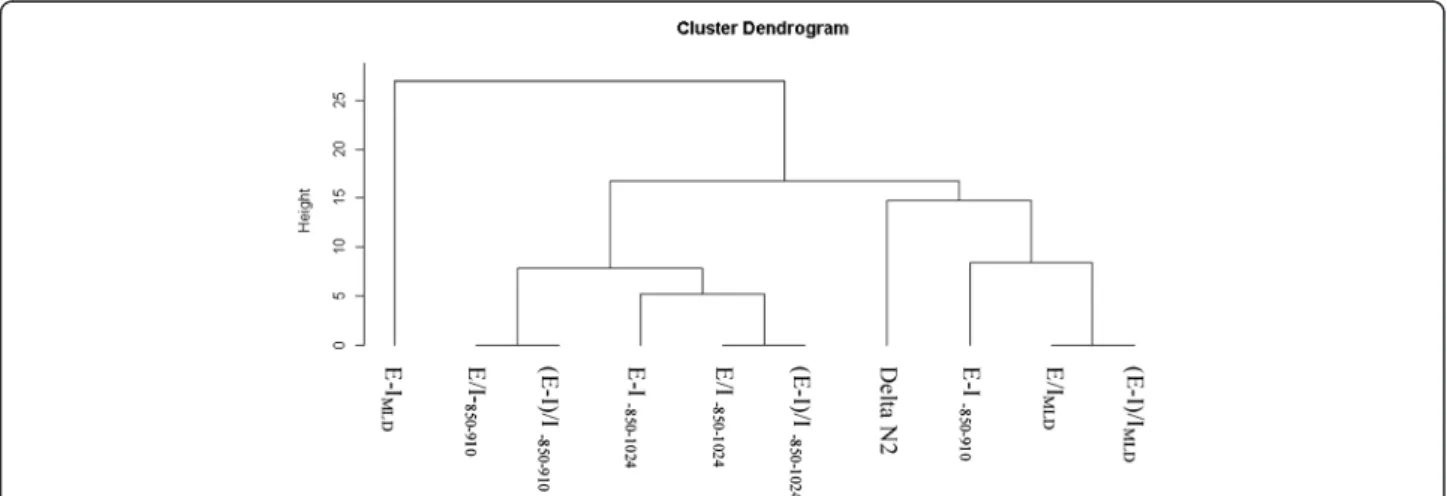
All CT indexes (E/I, (E-I)/I and E-I LAA% or MLD correlated with small airway obstruction, as assessed by dN2 (Additional file 4: Table S2). Figure 2 shows the connection between dN2 and the CT criteria generated by hierarchical dendrogram analysis. The cluster located the furthest from dN2 was E-IMLD. The three branches
the most closely related to dN2 in the cluster dendro-gram (E/IMLD, (E-I)/IMLD, E-I-850–910) were then included
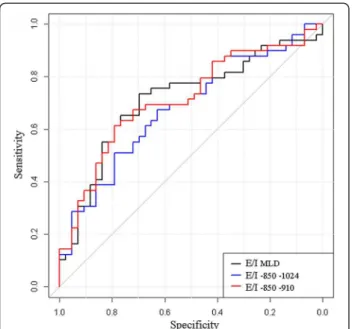
for further ROC curve analysis to determine the criteria that yielded the highest combined sensitivity and specifi-city and thus the highest diagnostic value. The resulting ROC curves are shown Figures 3, 4 and 5. E/IMLD
pro-vided the best area under the curve (AUC) value (0.714 confidence interval: 0.606, 0.822) using dN2 as a re-ference. Similar results were obtained for (E-I)/I. When analysis was performed on the second slice individually, AUC for E/I and (E-I)/I was slightly higher (0.733; 0.630 – 0.836).
Discussion
This study reports a clear relationship between spirome-trically gated CT air trapping quantification and physio-logical measurements of the small airways using SBNT. The strength of the CT quantification technique is its capacity to express small airway obstruction reliably using standard, commercially available, software. Indeed, software-assisted CT air trapping quantification was feasible in our study for all subjects who achieved ad-equate CT acquisitions with a high consistency between observers even for inspiratory images, matched visually by using anatomical landmarks. Expiratory to inspiratory ratio and the difference between these values were calcu-lated to characterize CT air trapping in order to over-come error related to decrease in lung density due to alveolar enlargement likely associated with age [26-28]. E/IMLD and (E-I)/I MLD exhibited the best performance
characteristics to assess small airway obstruction. O. Mets and colleagues recently pointed out that E/IMLD
was related to PFTs [29]. They showed a relationship be-tween residual volume/Total lung volume capacity (RV/ TLC) and E/IMLDin a population of current and former
heavy smokers in a lung cancer screening cohort. None-theless, RV/TLC reflects static lung hyperinflation and
Figure 1 Box plots of air trapping represented by E/IMLDin 4
levels and mean of E/IMLD. Significant differences between slices
were observed (p = 0.0002).
Figure 2 Hierarchical dendrogram analysis to evaluate distance and similarity between dN2 and CT air trapping criteria.
Bommart et al. BMC Pulmonary Medicine 2014, 14:29 Page 4 of 7 http://www.biomedcentral.com/1471-2466/14/29
the value may be influenced either by the presence of small airway obstruction or by emphysema. Further-more, discrimination is possible only in severe cases of hyperinflation. Only 38 of the 427 heavy smokers sub-jects presented abnormal RV/TLC in the Mets study. There is currently no functional test allowing perfect non-invasive assessment of small airways. Nonetheless inert gas washout tests such as SBNT provide infor-mation on ventilation inhomogeneity that allows sensi-tive detection of small airway obstruction even when RV/TLC or other standard spirometry values are normal [30-33]. Our sample population aged 60 and older and the selection criteria used offered a well-defined popu-lation of subjects with a range of small airway obstruc-tion that may be attributed to normal ageing [34,35]. Furthermore, people included in this study achieved reproducible maneuvers that are a key point for SBNT validity [6].
The correlation found in our study between CT and SBNT showed that CT air trapping can detect even mild to moderate small airway obstruction as seen in our sub-jects who were all asymptomatic but nevertheless having physiological modifications. The aim was to validate CT air trapping quantification from a homogeneous model that could be further applied to various chronic obstruc-tion situaobstruc-tions such as COPD or asthma.
Our study has several potential limitations. First, we did not used whole expiratory volume also described for air trapping assessment but only a single set of four
Figure 3 Receiver-operating characteristic (ROC) curves show the diagnostic performance of E/I using dN2 as a functional test of airway obstruction (dN2 cut-off = 2.5% N2/l). The best threshold is reported, alongside the sensitivity and specificity: E/IMLD= 0.89 (0.70; 0.73) – E/I-850–1024= 0.32 (0.63; 0.67) –
E/I-850–910= 0.29 (0.79; 0.61).
Figure 4 Receiver-operating characteristic (ROC) curves show the diagnostic performance of E-I using dN2 as a functional test of airway obstruction (dN2 cut-off = 2.5% N2/l). The best threshold is reported, alongside the sensitivity and specificity: E-IMLD= 90.01 (0.79; 0.63) – E-I-850–1024= −34.24 (0.65; 0.65) –
E-I-850–910= −47.23 (0.81; 0.59).
Figure 5 Receiver-operating characteristic (ROC) curves show the diagnostic performance of (E-I)/I using dN2 as a functional test of airway obstruction (dN2 cut-off = 2.5% N2/l). The best threshold is reported, alongside the sensitivity and specificity: (E-I)/IMLD= −0.11 (0.70; 0.73) – (E-I)/I-850–1024= −0.68 (0.63; 0.67) –
expiratory slices [19,36]. We did this because of the difficulty for subjects to sustain breath-hold at low lung volumes and furthermore in keeping with the recom-mendation made by the ethics committee to limit the radiation dose as well as the “As Low As Reasonably Achievable” principle. We cannot know from this study whether analysis on the whole lung volume would have improved the correlations, nonetheless our results showed similar significant air trapping heterogeneity be-tween the upper, middle, and lower regions to that found by Bankier and colleagues in their work on a lung trans-plant population [37]. Regardless of slice level, each remained significantly associated with dN2. Even if AUC was slightly higher for E/IMLDin slice 2 (i.e. through the
carina), we did not recommend the use of only one ex-piratory slice as its index could not be applied to path-ologies such as asthma, which have been proven to have widely heterogeneous spread [38].
Second, although use of a spirometer to control lung volume during acquisition is not standard practice, in this study it provided proof of inspiration and expiration volume.
Another potential limitation is the lack of emphysema-tous lesions in our population. The elective site of meas-urement should be adapted in COPD patients with such lesions as stated by Matsuoka [39].
Conclusions
Our study demonstrated that in asymptomatic subjects with small airway obstruction, software-assisted CT air trapping quantification correlated with SBNT. E/I and (E-I)/IMLDare equally representative of small airway
ob-struction and could be used as a small airway obstruc-tion biomarker.
Additional files
Additional file 1: Figure S1. Automated quantification of air trapping using segmentation software obtained in a 64-year old woman. Axial expiratory images. Color code: Blue for total lung parenchyma (areas with attenuation of -500 to -1024 HU). Red for attenuation between -850 and -910 HU and green for attenuation less than -910 HU.
Additional file 2: Figure S2. Schematic representation of single breath nitrogen test.
Additional file 3: Table S1. Comparison of the inter-observer agreement (Intra-Class correlation*).
Additional file 4: Table S2. Spearman correlations between Delta N2 and (expiratory/inspiratory) values, for the four slices.
Abbreviations
COPD:Chronic obstructive pulmonary disease; CT: Computed tomography; delta N2: Phase III nitrogen slope; LAA: Low attenuation area; MBNT: Multi breath nitrogen test; MLD: Mean lung density; PFT: Pulmonary function test; ROC: Receiver operating characteristic; RV: Residual volume; SBNT: Single breath nitrogen test; TLC: Total lung volume capacity.
Competing interests
The study was funded by a grant from the French Ministry of Health (Programme Hospitalier de Recherche Clinique 2008). No potential conflicts of interest relevant to this article were reported for any authors.
Authors’ contribution
SB and HK were responsible for the concept and design of the study. SB drafted and wrote the paper. AB participates in the study design and helped to draft the manuscript. GM and NM helped to perform statistical analysis. All authors contributed to the clinical data collection, data analysis and review the manuscript. All authors read and approved the final manuscript. Acknowledgements
We thank all volunteers who participated in this research study and Melina Bouet for her excellent research assistance.
Author details
1
Radiology Department, CHU Montpellier, 371 avenue Doyen Gaston Giraud 34295, Montpellier cedex 05, France.2INSERM U 1046 Université Montpellier
1, Montpellier 2, Montpellier, France.3Statistics Department CHU Montpellier,
Montpellier, France.4Respiratory Disease Department, CHU Montpellier,
Montpellier, France.5Clinical Physiology Department, CHU Montpellier, Montpellier, France.6Respiratory Disease Department, CHU Marseille,
Marseille, France.
Received: 29 August 2013 Accepted: 14 February 2014 Published: 28 February 2014
References
1. Mannino DM, Buist AS: Global burden of COPD: risk factors, prevalence, and future trends. Lancet 2007, 370:765–773.
2. Vestbo J, Hurd SS, Agusti AG, Jones PW, Vogelmeier C, Anzueto A, Barnes PJ, Fabbri LM, Martinez FJ, Nishimura M, Stockley RA, Sin DD, Rodriguez-Roisin R: Global strategy for the diagnosis, management and prevention of chronic obstructive pulmonary disease, GOLD executive summary. Am J Respir Crit Care Med2013, 187(4):347–365.
3. McDonough JE, Yuan R, Suzuki M, Seyednejad N, Elliot WM, Sanchez PG, Wright AC, Gefter WB, Litzky L, Coxson HO, Paré PD, Sin DD, Pierce RA, Woods JC, McWilliams AM, Mayo JR, Lam SC, Cooper JD, Hogg JC: Small-airway obstruction and emphysema in chronic obstructive pulmonary disease. N Engl J Med 2011, 365(17):1567–1575.
4. Timmins SC, Diba C, Farrow CE, Schoeffel RE, Berend N, Salome CM, King GG: The relationship between airflow obstruction, emphysema extent and small airways function in COPD. Chest 2012, 142(2):312–319. 5. Mead J: The lung’s “quiet zone”. N Engl J Med 1970, 282:1318–1319. 6. Robinson PD, Latzin P, Verbanck S, Hall GL, Horsley A, Grappa M, Thamrin C,
Arets HG, Aurora P, Fuchs SI, King GG, Lum S, Macleod K, Paiva M, Pillow JJ, Ranganathan S, Ratjen F, Singer F, Sonnappa S, Stocks J, Subbarao P, Thompson BR, Gustafsson PM: Consensus statement for inert gas washout measurement using multiple- and single- breath tests. Eur Respir J 2013, 41(3):507–522.
7. Laurent F, Latrabe V, Raherison C, Marthan R, Tunon-de-Lara JM: Functional significance of air trapping detected in moderate asthma. Eur Radiol 2000, 10(9):1404–1410.
8. Montaudon M, Lederlin M, Reich S, Begueret H, Tunon-de-Lara JM, Marthan R, Berger P, Laurent F: Bronchial measurements in patients with asthma: comparison of quantitative thin-section CT findings with those in healthy subjects and correlation with pathologic findings. Radiology 2009, 253(3):844–853.
9. Matsuoka S, Yamashiro T, Washko GR, Kurihara Y, Nakajima Y, Hatabu H: Quantitative CT assessment of chronic obstructive pulmonary disease. Radiographics2010, 30(1):55–66.
10. Gupta S, Siddiqui S, Haldar P, Entwisle JJ, Mawby D, Wardlaw AJ, Bradding P, Pavord ID, Green RH, Brightling CE: Quantitative analysis of high-resolution computed tomography scans in severe asthma subphenotypes. Thorax 2010, 65(9):775–781.
11. Mets OM, Schmidt M, Buckens CF, Gondrie MJ, Isgum I, Oudkerk M, Vliegenthart R, de Koning HJ, van der Aalst CM, Prokop M, Lammers JW, Zanen P, Mohamed Hoesein FA, Mali WP, van Ginneken B, van Rikxoort EM, de Jong PA: Diagnosis of chronic obstructive pulmonary disease in lung cancer screening Computed Tomography scans: independent
Bommart et al. BMC Pulmonary Medicine 2014, 14:29 Page 6 of 7 http://www.biomedcentral.com/1471-2466/14/29
contribution of emphysema, air trapping and bronchial wall thickening. Respir Res2013, 186:157–165.
12. Bafadhel M, Umar I, Gupta S, Raj JV, Vara DD, Entwisle JJ, Pavord ID, Brightling CE, Siddiqui S: The role of CT scanning in multidimensional phenotyping of COPD. Chest 2011, 140(3):634–642.
13. Hackx M, Bankier AA, Gevenois PA: Chronic obstructive pulmonary disease: CT quantification of airways disease. Radiology 2012, 265(1):34–48.
14. Brillet PY, Grenier PA, Fetita CI, Beigelman-Aubry C, Ould-Hmeidi Y, Ortner M, Nachbaur G, Adamek L, Chanez P: Relationship between the airway wall area and asthma control score in moderate persistent asthma. Eur Radiol2013, 23(6):1594–1602.
15. Coxson HO, Mayo J, Lam S, Santyr G, Parraga G, Sin DD: New and current clinical imaging techniques to study chronic obstructive pulmonary disease. Am J Respir Crit Care Med 2009, 180(7):588–597.
16. Devakonda A, Raoof S, Sung A, Travis WD, Naidich D: Bronchiolar disorders: a clinical-radiological diagnostic algorithm. Chest 2010, 137(4):938–951. 17. de Jong PA, Vos R, Verleden GM, Vanaudenaerde BM, Verschakelen JA:
Thin-section computed tomography findings before and after azithromycin treatment of neutrophilic reversible lung allograft dysfunction. Eur Radiol 2011, 21(12):2466–2474.
18. Matsuoka S, Kurihara Y, Yagihashi K, Hoshino M, Watanabe N, Nakajima Y: Quantitative assessment of air trapping in chronic obstructive pulmonary disease using inspiratory and expiratory volumetric MDCT. AJR Am J Roentgenol2008, 190(3):762–769.
19. Hersh CP, Washko GR, Estépar RSJ, Lutz S, Friedman PJ, Han MK, Hokanson JE, Judy PF, Lynch DA, Make BJ, Marchetti N, Newell JD Jr, Sciurba FC, Crapo JD, Silverman EK, COPDGene Investigators: Paired inspiratory-expiratory chest CT scans to assess for small airways disease in COPD. Respir Res 2013, 170:301–307.
20. Chae EJ, Kim TB, Cho YS, Park CS, Seo JB, Kim N, Moon HB: Airway measurement for airway remodeling defined by post-Bronchodilator FEV1/FVC in asthma: investigation using inspiration-expiration computed tomography. Allergy Asthma Immunol Res 2011, 3(2):111–117.
21. Voorrips LE, Ravelli AC, Dongelmans PC, Deurenberg P, Van Staveren WA: A physical activity questionnaire for the elderly. Med Sci Sports Exerc 1991, 23(8):974–979.
22. Arakawa H, Webb WR, McCowin M, Katsou G, Lee KN, Seitz RF:
Inhomogeneous lung attenuation at thin-section CT: diagnostic value of expiratory scans. Radiology 1998, 206(1):89–94.
23. Mets OM, Murphy K, Zanen P, Gietma HA, Lammers JW, van Ginneken B, Prokop M, de Jong PA: The relationship between lung function impairment and quantitative computed tomography in chronic obstructive pulmonary disease. Eur Radiol 2012, 22(1):120–128. 24. Bourdin A, Paganin F, Prefaut C, Kieseler D, Godard P, Chanez P: Nitrogen
washout slope in poorly controlled asthma. Allergy 2006, 61(1):85–89. 25. Shrout PE, Fleiss JL: Intraclass correlations: uses in assessing rater
reliability. Psychol Bull 1979, 86(2):420–428.
26. Waters B, Owers-Bradley J, Silverman M: Acinar structure in symptom-free adults by Helium-3 magnetic resonance. Am J Respir Crit Care Med 2006, 173(8):847–851.
27. Verbanck S, Thompson BR, Schuermans D, Kalsi H, Biddiscombe M, Stuart-andrews C, Hanon S, Van Muylem A, Paiva M, Vincken W, Usmani O: Ventilation heterogeneity in the acinar and conductive zones of the normal ageing lung. Thorax 2012, 67(9):789–795.
28. Gillooly M, Lamb D: Airspace size in lungs of lifelong non-smokers: effect of age and sex. Thorax 1993, 48(1):39–43.
29. Mets OM, Zanen P, Lammers JW, Isgum I, Gietema HA, van Ginneken B, Prokop M, de Jong PA: Early identification of small airways disease on lung cancer screening CT: comparison of current air trapping measures. Lung2012, 190(6):629–633.
30. Gennimata SA, Palamidas A, Karakontaki F, Kosmans EN, Koutsoukou A, Loukides S, Koulouris NG: Pathophysiology of evolution of small airways disease to overt COPD. COPD 2010, 7(4):269–275.
31. Bourdin A, Kotsimbos T, Nguyen K, Vachier I, Mainprice B, Farce M, Paganin F, Marty-Ané C, Vernhet H, Godard P, Chanez P: Non-invasive assessment of small airway remodelling in smokers. COPD 2010, 7(2):102–110. 32. Cosio M, Ghezzo H, Hogg JC, Corbin R, Loveland M, Dosman J, Macklem PT:
The relations between structural changes in small airways and pulmonary-function tests. N Engl J Med 1978, 298(23):1277–1281.
33. Burgel PR: The role of small airways in obstructive airway diseases. Eur Respir Rev2011, 20(119):23–33.
34. Hansell DM: Thin-section CT, of the lungs: the Hinterland of normal. Radiology2010, 256(3):695–711.
35. Meyer KC: Impact of aging on the lung. Semin Respir Crit Care Med 2010, 31(5):519–520.
36. Galbán CJ, Han MK, Boes JL, Chughtai KA, Meyer CR, Johnson TD, Galbán S, Rehemtulla A, Kazerooni EA, Martinez FJ, Ross BD: Computed tomography-based biomarker provides unique signature of COPD phenotypes and disease progression. Nat Med 2012, 18(11):1711–1715. 37. Bankier AA, Mehrain S, Kienzl D, Weber M, Estenne M, Gevenois PA:
Regional heterogeneity of air trapping at expiratory thin-section CT of patients with bronchiolitis: potential implications for dose reduction and CT protocol planning. Radiology 2008, 247(3):862–870.
38. Aysola R, de Lange EE, Castro M, Altes TA: Demonstration of the heterogeneous distribution of asthma in the lungs using CT and hyperpolarized helium-3 MRI. J Magn Reson Imaging 2010, 32(6):1379–1387.
39. Matsuoka S, Kurihara Y, Yagihashi K, Nakajima Y: Quantitative assessement of peripheral airway obstruction on paired expiratory/inspiratory thin-section computed tomography in chronic obtructive pulmonary disease with emphysema. J Comput Assist Tomogr 2007, 31(3):384–389.
doi:10.1186/1471-2466-14-29
Cite this article as: Bommart et al.: Relationship between CT air trapping criteria and lung function in small airway impairment quantification. BMC Pulmonary Medicine2014 14:29.
Submit your next manuscript to BioMed Central and take full advantage of:
• Convenient online submission
• Thorough peer review
• No space constraints or color figure charges
• Immediate publication on acceptance
• Inclusion in PubMed, CAS, Scopus and Google Scholar
• Research which is freely available for redistribution
Submit your manuscript at www.biomedcentral.com/submit