https://doi.org/10.13140/RG.2.1.1908.2962
Vous avez des questions? Nous pouvons vous aider. Pour communiquer directement avec un auteur, consultez la première page de la revue dans laquelle son article a été publié afin de trouver ses coordonnées. Si vous n’arrivez pas à les repérer, communiquez avec nous à [email protected].
Questions? Contact the NRC Publications Archive team at
[email protected]. If you wish to email the authors directly, please see the first page of the publication for their contact information.
https://publications-cnrc.canada.ca/fra/droits
L’accès à ce site Web et l’utilisation de son contenu sont assujettis aux conditions présentées dans le site LISEZ CES CONDITIONS ATTENTIVEMENT AVANT D’UTILISER CE SITE WEB.
READ THESE TERMS AND CONDITIONS CAREFULLY BEFORE USING THIS WEBSITE.
https://nrc-publications.canada.ca/eng/copyright
NRC Publications Archive Record / Notice des Archives des publications du CNRC :
https://nrc-publications.canada.ca/eng/view/object/?id=9deaa3bf-ed66-4b3c-9824-f179a96c0b18
https://publications-cnrc.canada.ca/fra/voir/objet/?id=9deaa3bf-ed66-4b3c-9824-f179a96c0b18
NRC Publications Archive
Archives des publications du CNRC
For the publisher’s version, please access the DOI link below./ Pour consulter la version de l’éditeur, utilisez le lien DOI ci-dessous.
Access and use of this website and the material on it are subject to the Terms and Conditions set forth at
The circular secondary structure uncertainty plot (CS2-UPlot) -
visualizing RNA secondary structure with base pair binding
probabilities
The Circular Secondary Structure Uncertainty Plot (CS
2
-UPlot
)
-Visualizing RNA Secondary Structure with Base Pair Binding
Probabilities
Dan Tulpan
Abstract—The Circular Secondary Structure Uncertainty Plot (CS2-UPlot) is an intuitive visual representation of an RNA secondary structure that includes the uncertainty of all possible base pairings. The CS2-UPlotuses a chord diagram layout and is comprised of 3 concentric graphical layers representing the three main information components of an RNA secondary structure required by the BioVis 2015 Design challenge: (i) the RNA sequence (outer layer), (ii) uncertainty and free energy (mfe) scatter plots for each base (middle layer) and, (iii) uncertainty and minimum free energy (mfe) base pairings (inner layer). The CS2-UPlotchallenges the classical ways of representing RNA secondary structures and combines base pairings with dot-plot values in a single graphical representation capable of assisting biologists in quickly spotting similarities and differences among a large number of secondary structures and their corre-sponding RNA sequences. Availability: Figures can be downloaded from:http://www.nrcbioinformatics.ca/cs2uplot/
1 THECHALLENGES
The BioVis 2015 Design Competition includes two challenges: uncer-tainty visualization and sequence evolution visualization. My solution is designed to mainly address the first challenge, while it can be part of a solution for the second challenge, too, as it will be described in the following sections.
First, I will extrapolate lists of requirements that capture the main desired features for solutions to each challenge. I will use these re-quirements to design a solution and to determine to what extent the solution addresses each challenge.
The required features forChallenge 1 are: (1.1) display the RNA sequence, (1.2) visualization of base pairing probabilities represented in the top-right triangle of the table associated with the dot-plot, (1.3) visualization of base-pairings corresponding to themfe structure rep-resented in the bottom-left triangle of the table associated with the dot-plot (optional since themfe secondary structure already presents this), (1.4) must be a static picture.
The required features forChallenge 2 are loosely defined as follows:
(2.1)supports comparison of predicted RNA structures, (2.2) ability to identify changes in the RNA sequence that influence its structural stability, (2.3) must be one or more static pictures.
2 THESOLUTION
Challenge 1 mainly requires an intuitive mean to visualize sparse tab-ular information, with the constraint that the (x,y) coordinates for each uncertainty value in the table corresponds to a base pair in an RNA se-quence, whosemfe secondary structure is known and typically repre-sented as a graph. Based on these constraints, my choice is to open-up and map the typicalmfe secondary structure representation of the RNA sequence on a circular plot much in the same fashion as Circos [1] represents linear genomes and their interactions, inter-dependencies and features. In the interest of time the Circos graphical library was employed to implement an automatic process that produces the plots presented in this manuscript. Alternatively, the D3.js JavaScript li-brary can also be used for the same purpose. I also acknowledge that simplified versions of circular plots were used for RNA structure rep-resentations as early as 1978 [2], nevertheless they represented only one type of information such asmfe secondary structures.
Figures 1, 2, 3 and 4 provide a first glimpse of the more ad-vanced visualization method proposed in this manuscript. For a lack
• Dan Tulpan is with the National Research Council Canada. E-mail:
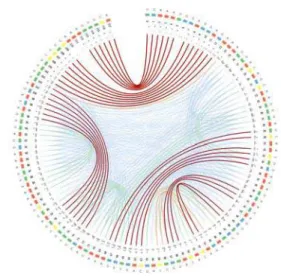
Fig. 1. The CS2-UPlotof the HAR1 ncRNA in ancestral chimp.
of better words, I called this plot type a Circular Secondary Structure
Uncertainty Plot (CS2-UPlot).
A CS2-UPlotconsists of 3 concentric layers of information: (outer layer) the RNA sequence, (middle layer) the uncertainty and minimum free energy (mfe) mini scatter plots for each base and, (inner layer) the uncertainty andmfe base pairings.
The outer layer (RNA sequence) consists of 4 types of equally spaced blocks colored corresponding to their base content (A, C, G and U). Each base and its corresponding position in the sequence (counting starts at 0) is displayed around each block. This addresses requirement
1.1.
The middle layer represents a mini scatter plot for each RNA base4. The height and color intensity (gray scale) of each dot on the plot mark its pairing probability, while its x-location within a narrow segment that signifies the whole sequence suggests the relative location of the corresponding base pair on the RNA sequence. The density of the dots in a scatter plot is tightly related to the interaction capacity of each base in a given structural conformation. The higher the number of dots in the scatter lot, the more potential base pairings that base can form. This partially addresses requirement 1.2, which will be fully addressed by the inner layer.
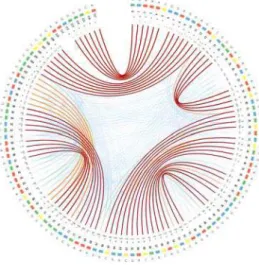
Fig. 2. The CS2-UPlotof the HAR1 ncRNA in Denisovan.
Fig. 3. The CS2-UPlotof the HAR1 ncRNA in human.
Fig. 4. A close-up view of the CS2-UPlotof the HAR1 ncRNA in human.
The inner layer consists of a set of colored arches that connect base pairs on the RNA sequence, which signify hydrogen bonds depicted by short segments in a typical graph-based RNA secondary structure representation. The arch colors (currently using a 5-color palette
as-signed to uncertainty values within 0.2 unit intervals span the interval [0,1]) are assigned based on the corresponding uncertainty probabili-ties, ranging from blue (less stable) to dark orange (more stable) with green representing medium stable base pairs. The thickness of each arch is also proportional with the uncertainty probabilities using 5 in-cremental sizes ranging from 1 (less stable) to 9 (more stable). Com-plemented by scatter plots, this representation addresses requirement
1.2. The dark red arches represent themfe base pairing corresponding to the most stable interactions. Thus requirement 1.3 is also addressed. The next section will explain how to interpret the information de-picted in the CS2-UPlotsand will shed light on how the plots can be used to address the requirements forChallenge 2.
3 THEINTERPRETATION
The information represented in Figures1,2and3can be interpreted based on predominance and localization of various visual cues re-lated to color and position. For example, the CS2-UPlotof the HAR1 ncRNA ancestral chimp sequence shows a fairly large number of low and medium base-pair probabilities (blue and green arches) localized in two areas of the RNA sequence between base pairs 19 and 35, and between base pairs 47 and 95. Subsequently, the plot also displays a fairly large subsequence with no base pairings between positions 14 and 28. By comparison, the corresponding subsequences in Denisovan and human HAR1 ncRNAs, contain a solid 4 base-pair stem formed due to 2 consecutive base pair mutations at positions 14-15 and 25-26 replacing the AA/UU base pairs in chimp with the more stable CG/GC in Denisovan and human.
A total of 17 single and consecutive base pair mutations (positions 5, 14-15, 25-26, 32, 40, 43, 53, 56, 63, 65, 72, 87, 93 and 112) can be identified between the ancestral chimp and Denisovan HAR1 ncRNAs, while only one mutation (U replaced by C) at position 46 occurred be-tween the Denisovan and human HAR1 ncRNAs. The large number of mutations that distinguish the Denisovan from the chimp RNA se-quences apparently caused not only the apparition of a new 4 base pair stem between positions 14-17 and 23-26 in Denisovan, but caused also the breakdown of an existing 7 base pair stem between positions 73-79 and 96-102 in ancestral chimp and the creation of 2 neighbouring 4 and 5 base pair stems in Denisovan bordered by positions 68-72/92-96 and 74-77/87-90. The orange arches in the Denisovan HAR1 CS2 -UPlotsuggest the existence of a powerful energetic pressure to re-create the ancestral chimp stem between positions 73-79 and 96-102. This stem re-appears in the human HAR1 ncRNA secondary structure due to changes in stem structures between positions 27-46 and 51-66. We can also notice in the CS2-UPlot that the human secondary structure is by far the most stable out of all three HAR1 structures given the sparsity of stronger base pairing probabilities (less orange and green arches).
4 FUTURE IMPROVEMENTS AND USABILITY
The comparison of multiple RNA secondary structures using the CS2
-UPlotcan be also achieved by combining on a single plot all concen-trical layers representing the corresponding sequences and the uncer-tainty base pairings. The only modification that is required is to use different color palettes (one for each RNA sequence) for arch color-ing, which in turn might limit the total number of sequences that can be represented and compared in this fashion to 6 or 7. The superpo-sition of concentrical rings representing the base sequences will also allow a fast identification of base pair mutations as opposed to looking at separate plots.
REFERENCES
[1] M. I. Krzywinski, J. E. Schein, I. Birol, J. Connors, R. Gascoyne, D. Hors-man, S. J. Jones, and M. A. Marra. Circos: An information aesthetic for comparative genomics. Genome Research, 19(9):1639–1645, 2009. [2] R. Nussinov, G. Pieczenik, J. R. Griggs, and D. J. Kleitman. Algorithms
for loop matchings. SIAM Journal on Applied Mathematics, 35(1):68–82, 1978.