Publisher’s version / Version de l'éditeur:
The Journal of Physical Chemistry A, 122, 6, pp. 1560-1573, 2018-01-16
READ THESE TERMS AND CONDITIONS CAREFULLY BEFORE USING THIS WEBSITE. https://nrc-publications.canada.ca/eng/copyright
Vous avez des questions? Nous pouvons vous aider. Pour communiquer directement avec un auteur, consultez la première page de la revue dans laquelle son article a été publié afin de trouver ses coordonnées. Si vous n’arrivez pas à les repérer, communiquez avec nous à [email protected].
Questions? Contact the NRC Publications Archive team at
[email protected]. If you wish to email the authors directly, please see the first page of the publication for their contact information.
NRC Publications Archive
Archives des publications du CNRC
This publication could be one of several versions: author’s original, accepted manuscript or the publisher’s version. / La version de cette publication peut être l’une des suivantes : la version prépublication de l’auteur, la version acceptée du manuscrit ou la version de l’éditeur.
For the publisher’s version, please access the DOI link below./ Pour consulter la version de l’éditeur, utilisez le lien DOI ci-dessous.
https://doi.org/10.1021/acs.jpca.7b11558
Access and use of this website and the material on it are subject to the Terms and Conditions set forth at
Methylammonium cation dynamics in methylammonium lead halide
perovskites: a solid-state NMR perspective
Bernard, Guy M.; Wasylishen, Roderick E.; Ratcliffe, Christopher I.; Terskikh,
Victor; Wu, Qichao; Buriak, Jillian M.; Hauger, Tate
https://publications-cnrc.canada.ca/fra/droits
L’accès à ce site Web et l’utilisation de son contenu sont assujettis aux conditions présentées dans le site LISEZ CES CONDITIONS ATTENTIVEMENT AVANT D’UTILISER CE SITE WEB.
NRC Publications Record / Notice d'Archives des publications de CNRC:
https://nrc-publications.canada.ca/eng/view/object/?id=9387bcf5-03c3-43cb-bdae-b3e49e5a4aa5 https://publications-cnrc.canada.ca/fra/voir/objet/?id=9387bcf5-03c3-43cb-bdae-b3e49e5a4aa5
Methylammonium Cation Dynamics in Methylammonium Lead
Halide Perovskites: A Solid-State NMR Perspective
Guy M. Bernard,
†Roderick E. Wasylishen,
*
,†Christopher I. Ratcliffe,
‡Victor Terskikh,
§Qichao Wu,
†Jillian M. Buriak,
†and Tate Hauger
† †Gunning-Lemieux Chemistry Centre, University of Alberta, 11227 Saskatchewan Drive NW, Edmonton, Alberta, Canada T6G 2G2 ‡
National Research Council Canada, 100 Sussex Drive, Ottawa, Ontario, Canada K1A 0R6 §
Department of Chemistry, University of Ottawa, 10 Marie Curie Private, Ottawa, Ontario, Canada K1N 6N5
*
S Supporting InformationABSTRACT: In light of the intense recent interest in the
methylammonium lead halides, CH3NH3PbX3 (X = Cl, Br, and I)
as sensitizers for photovoltaic cells, the dynamics of the methylammonium (MA) cation in these perovskite salts has been reinvestigated as a function of temperature via 2H, 14N, and 207Pb
NMR spectroscopy. In the cubic phase of all three salts, the MA cation undergoes pseudoisotropic tumbling (picosecond time scale). For example, the correlation time, τ2, for the C−N axis of the iodide
salt is 0.85 ± 0.30 ps at 330 K. The dynamics of the MA cation are essentially continuous across the cubic ↔ tetragonal phase transition; however,2H and14N NMR line shapes indicate that subtle ordering
of the MA cation occurs in the tetragonal phase. The temperature dependence of the cation ordering is rationalized using a six-site model, with two equivalent sites along the c-axis and four equivalent
sites either perpendicular or approximately perpendicular to this axis. As the cubic ↔ tetragonal phase transition temperature is approached, the six sites are nearly equally populated. Below the tetragonal ↔ orthorhombic phase transition,2H NMR line
shapes indicate that the C−N axis is essentially frozen.
■
INTRODUCTIONThe methylammonium (MA) lead halides CH3NH3PbX3(X =
Cl, Br, and I) were first prepared and shown to have a cubic perovskite structure by Weber in 1978.1 The color of the compounds, cream white (X = Cl), reddish orange (X = Br), and black (X = I), led to the suggestions of a charge-transfer nature of the Pb−X bonds and the possibility of photo-conduction.1,2These compounds were also of interest because the position of the methylammonium (MA) cation is not fixed by the crystal structure,3,4 although it is known to reside in a cuboctahedal cage formed by 12 X atoms. In 1985, using 2H
and14N solid-state NMR spectroscopy, we found evidence that
the MA cation in these compounds undergoes rapid effectively isotropic motion in the cubic phases (picosecond time scale).3 We also identified two lower-temperature phases for the bromide and iodide, and at least one other phase for the chloride. In 1987, Poglitsch and Weber used X-ray diffraction to demonstrate that the lower-temperature phases of these compounds are tetragonal and orthorhombic (Scheme 1).4 These authors also reported millimeter-wave spectroscopic data that demonstrated picosecond relaxation processes in the cubic and tetragonal phases. Later, we used adiabatic calorimetry to characterize the phase transitions in these three compounds2as well as 2H NMR spectroscopy to confirm that there is an
ordering of the MA cations taking place in the tetragonal phase as one cools the sample (Scheme 2). Similar calorimetric data were also reported by Onoda-Yamamuro et al.5In 1991, Xu et al.6 reported the temperature dependence of the 1H NMR
spin−lattice relaxation times for these compounds, as well as
35Cl,81Br, and127I nuclear quadrupole resonance (NQR) data.
Using neutron diffraction, Swainson, Knop, and co-workers reported the low-temperature orthorhombic structures of MAPbBr3in 20038and MAPbCl3in 2005.9Lattice parameters
Received: November 23, 2017 Revised: January 9, 2018 Published: January 16, 2018
Scheme 1. Phase Transitions for MAPbX3Perovskites2,5
pubs.acs.org/JPCA
Cite This:J. Phys. Chem. A 2018, 122, 1560−1573
for both compounds were determined over a wide temperature range. The changes in structure at the cubic−tetragonal phase transition have also been investigated by Mashiyama et al.10 The structures of the MAPbX3 compounds have been the
subject of several studies;7−15
for the iodide, we believe that one of the most comprehensive is the neutron powder diffraction data of Weller et al. acquired at 100, 180, and 352 K (Scheme 2).7 In addition, the recent time-of-flight neutron and synchrotron X-ray powder diffraction study of Whitfield et al. provided important insights.15In the orthorhombic phase, the space group is Pnma, in the tetragonal phase it is I4/mcm, and in the cubic phase it is Pm3̅m.
Prior to 2009, interest in these compounds was primarily confined to the solid-state-chemistry community,16but in that year, Kojima et al. reported that MAPbI3 can be used as a
visible-light sensitizer for photovoltaic cells.17 Although the initial photoconversion efficiency was only a few percent, conversion efficiencies using organometallic lead hybrid perovskites that exceed 20% are currently being reported.18−24 Charge carrier lifetimes are intimately tied to photovoltaic performance, and for lead halide perovskites, the dynamics of the cation play a key role.25 Higher rotational momentum of the cation rotor is correlated to better orbital overlap, more facile polaron formation, and thus lower charge carrier recombination and a higher fill factor, leading to higher solar cell efficiencies.26,27 A complete understanding of the dynamics of these cations within the perovskite materials is critical for improving, in a rational fashion, the optoelectronic performance.28−31
The utility of solid-state NMR spectroscopy in the characterization of these materials is illustrated by the numerous recent studies. Baikie et al.13 used 1H and 13C
NMR results to investigate the nature of the MA dynamics in the MAPbX3 compounds which help refine some X-ray and
neutron diffraction data on these compounds. Roiland and co-workers32undertook a multinuclear magnetic resonance study of these compounds to investigate their local order and dynamics. Kubicki et al.26 used variable temperature (VT) solid-state NMR to investigate the reorientation dynamics for a series of mixed-cation perovskites; on the basis of2H and14N
NMR measurements, the authors conclude that the formami-dinium cation rotates faster than does the MA cation, despite the greater size of the former. This group also used multinuclear (13C, 14N, 39K, 87Rb, and 133Cs) magnetic
resonance to investigate the atomic-level structure of bulk perovskites.33 Senocrate et al.34 used multinuclear solid-state magnetic resonance and other experimental techniques including 127I NQR to investigate the behavior of the iodine
ions in CH3NH3PbI3. Askar and co-workers investigated
MAPbI3 and its decomposition products via 1H, 13C, and 207Pb solid-state NMR spectroscopy.35
Kentgens and co-workers reported results of a VT 14N and 207Pb solid-state
NMR and127I NQR study of MAPbI
3. These authors conclude
that the MA cation is two-dimensionally disoriented (i.e., restricted to the ab-plane) in the tetragonal phase.36Rosales et al.18 used 207Pb NMR spectroscopy to characterize
mixed-halide nano- and microcrystalline Pb perovskites. Previously, this research group also used 207Pb NMR spectroscopy to
investigate mixed-halide perovskites.37Finally, we have recently proposed that the high sensitivity of the207Pb chemical shifts
for MAPbCl3 make this an ideal material for NMR
thermometry.38
Our goal in this work is to present a comprehensive VT2H
and 14N NMR investigation of the methylammonium lead
halide perovskites. NMR line shapes and relaxation data are used to characterize the dynamics of the MA cation in all three MAPbX3 perovskites, with a focus on MAPbI3. For
completeness, we also present 207Pb VT NMR data of these perovskites.
■
NMR BACKGROUND2H or 14N NMR Line Shapes. The nuclear quadrupolar
coupling constant, CQ, is defined as eQVzz/h, where eQ is the
nuclear quadrupole moment of the quadrupolar nucleus and Vzz is the largest principal component of the electric field gradient (EFG) tensor. The quadrupolar asymmetry parameter, ηQ, is
defined as (Vxx−Vyy)/Vzz, where |Vxx|≤ |Vyy|≤ |Vzz|. Note that the trace of the EFG tensor is zero; i.e., Vxx+ Vyy+ Vzz= 0. For
2H and14N, both I = 1 nuclei, the nuclear quadrupole moments
are 2.860 and 20.44 mb, respectively.39Figure 1illustrates the powder pattern expected for such nuclei if ηQ = 0 (i.e., Vxx = Vyy), in the absence of motion incorporating the observed nucleus. For example, in the absence of motion, CQ(2H) values
for 2H nuclei within C−D bonds are typically approximately
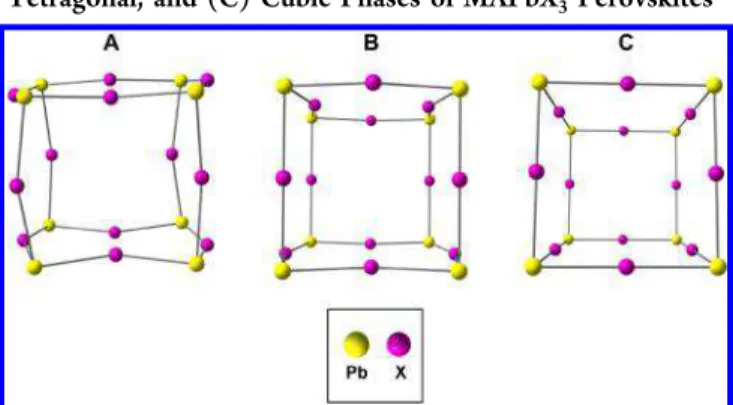
Scheme 2. Asymmetric Units for (A) Orthorhombic, (B) Tetragonal, and (C) Cubic Phases of MAPbX3Perovskites
a
a
The MA cation, which exhibits dynamic disorder (see text), is not shown. Structures shown here were derived from those reported by Weller et al. for MAPbI3at 100 (A), 180 (B), and 352 K (C).7
Figure 1.Powder pattern expected for I = 1 nuclei with ηQ= 0. The relationship between CQand the breadth of the spectrum illustrated on the lower trace is only observed in the absence of motion. The upper trace illustrates the effect on the spectrum if the nuclei are subject to rapid C3jumps about an axis where φ = 109.47° (i.e., νQS= (1/4)CQ).
160 kHz40 and, with ηQ ≈ 0, the approximate separation
between the maxima, νQS, is 120 kHz.
Significant motion of the nucleus modifies the observed line shape.41−46For example, at temperatures slightly below that for the tetragonal ↔ orthorhombic phase transitions, the2H NMR
spectra for the CH3ND3+ cation of the three perovskites
considered here exhibit axially symmetric powder patterns with νQSvalues of approximately 40 kHz. As discussed in our earlier work on these samples2,3 as well as in an investigation of CH3ND3NO3,47 such a value for νQS indicates that the C−N
axis is restricted to small amplitude wobbling moderated by rapid C3 jumps of the ND3group about the C−N axis. Such
motion reduces the observed pattern by a factor (3 cos2φ −
1)/2, where φ defines the angle formed by the C−D or N−D bonds with the axis of rotation.41,45,46If one assumes that φ = 109.47° (i.e., tetrahedral bonding), then νQS is reduced by a
factor of 1/3, from ≈120 to ≈40 kHz, as illustrated inFigure 1. Significant reduction of νQSbelow 40 kHz indicates motion of
the C−N axis, which, in favorable cases, may be modeled (vide infra).
NMR Relaxation of Spin I = 1 Nuclei.In general, for spin
I = 1 quadrupolar nuclei such as 2H or 14N, the main spin−
lattice relaxation mechanism is the quadrupolar mechanism
π η ω ω = = + + ⎛ ⎝ ⎜ ⎜ ⎞ ⎠ ⎟ ⎟ R T C J J 1 3 80(2 ) 1 3 [ ( ) 4 (2 )] 1 Q 1Q Q 2 Q 2 0 0 (1)
where R1Q is the rate of relaxation (s−1) via the quadrupolar
mechanism and T1Q is the spin−lattice relaxation time due to
quadrupolar relaxation (note thateq 1is only valid for nuclei with spin I = 1).48−52J(ω
0) and J(2ω0) are spectral densities
that are Fourier transforms of autocorrelation functions,48,49 where ω τ ω τ = + J( ) 2 1 0 c 02c2 (2)
In the cubic phases of the three MA lead halides, reorientation of the MA cation is extremely rapid with effective rotational correlation times, τc, less than 10−9s (vide infra). Under these
conditions (ω0τc)2 ≪1 and J(ω0) = J(2ω0) = 2τc, thus eq 1
reduces to50−52 π η τ = = + ⎛ ⎝ ⎜ ⎜ ⎞ ⎠ ⎟ ⎟ R T C 1 3 8(2 ) 1 3 1 Q 1Q Q 2 Q 2 c (3)
Since, for the2H and14N nuclei of the MA cation, η
Q≈0,eq 3 further reduces to π τ = = R T C 1 3 2 1 Q 1Q 2 Q 2 c (4)
In the limit where the molecule is undergoing rotational diffusion, the effective NMR correlation time, τc= τ2. Note
τ = + l l D 1 ( 1) l (5)
where D is the rotational diffusion constant, and l is the order of the spherical harmonics (for NMR, l = 2; for dielectric relaxation, l = 1), thus τ1= 3τ2.53−55For a prolate symmetric
top, such as CH3NH3+, the relaxation of the14N nucleus probes
the motion of the C3 symmetry axis. On the other hand,
relaxation of the2H nuclei depends on both the motion of the
C3symmetry axis and motion about this symmetry axis.48,56−58 The relationship between τc and the rotational diffusion
constants parallel and perpendicular to the C3 axis, D∥ and D⊥, respectively, is given by τ = θ− + θ θ θ + + + ⊥ ⊥ ⊥ D D D D D (3 cos 1) 24 3 sin cos 5 0.75 sin 2 4 c 2 2 2 2 4 (6)
For the14N nucleus of the methylammonium cation, θ = 0°,
(3 cos2θ −1)2= 4, and thus
τ = ⊥ D ( N) 1 6 c 14 (7)
If one assumes that the C−N−2H angle is 109.47°, then
τ = + + + + ⊥ ⊥ ⊥ D D D D D ( H) 1/9 6 8/27 5 16/27 2 4 c 2 (8)
Clearly, a rotational diffusion model allows one to obtain both
D⊥ and D∥; however, this is no doubt a rough model,
particularly in the tetragonal phase where quadrupolar splittings are observed. Note that the NMR rotational correlation time for14N is simply τ
2or τ⊥.
Critical Phenomena. In solids that exhibit solid−solid phase transitions, the temperature dependence of the physical properties (e.g., lattice parameters, magnetic properties, electric field gradients) can often exhibit critical phenomena.59 For example, νQScan be described by an equation of the form
νQS=a T( c−T)n (9) where Tc is the phase transition temperature, a is here
expressed in units of kilohertz, and n is the critical exponent.2,11,15,59,60 Kawamura et al. found that lattice parameters for the tetragonal phase of MAPbI3are proportional
to (Tc− T)nwith n = 0.42.11
■
EXPERIMENTAL SECTIONDeuterium NMR spectra of MAPbX3or of MAX (X = Cl, Br, I)
were obtained at 11.75 T on a Bruker Avance NMR spectrometer and at 21.1 T on a Bruker Avance II NMR spectrometer, operating at 76.8 and 138.1 MHz, respectively. The samples were2H-enriched at either the carbon or nitrogen
of the MA cation. Spectra of the samples in the cubic phase were acquired with single-pulse excitation, while those for samples in the tetragonal or orthorhombic phases were acquired with a solid-echo pulse sequence (π/2−τ1−π/2−τ2−
ACQ, where τ1 and τ2, the interpulse and refocusing delays,
respectively, were set to 30 to 50 μs and ACQ is the acquisition time); the resulting free induction decays were left shifted to remove points prior to the echo maxima. π/2 pulses were 5.0 or 8.0 μs for spectra acquired at 11.75 and 21.1 T, respectively. For spectra of the sample in the cubic phase, T1relaxation data
were obtained with the standard inversion−recovery pulse sequence (π−τir−π/2−ACQ, where τir is the variable delay);
for the broader NMR powder patterns of the sample in the tetragonal phase, a solid-echo series of pulses was incorporated into the inversion recovery pulse sequence (i.e., π−τir−π/2
−τ1−π/2−τ2−ACQ). Recycle delays ranged from 2 s for
spectra acquired at lower temperatures (vide infra) to 120 s for those acquired at higher temperatures. Spectra, acquired with
1H decoupling, were referenced to TMS (δ(2H) = 0.0 ppm) by
setting the2H peak of D
were packed in 4 mm zirconia rotors; at 11.75 T, a Bruker 4 mm MAS probe was used to acquire the data, while at 21.1 T the rotor was placed into a 5 mm outer diameter glass tube and the spectra were acquired with a Bruker 5 mm H/X solenoid probe.
Nitrogen-14 NMR spectra for the MAPbX3 samples were
acquired at 36.1 and 64.5 MHz respectively for spectra acquired at 11.75 and 21.1 T. The π/2 pulses were 6.0 (11.75 T) or 10.0 μs (21.1 T). Samples were packed in 7 mm outer diameter NMR rotors and acquired with a Bruker 7 mm MAS probe (11.75 T); those acquired at 21.1 T were packed as described above. Recycle delays ranged from 0.25 to 2.0 s, depending on temperature. Spectra, acquired without 1H decoupling, were
referenced such that δiso= 0.0 ppm for an external sample of
solid NH4Cl. 14N spectra for the MAX salts were acquired at
21.1 T with the WURST−QCPMG pulse sequence,61,62with a 30 kHz1H decoupling field and with a 2 s recycle delay; the
spikelet spacing was 5.0 kHz. Spectra were acquired in two frequency offset steps and the resulting spectra added to yield the total spectrum.
Lead-207 NMR spectra were obtained with either single pulse excitation or with solid echoes at 4.70 T on a CMX Infinity 200 spectrometer, at 11.75 T on a Bruker Avance spectrometer and at 21.1 T on a Bruker Avance II spectrometer, with 90° pulses ranging from 3.0 to 5.4 μs. Spectra were referenced to the 207Pb chemical shift of
Pb(CH3)4(δiso= 0) by setting the isotropic value of a 207Pb
NMR spectrum of a stationary sample of Pb(NO3)2, acquired at
294 K, to −3491.6 ppm. This value is based on that reported by Neue et al. but adjusted for the slightly lower temperature in our lab.63
Variable temperature NMR experiments were undertaken at 11.75 and 21.1 T using the Bruker BVT 3000 temperature controller on both instruments. Temperatures were calibrated based on the207Pb chemical shifts of solid Pb(NO
3)2.64,65Dry
nitrogen gas, obtained from the boil-off of N2(liquid), was used
as the variable temperature gas. N2(liquid) was also used for the
heat-exchange medium for temperatures below 250 K, while an ethanol/dry ice bath was used in the 250−293 K range.
Relativistic density functional theory (DFT) calculations of the nuclear magnetic shielding and indirect Pb−X spin−spin coupling for model PbX6complexes were undertaken with the
Amsterdam Density Functional (ADF) program66−68
mounted on a four-core processor. Relativistic effects were incorporated in the results through the zero-order relativistic approximation (ZORA).69−72
Octahedral symmetry with rPb,Cl= 2.85 Å, rPb,Br
= 2.98 Å, and rPb,I = 3.20 Å was used for the calculations,
undertaken with a triple-ξ basis set incorporating two polarization functions (TZ2P) and a quadruple-ξ basis set incorporating four polarization functions (QZ4P). Calculated magnetic shielding was converted to chemical shift according to δ(207Pb)
calc = σ(Pb)ref − σ(Pb)calc, where σ(Pb)ref is the
magnetic shielding for the reference compound, Pb(CH3)4,
calculated at the same level of theory. The structure for Pb(CH3)4was that reported by Oyamada et al.73
Lead(II) acetate trihydrate (ACS grade) and lead(II) dichloride were purchased from Fisher Scientific. HCl (37% in H2O) was purchased from Caledon Laboratories, while HBr
(48% in H2O), HI (57% in H2O), and methylamine (40% in
H2O) were purchased from Sigma-Aldrich. Methyl-d3-amine
HCl (99.5%2H) and D
2O (99.9% 2H) were purchased from
MSD Isotopes, Montreal.
MAPbX3compounds were synthesized as per the procedures
described in refs 1 and 2. The deuterated versions were prepared according to the procedures described in refs2and9. X-ray diffraction (XRD) spectra were collected on a Bruker AXS D8 diffractometer with a large-area detector using a Cu Kα radiation source.
■
RESULTS AND DISCUSSIONThe tetragonal and orthorhombic phases of the MAPbX3salts
are in effect distortions of the cubic phase, and in all three phases it is reasonable to consider that the MA cation is located inside a pseudocube, where the eight corners are the Pb atoms with the 12 edges consisting of linear or bent halogen atom bridges between two Pb atoms (Scheme 2). In the orthorhombic phase for MAPbI3 determined by powder
neutron diffraction,7,14,15 the C−N axis of the MA cation is
Figure 2.2H NMR spectra for a stationary sample of CH
fixed in the plane perpendicular to the long axis of the unit cell and points toward a face of the pseudocube. Similarly, the neutron diffraction data acquired at 180 K suggests that in the tetragonal phase the C−N axis is also close to the plane perpendicular to the long axis of the unit cell, but disordered over four equivalent positions, and although tilted slightly out of the plane, the C−N axis still points toward the pseudocube faces.7 In a neutron diffraction study of the isostructural tetragonal phase of the MAPbBr3 salt,8 it was also suggested
that the data supported orientational disorder of MA cations in this plane. An X-ray diffraction study11 of MAPbI
3 also
suggested four disordered positions of the C−N axis, albeit tilted further out of the plane perpendicular to the c-axis. Similarly, Mashiyama and co-workers,10Baikie et al.,13and Yin et al.74 have investigated the structure of the higher-temper-ature tetragonal phase of MAPbBr3.
Figure 2 illustrates 2H NMR spectra for CH
3ND3PbI3,
acquired at 11.75 T in the 151−344 K range. The spectrum acquired at 151 K consists of an axially symmetric powder pattern with a νQSvalue of 40 kHz, approximately 1/3 the value
expected in the absence of motion of the MA cation.40These results are consistent with the determined structure, indicating that the only significant motion is the rapid reorientation of the ND3group about the C−N axis. The spectrum acquired at 167
K illustrates the abrupt change in dynamics of the MA cation at the tetragonal ↔ orthorhombic phase transition. The axially symmetric powder pattern with νQS = 38.9 kHz is due to
crystallites in the orthorhombic phase, while the narrower pattern, νQS = 7.8 kHz, is due to crystallites that are in the
tetragonal phase. Values of νQS decrease as the temperature is
increased, such that νQS∼1.7 kHz at 326 K. A plot of νQSvs
1000/T for CH3ND3PbI3 is shown in Figure S1 of the
Supporting Information. Likewise, for the CD3NH3+ cation of
MAPbI3, νQSdecreases from ∼7.0 kHz at 198 K to ∼1.8 kHz at
325 K, as shown inFigure S2. At temperatures greater than the tetragonal ↔ cubic phase transition (i.e., >326.6 K), νQS= 0 for
both CH3ND3PbI3and CD3NH3PbI3;Figure S3shows that the
temperature dependence of νQS(2H) is virtually identical for
these two isotopomers.
Figure 3 illustrates a series of14N NMR spectra of MAPbI 3
acquired at various temperatures.14N ν
QSvalues for the salt in
the tetragonal phase range from 76.5 kHz at 175 K to 14.4 kHz at 327 K. There is no indication of magnetic shielding anisotropy in these spectra. Unfortunately it was not possible to obtain14N NMR spectra for the salt in the orthorhombic phase,
so the νQS value in the absence of significant motion of the
C−N bond axis has been estimated (vide infra). The14N NMR
line shapes are consistent with axially symmetric EFG tensors in the fast motion limit (i.e., they do not show the distortions observed for an activated motion in the intermediate rate regime).41−43
The splittings observed for the tetragonal phase rapidly decrease as the temperature approaches the tetragonal ↔ cubic phase transition temperature, and can be fit to an equation with a critical-temperature dependence (Figure 4). As
for the2H spectra discussed above, at the transition to the cubic
phase the14N quadrupolar powder pattern collapses, leaving a
symmetric Gaussian peak, consistent with rapid pseudoiso-tropic reorientation of the C−N axis in the cubic lattice.
Estimating CQ(14N) from2H and14N NMR Line Shapes.
As discussed below, determination of rotational correlation times for the MA cation requires knowledge of the2H and14N CQ values. These values must not be reduced by motional Figure 3.14N NMR spectra of a stationary sample of CH
3NH3PbI3, acquired at 21.1 T at the indicated temperatures. The asterisks indicate14N signal from the VT gas, N2.
Figure 4.Plot of νQS(14N) vs T for MAPbI3, which was fit toeq 9with
a = 11.39 kHz and n = 0.3813, R2= 0.9878. The cubic ↔ tetragonal and tetragonal ↔ orthorhombic phase transition temperatures are indicated with red and blue dashed lines, respectively.
averaging and, in principle, should be determined for the sample in the same environment (i.e., the tetragonal phase in this case) for which the correlation times are being measured. Of course this is not practical for the MAPbX3salts, since the
MA cation is known to be undergoing rapid motion above the tetragonal ↔ orthorhombic phase transition,3 so, for 2H, this
value will be derived from the νQS(2H) value measured for the
sample in the orthorhombic phase. Unfortunately, hardware limitations precluded direct measurement of νQS(14N) for
MAPbI3 in the orthorhombic phase (vide infra), so CQ(14N)
was estimated according to
ν ν ν = C ( N) 4 3 ( H) ( H) ( N) Q 14 QS 2 ortho QS 2 max,tetra QS 14 max,tetra (10)
where νQS(2H)ortho is the ν(2H) value for the sample in the
orthorhombic phase and “max,tetra” indicates the maximum quadrupolar splitting in the tetragonal phase for the indicated nucleus. For CH3ND3PbI3, the maximum2H νQSvalues that we
observed in the orthorhombic and tetragonal phases are 40.0 and 7.9 kHz, respectively. Since the 2H and 14N ν
QS values
appear to vary with temperature in a fashion analogous to the lattice parameters, νQS(14N) at the tetragonal ↔ orthorhombic
phase transition temperature may be estimated from the order parameters a and n obtained from a fit of νQS(14N) vs T toeq 9
(see Figure 4 for the fit for the MAPbI3 data); the order
parameters resulting from these fits and the νQSvalues expected
at the tetragonal ↔ orthorhombic phase transition temperature are listed inTable 1. For MAPbI3, νQS(14N)max,tetra≈80 kHz at
this temperature and thus, fromeq 10, CQ(14N) values of 525−
540 kHz are predicted, depending on whether νQS(2H) values
for the CD3NH3+ or CH3ND3+ isotopomers are considered.
Acknowledging that the C−N axis may be undergoing some small amplitude wobbling in the high-temperature region of the orthorhombic phase (i.e., at 151.3 K), our value for νQS(2H)ortho
for a rigid C−N axis, 40 kHz, may be 2 or 3 kHz lower than the value expected in the absence of any motion. For example, a maximum2H splitting of 42 kHz yields C
Q(14N) = 570 kHz. In
the calculations that follow we will use CQ(14N) = 550 ± 80
kHz. Our estimated value is within experimental error of the value calculated by Kentgens and co-workers (600 kHz)36but smaller than the calculated value reported by Kubicki et al. (770 kHz).26
We also examined the temperature dependence of νQS(2H)
and νQS(14N) for MAPbBr3; seeTable 1as well as Figures S4
and S5 in Supporting Information. At the tetragonal ↔ orthorhombic phase transition for the bromide, νQS(2H) and
νQS(14N) values of 4.0 and 43 kHz are expected, based on the
order parameters summarized inTable 1. Both these values are approximately half the corresponding values for the iodide, indicating greater disorder of the MA cation in the bromide (vide infra). Also, our value of νQS(2H) in the orthorhombic
phase is in excellent agreement with the value measured at 50 K
by Roiland et al.32 Using eq 10 and the data summarized in Table 1, CQ(14N) for MAPbBr3is approximately 570 kHz, again
probably a lower limit.
The narrow range of temperatures for which MAPbCl3exists
in the tetragonal phase precluded a similar treatment for this salt. Reported values of CQ(14N) for an MA cation that is
assumed to be stationary range from 413 kHz for MA perchlorate75 to 959 ± 3.0 kHz in MA chloride.76 We have also obtained14N (Figure S6) and2H (Figure S7) NMR data
for the methylammonium halides; Table S1 summarizes the data for these samples obtained at several temperatures. At 293 K, all three salts are in the tetragonal phase, P4/nmm, where motion of the CH3and NH3groups are confined to rotations
about the C−N bond. CQ(14N) values for the MAX salts
decrease on going from X = Cl to X = I (960, 895, and 785 kHz for data measured at 293 K). In contrast, the corresponding νQS(2H) values increase slightly: 34.1 (X = Cl), 37.9 (X = Br),
and 39.2 kHz (X = I).
Modeling the Disorder of the MA Cation in the Tetragonal Phase for CH3ND3PbI3.The 2H line shapes for
the MA cation (e.g., see Figure 2), with an asymmetry parameter η = 0, are consistent with rapid reorientation about an n-fold axis with n > 2. As discussed above, the 2H NMR
spectra acquired for the MAPbX3salts below the tetragonal ↔
orthorhombic phase transition temperature indicate rapid reorientation about the C−N axis, yielding an averaged, axially symmetric quadrupole coupling tensor with its unique component along the C−N axis. Any further averaging (i.e., a further reduction of νQS) reflects reorientation of the C−N axis
itself. The structure refinement with space group I4cm12 puts the C−N axis parallel to the c-axis, in which case there can be no further narrowing of the NMR line shape, from νQS(2H) =
40 kHz, in the tetragonal phase; thus the2H and14N results
rule out this structural model. Most of the refine-ments,7,8,11,14,15including the two most recent,14,15 assign the tetragonal phase to space group I4/mmm, in which the C−N axis must be disordered over four or eight positions, depending on the model, to conform to the symmetry. Dynamic disorder will lead to narrowing of the 2H and 14N line shapes. If
reorientation of the C−N axis is restricted to the four orientations determined in these refinements, one obtains averaged2H NMR line shapes with quadrupolar splittings that
in all but one case (ref15) do not match observations: since the quadrupolar tensor is insensitive to inversion, the averaging over the four orientations can be modeled as a C4rotation. For
simple 4-fold rotation when the initial EFG tensor has η = 0, the averaging equations reduce to
ν =V3 cos β−1
2
QS
2
(11)
where V is the initial quadrupolar splitting (i.e., the splitting expected in the absence of motion of the C−N bond), assumed Table 1. Order Parameters and Calculated νQSValues for MAPbBr3and MAPbI3
salt nucleus Tc/K T/K a/kHz n νQSa/kHz R2
CH3ND3PbI3 14N 326.6 162.7 11.39 0.3813 79.6 0.9878 CH3ND3PbI3 2H 326.6 162.7 1.270 0.357 7.9 0.9889 CD3NH3PbI3 2H 326.6 162.7 1.129 0.374 7.6 0.9843 CH3ND3PbBr3 14N 235.1 148.4 6.497 0.431 43.2 0.9958 CH3ND3PbBr3 2H 235.1 148.4 0.3438 0.5611 4.0 0.9720 a
to be 40.0 kHz, the splitting measured at 151 K for X = I, and β is the angle between the C−N axis and the c direction of the crystal. Note that, for an angle of β = 54.736°, the calculated splitting would be zero.
Based on the available C and N atomic coordinate data from each of the four I4/mmm refinements, we calculated the orientation of the C−N bond relative to the crystal c-axis to obtain the β value and then determined the expected averaged νQS(2H) value for a four-site model: for the neutron powder
diffraction structure determined by Weller et al. at 180 K,7β= 77.7° and a νQS(2H) value of 17.3 kHz is predicted with this
model, significantly greater than the observed value of 7.5 kHz at 180 K. Similarly, based on the single-crystal X-ray structure of Kawamura et al. obtained at 220 K,11 β = 56.6° and a νQS(2H) value of 1.82 kHz is predicted, significantly less than
the value of 6.7 kHz observed at this temperature. For the recent single crystal neutron diffraction structure by Ren et al. at 295 K,14 β = 66.05° giving an expected νQS(2H) value of
10.112 kHz, compared to an observed value of 4.0 kHz measured at 294 K, and for the neutron powder and synchrotron X-ray diffraction structure reported by Whitfield et al. at 190 K,15β= 62.23° yielding an expected νQS(2H) value
of 6.973 kHz, compared to an observed value of 7.4 kHz at 192.4 K. Only in the last case is there any reasonable agreement, and considering that correct refinement of disordered structures can be fraught with difficulty, as noted by the authors,15even that agreement may be accidental.
The foregoing discussion demonstrates that a simple four-site model of the disorder in the structural refinement is not adequate. However, the introduction of another two equivalent sites along the c-axis (C−N up and down) with a lower population than the original four sites will yield a modified νQS.
With the total population normalized to 1.0 and the four equivalent sites each with a population x, then the sum of the latter is 4x and the two equivalent c-axis sites each have a population (1 − 4x)/2. The averaging equation becomes
ν β β = − + − − = − − ⎜ ⎟ ⎡ ⎣ ⎢ ⎧⎨ ⎩ ⎛ ⎝ ⎞ ⎠ ⎫ ⎬ ⎭ ⎤ ⎦ ⎥ V x x V x 4 3 cos 1 2 2 1 4 2 3 cos 0 1 2 [1 6 (1 cos )] QS 2 2 2 (12)
In the very symmetric case where all the orientations are orthogonal, i.e., β = 90°, then
νQS=V[1− 6 ]x (13)
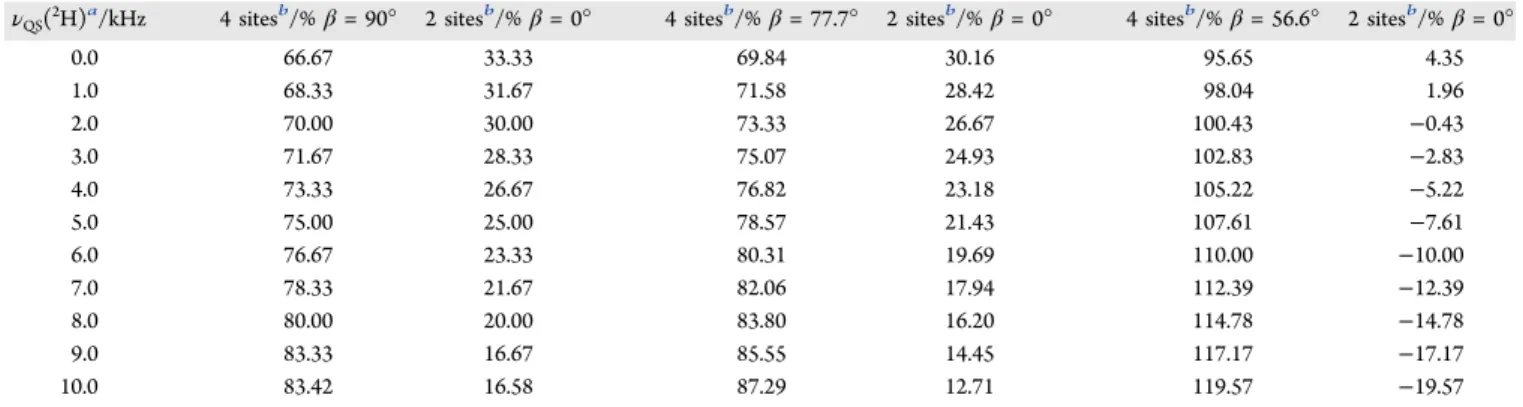
The choice of this simple six-site model is based on known information: First, diffraction studies of samples in both the orthorhombic and tetragonal phases indicate that the C−N axis is preferentially aligned toward the faces of the pseudocube, angled close to the plane perpendicular to the c-axis.7,11,14,15 Second, recent molecular dynamics (MD) calculations also suggest a greater preference for orientations of the C−N axis toward the faces of the pseudocube, both from a classical MD Table 2. Calculated Populations Based on νQS(2H) Values for the Six-Site Model
νQS(2H)a/kHz 4 sitesb/% β = 90° 2 sitesb/% β = 0° 4 sitesb/% β = 77.7° 2 sitesb/% β = 0° 4 sitesb/% β = 56.6° 2 sitesb/% β = 0°
0.0 66.67 33.33 69.84 30.16 95.65 4.35 1.0 68.33 31.67 71.58 28.42 98.04 1.96 2.0 70.00 30.00 73.33 26.67 100.43 −0.43 3.0 71.67 28.33 75.07 24.93 102.83 −2.83 4.0 73.33 26.67 76.82 23.18 105.22 −5.22 5.0 75.00 25.00 78.57 21.43 107.61 −7.61 6.0 76.67 23.33 80.31 19.69 110.00 −10.00 7.0 78.33 21.67 82.06 17.94 112.39 −12.39 8.0 80.00 20.00 83.80 16.20 114.78 −14.78 9.0 83.33 16.67 85.55 14.45 117.17 −17.17 10.0 83.42 16.58 87.29 12.71 119.57 −19.57 aExpected ν
QS(2H) value for V = 40.0 kHz. νQSand V are assumed to have opposite signs.bThe total population for the four or two sites of an orientation type is listed.
Figure 5.Representation of the population distribution of the MA cation for MAPbI3with β = 90° in the tetragonal phase near the tetragonal ↔ orthorhombic phase transition temperature (A), in the tetragonal phase near the tetragonal ↔ cubic phase transition temperature (B), and when the sample is in the cubic phase (C). Note that (A) and (B) represent asymmetric units rather than the unit cell, and that edges are not drawn to scale: a = b ≠ c for (A) and (B), and a = b = c for (C).
investigation by Mattoni et al.77 and from quantum MD studies78,79 (see also Figure 4c of ref 80). The classical MD simulations were done as a function of temperature and suggest that in the tetragonal phase there is a greater preference for C− N orientations in the ab-plane facing toward the pseudocube faces, but that as the temperature increased there are an increasing number of orientations aligned with the c-axis. Furthermore, sites with inequivalent populations imply an energy difference, and the thermal population of the higher energy sites increase relative to the lower energy sites as the temperature increases, thus causing νQSto decrease. However,
for all sites and their populations to become equivalent at the transition to the cubic phase, the energy difference must decrease to zero so that all sites become equivalent at the transition. This is clearly linked to the known tilting of the corner-sharing PbI6octahedra in the tetragonal phase.81
Table 2lists populations for the two types of sites calculated for the −ND3 group from this six-site model, for νQS values
ranging from 0 to 10 kHz, and assuming a splitting of 40.0 kHz before dynamic averaging due to motion of the C−N bond. Note that only for β = 90° do the populations become equal when νQS= 0. When β is set to the approximate value reported
from the neutron diffraction study,7 77.7°, the relative populations are generally reasonable, although they do not reach equal populations for νQS= 0, but for the β value from
the X-ray diffraction study,1156.6°, unreasonable or impossible populations are obtained. Note that it is quite conceivable that, in the tetragonal phase, β is indeed less than 90°, and that with increasing temperature β tends toward 90°. SeeFigure 5for a representation of this model where β = 90°.
For the value of νQS = 7.5 kHz determined at 180 K, we
calculate that the two on-axis sites account for only 20.8% (β = 90°) or 17.1% (β = 77.7°) of the total population. Thus, the small on-axis population may have gone unnoticed in the structure refinement. These observations prompt the question: could existing or future diffraction data on MAPbI3be refined
with the suggested six-site model, and would such analyses yield reasonable or even improved R factors? Other models can be considered, including eight sites with C−N oriented in the
directions of the corners of the pseudocube, or 12 sites oriented toward the edges of the pseudocube, but neither of these is consistent with observations from diffraction studies. The ab initio quantum MD simulations reported by Leguy et al.80also show that the corners are the least favored orientations, with slightly more alignment density along the edges, and the greatest alignment toward the faces.
For the methylammonium lead bromide, MAPbBr3, this
same model is probably valid, since the tetragonal phase II (i.e., the higher-temperature phase of the two tetragonal phases for MAPbBr3) is in space group I4/mmm and is probably
isostructural with tetragonal MAPbI3.8 With νQS(2H) ≈ 4.0
kHz at 163 K, a population of roughly 27% for the two sites (i.e., those parallel to c) is calculated, compared to approximately 20% for the iodide at this temperature (see Table 2).
Dynamics of the MA Cation for MAPbI3. Figure 6
illustrates a plot of ln(T1) vs 1000/T for the14N and2H data
for MAPbI3; similar plots for2H data acquired for the Br and Cl
salts are illustrated inFigures S8 and S9.Table 3summarizes
14N and2H T
1relaxation data obtained for MAPbI3, as well as
correlation times derived from that data. The determination of correlation times at a given temperature as outlined below requires the determination of T1(2H) and T1(14N) values at
that temperature, but in some cases, the former were not obtained at the same temperatures as for the14N data. In such
cases,2H values were obtained by interpolation based on fits of
the measured T1(2H) (see Figure 6). Here we will focus on
rotational correlation times for the MA cation of MAPbI3;
however, rotational correlation times from2H NMR relaxation
data for all three halides will be summarized. First, it is important to recognize that NMR measures τ2while dielectric
relaxation measures τ1 and, in the special case of rotational
diffusion, τ1= 3τ2.82
The dynamics of the MA cation were first investigated by us in 1985.3At 303 K,2H T
1data lead to rotational times, τc, of
approximately 0.35 ps for X = Cl and Br, and 0.46 ps for the iodide. Note that the iodide is in the tetragonal phase at this temperature while the chloride and bromide are in the cubic
Figure 6.ln(T1) plotted as a function of 1000/T (K) for the14N (A) and2H (B) spin−lattice relaxation of CH3NH3PbI3 and CH3ND3PbI3, respectively. From the14N data, E
A= 11.3 ± 2 kJ·mol−1for the salt in the cubic phase (first six points) and 18.1 kJ·mol−1when in the tetragonal phase (last five points). Likewise, from the2H data, E
A= 5.9 ± 1 kJ·mol−1for the salt in the cubic phase and 7.9 ± 2 kJ·mol−1if the first six points for the salt in the tetragonal phase are considered, or 10.0 ± 2 kJ·mol−1if all points are considered.
phase. Rotational correlation times were derived from14N T 1
data at 303 K for X = Cl and Br using an early CQ(14N)
obtained from liquid crystal data, 1.107 MHz;83these analyses yielded τ2 values of approximately 0.22 and 0.24 ps,
respectively. A similar value of τ2, 0.2 ps, was obtained for
the iodide at 333 K, just above the tetragonal ↔ cubic phase transition temperature, 326.6 K. Now we know that it is unlikely that CQ(14N) in the iodide exceeds 700 kHz, so this
would increase the value of τ2by a factor of (1.107/0.700)2, a
factor of 2.5, i.e., τ2 = 0.5 ps. Unfortunately, hardware
limitations combined with the nuclear properties of 14N
(relatively low Larmor frequency and a large quadrupole moment) rendered impractical the acquisition of 14N NMR
spectra for the MAPbX3 perovskites in their orthorhombic
phase. Our data point toward CQ(14N) = 550 ± 80 kHz; had
this value been used in our early paper,3 the reported correlation time at 333 K would have been greater by a factor of 4.05 and τ2 ≈0.8 ps, in good agreement with our present
data; seeTable 3.
Poglitsch and Weber used dielectric measurements to determine rotational correlation times at 300 K.4 For MAPbX3, τ1 values of 5.63, 2.73, and 5.37 ps were obtained
for the chloride, bromide, and iodide, respectively. These values are longer than our values as expected given that τ1≈3τ2in the
limit of rotational diffusion; however, the agreement is only approximate. For a recent review of correlation times and activation energies for MAPbI3, see Mattoni et al.84
The correlation time, τc, for a cation such as MA+ is
comprised of components that are perpendicular and parallel to the molecular C−N axis, τ⊥ and τ∥, respectively, as shown in
Figure 7. However, since the 14N relaxation of this cation
depends only on motion of the C−N bond, τc(14N) = τ⊥(14N).
The latter was calculated fromeq 4, the14N T
1data, and the
estimated value for CQ(14N), 550 kHz. Likewise, τc(2H) was
calculated from the corresponding2H data and C
Q(2H) ≈ 160
kHz. D⊥was determined fromeq 7and the value for τ⊥(14N).
Finally, from this value and the value for τc(2H), andeq 8, D∥
and τ∥were calculated. Note that τ∥shows little variation with
temperature (i.e., the rate of rotation of the ND3group about
the C−N axis exhibits little variation with temperature). In contrast, the motion of the C−N axis is strongly dependent on temperature. Clearly the motion becomes more anisotropic with decreasing temperature. It is recognized that a simple rotational diffusion model is not strictly valid for the MA cation of MAPbI3, particularly in the tetragonal phase, but the results
are believed to be qualitatively valid.
It is important to emphasize that both the 2H and 14N T 1
values for MAPbI3are essentially continuous across the cubic to
tetragonal phase. For example, at 330 K (cubic phase) the14N
and2H values are 0.264 ± 0.013 and 6.53 ± 0.33 s, while at 320
K (tetragonal phase) these values are 0.203 ± 0.010 and 5.58 ± 0.28 s, respectively. Obviously the T1 values decrease slightly
because the temperature has decreased by 10 K, but clearly the change in dynamics across the phase transition is subtle. Similar
14N relaxation data for MAPbI
3 were recently reported by
Senocrate et al.;34plots of ln T1(14N) vs T−1yielded EAvalues
of 0.1 eV (9.6 kJ·mol−1) and 0.16 eV (15.4 kJ·mol−1), within
experimental error of the values we obtained (Table 4). Also,
Baikie et al.13 found proton T
1 values to be essentially
continuous across the cubic to tetragonal phase transition, again confirming little change in the rotational correlation time at the phase transition. For MAPbBr3, we also find the2H T1values to
be continuous across the cubic to tetragonal phase transition: 3.46 ± 0.17 s at 238 K and 2.79 ± 0.14 s at 227 K (seeFigure S8).
Interpretation of the 14N T
1data in the cubic phases of the
MAPbX3salts is unambiguous (seeeq 3). Given that the 1H, 2H, and 14N T
1 values are essentially continuous across the
cubic ↔ tetragonal phase transition, we believe that the rotational correlation times of the MA cation are also continuous to a first approximation. Obviously the observation of a small quadrupolar splitting as one enters the tetragonal Table 3.14N and2H Spin−Lattice Relaxation Data for
MAPbI3 a T/K T1(14N)/s τ⊥(14N)/ps T1(2H)/s τc(2H)/ps τ∥b/ps τ⊥/τ∥ Cubic 355 0.354 0.632 7.71 0.342 0.180 3.5 350 0.339 0.659 7.47 0.353 0.184 3.6 345 0.324 0.689 7.23 0.365 0.187 3.7 340 0.296 0.755 7.00 0.377 0.183 4.1 335 0.289 0.772 6.76 0.39 0.192 4.0 330 0.264 0.846 6.53 0.404 0.189 4.5 Tetragonal 320 0.203 1.10 5.58 0.473 0.201 5.5 315 0.176 1.27 5.32 0.496 0.193 6.6 310 0.159 1.40 5.07 0.52 0.193 7.2 300 0.129 1.73 4.58 0.576 0.194 8.9 293 0.106 2.11 4.25 0.621 0.185 11.4
a2H data are for the CH
3ND3PbI3 isotopomer. bτ∥ = (6D∥)−1. τ∥ values were obtained from τ⊥values and τc(2H) usingeq 8.
Figure 7.Perpendicular (τ⊥) and parallel (τ∥) components of τcfor the MA cation.
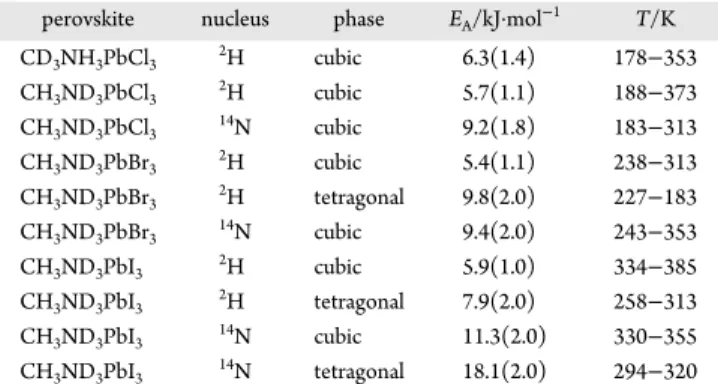
Table 4. Apparent Activation Energies for the MAPbX3(X =
Cl, Br, I) Perovskites Derived from2H and14N T 1Data
a
perovskite nucleus phase EA/kJ·mol−1 T/K
CD3NH3PbCl3 2H cubic 6.3(1.4) 178−353 CH3ND3PbCl3 2H cubic 5.7(1.1) 188−373 CH3ND3PbCl3 14N cubic 9.2(1.8) 183−313 CH3ND3PbBr3 2H cubic 5.4(1.1) 238−313 CH3ND3PbBr3 2H tetragonal 9.8(2.0) 227−183 CH3ND3PbBr3 14N cubic 9.4(2.0) 243−353 CH3ND3PbI3 2H cubic 5.9(1.0) 334−385 CH3ND3PbI3 2H tetragonal 7.9(2.0) 258−313 CH3ND3PbI3 14N cubic 11.3(2.0) 330−355 CH3ND3PbI3 14N tetragonal 18.1(2.0) 294−320 aE
A values are apparent energies over the indicated temperature ranges. The plots of ln(T1) vs 1000/T exhibit non-Arrhenius behavior. In such cases the Eavalues were derived from the initial slopes near the tetragonal ↔ cubic phase transition. For example, 2H T
1 data for CH3ND3PbI3yield EA≈10 kJ·mol−1if all data in the tetragonal phase are considered. See the captions toFigure 6andFigures S8 and S9for more details.
phase points to subtle ordering of the C−N axis, but the change in dynamics is not dramatic.
For MAPbI3, Kubicki et al.26recently reported a
reorienta-tional correlation time of 108 ± 18 ps for the MA cation from
14N NMR data at 300 K using a “diffusion-on-a-cone” model.
We believe that this value is incompatible with our data and other reported values (see Table 3 of ref84). Using the14N T
1
value at 300 K, 0.129 s, and our best estimate of CQ(14N) = 550
±80 kHz, yields a rotational correlation time, τ2, of 1.7 ± 0.6 ps (seeTable 3). Recently Fabini et al. reanalyzed VT1H NMR T1data of Xu et al.6and reported a rotational correlation time of approximately 8 ps at room temperature.27It is important to recognize that the1H T
1data do not yield the same correlation
time that the14N data yield. The 14N relaxation times depend
only on fluctuations of the14N EFG (i.e., motion of the C−N
bond axis), while the proton T1’s depend on fluctuations of the 1H−1H dipolar interactions (rotations about the C−N axis,
rotations of the C−N axis, and intermolecular dipolar interactions).
Our correlation time for rotation of the C−N axis at 300 K, τ2, of 1.7 ± 0.6 ps, may be compared to jump times of 3.0 ± 0.7 and 2.6 ± 0.3 ps obtained at room temperature from ultrafast two-dimensional vibrational spectroscopy and molecular dynamics simulations, respectively.28,85 We suspect that these correlation times correspond to τ1values which are longer than
τ2 values. Using elastic and quasi-elastic neutron scattering together with group theoretical analysis, Chen et al.86reported characteristic correlation times of 4.70 and 0.82 ps, respectively, for C4and C3rotations for the MA cation of MAPbI3at 300 K.
Again it appears that their values are for l = 1 that can be converted to τ2values by dividing by 3.0; that is τ2(C4) = 1.57
ps and τ2(C3) = 0.27 ps at 300 K, in very good agreement with
our values of τ⊥= 1.73 ps and τ∥= 0.19 ps. Likewise, dividing
the values obtained by Chen et al. at 350 K by 3.0 yields values of 0.91 and 0.20 ps, respectively, for C4and C3jumps, which
compare well with our values of 0.66 and 0.18 ps, respectively. Considering the uncertainty in the CQ(14N) and CQ(2H) values
used to calculate the τ⊥ and τ∥ values listed in Table 3, the
uncertainty in the values may be on the order of 35%. Numerous MD calculations have been reported, and the reader
is referred to a recent topical review of perovskite molecular dynamics for reported correlation times and activation energies for MAPbI3.84
Table 4 lists the apparent activation energies obtained from fits of our relaxation data. As expected,14N EAvalues are greater than the corresponding 2H values for a given phase, since 2H
relaxation probes both motion about the C−N axis (fast, less hindered) and motion of the C−N axis itself, while14N only
probes the latter. Note that, because of the changes taking place in the structure of the tetragonal phase as the temperature increases, the real EAwill likely be changing as well, so although
the relaxation data may be fitted linearly to give an “apparent”
EA, this value should be treated with caution. Also, as expected,
EAvalues are greater for motion in the tetragonal phase than those in the cubic phase. In an early investigation of these compounds in their cubic phases, Xu et al.6 used 1H NMR
relaxation data to determine EA values ranging from 10.4 to
11.9 kJ·mol−1for the halide perovskite considered in this work;
these are similar to those we observe for14N. Likewise, Maalej
et al. reported an activation energy of 10.1 kJ·mol−1 for
MAPbCl3, based on the results of a VT Raman study.87
Using our 2H and 14N T
1 values obtained at 313 K for
MAPbBr3, 6.7 and 0.280 s, respectively, from eqs 4−8, we
calculate τ⊥ = 0.743 ps, τ∥= 0.203 ps, and τ⊥/τ∥ = 3.66. The
value for τ⊥is slightly shorter than that obtained for MAPbI3in
the cubic phase at 330 K; the τ∥ values are the same within
experimental error. Our value for τ⊥is approximately one-third
that reported by Poglitsch and Weber,4as expected, since these authors measured τ1rather than τ2. Finally, for pure MAPbX3
films, Selig et al.85determined via two-dimensional vibrational spectroscopy that the cation jump times decrease with decreasing size of the halide (3.0 ± 0.7, 1.5 ± 0.3, and 1.2 ± 0.3 ps, respectively, for X = I, Br, and Cl). Given that the
CQ(14N) for MAPbCl3 is almost certainly larger than that for
the corresponding bromide or iodide, the T1data inTable S3
indicate the same trend in cation jump times (i.e., τ⊥decreases
on going from X = I to X = Cl in the cubic phase).
207Pb NMR Spectroscopy.
Variable temperature 207Pb
NMR spectroscopy was undertaken to investigate the response of δ(207Pb) to temperature. SeeTable 5 for a summary of the
Table 5.207Pb NMR Data for MAPbX
3in the Cubic Phase
a X = Cl X = Br X = I δiso/ppm expt −646(1) 354(5) 1482(10)b Calc1c −1162 −236 489 Calc2c −892 204 1455 ν1/2/kHz; 4.70 T expt 3.6(2) − − ν1/2/kHz; 7.05 T expt 3.1(2) 16(1) − ν1/2/kHz; 11.75 T expt 3.3(2) 15(2) 21(2)d ν1/2/kHz; 21.14 T expt 3.7(2)e 16(1) 22(2)b 1J(207Pb,X)/Hz expt 400(40) − − Calc1c 460 2128 2166 Calc2c 644 3207 3075 1K(Pb,X)
obs/1020N·A−2m−3 expt 168(17) − −
Calc1c 185.8 311.3 426.7
Calc2c 260.2 469.1 605.8
aMeasured on nonspinning samples at 293 K unless otherwise specified; spectra were acquired either with a Hahn echo or with single-pulse
excitation. ν1/2= full width at half-maximum.bMeasured at 335 K.cCalc1, TZ2P basis set; Calc2, QZ4P basis set. Calculated magnetic shielding was converted to chemical shifts based on the corresponding lead magnetic shielding of PbMe4: σ(Pb) = 7349 ppm for the TZ2P basis set and σ(Pb) = 8797 ppm for the QZ4P basis set. Calculated1J(207Pb,X) values are those for the isotope with the highest natural abundance (i.e.,35Cl,79Br, or127I spin−spin coupled to207Pb).dMeasured at 350 K; spectrum processed with 500 Hz line broadening.eA spectrum acquired with SPE and1H decoupling (70 kHz) had ν1/2= 3.4(1) kHz. A spectrum acquired with MAS and1H decoupling had ν1/2= 2.7(1) kHz.
207Pb NMR data and theSupporting Informationfor a detailed
discussion of these results; a brief summary is provided below. The 207Pb magnetic shielding increases as the temperature
decreases for all three perovskite salts in their cubic and tetragonal phases. For X = Br and I, the change in δ(207Pb) at
the cubic ↔ tetragonal phase transition is consistent with the
2H and14N NMR data discussed above: the trend in chemical
shifts is essentially continuous, although the slope of T vs δ(207Pb) does depend on the phase. It was not possible to
investigate this trend for MAPbCl3 because of the narrow
temperature range of the tetragonal phase. For the X = Cl and Br salts, there is a dramatic change in δ(207Pb) at the tetragonal
↔ orthorhombic phase transition temperatures (Figures S11 and S14), although, surprisingly, the shielding decreases upon the transition to the orthorhombic phase for MAPbCl3, but
increases with decreasing temperature regardless of phase for the X = Br and I salts. Nevertheless, the large change in δ(207Pb) at this transition is consistent with the observed
changes in νQS(2H) and νQS(14N) at these temperatures.
Hardware limitations precluded the acquisition of sufficient low-temperature points to discern a trend for the δ(207Pb)
values of MAPbI3, but the one datum acquired for the sample in
the orthorhombic phase suggests that the transition to this phase leads to a significant increase in shielding.
Figure S10 illustrates207Pb NMR spectra for the MAPbX 3
salts when these are in their cubic phase (i.e., 293 K for X = Cl or Br and 335 K for X = I). These spectra are notable for their breadths, with ν1/2values ranging from 3.7 kHz for MAPbCl3to
>20 kHz for MAPbI3(Table 5). Comparable line widths were
reported by Roiland et al. in their investigation of these compounds.32 Dybowski and co-workers have presented a detailed discussion of factors affecting the 207Pb NMR line
widths for spectra of PbI2.88Franssen et al.36and Senocrate et
al.34have studied the temperature dependence of the207Pb T 2
of MAPbI3. The 207Pb T2values are very short, ≈20 μs, and
appear to be continuous across the cubic ↔ tetragonal phase transition.34Senocrate et al. attributed the short207Pb T
2values
to strong dipolar coupling and particularly to cross-relaxation to the quadrupolar 127I nuclei which have a magnetogyric ratio
similar to that of207Pb.34
Given the large values of1J(207Pb,127I)
predicted for MAPbI3 (see Table 5), scalar relaxation of the
second kind must also play an important role in contributing to
the 207Pb spin−spin relaxation.54
Rosales et al.37 also found short207Pb T
2values for MAPbBr3at room temperature (≈87
μs); again on the basis of the calculated values1J(207Pb,79Br)
listed inTable 5, it is clear that scalar relaxation of the second kind must also make a significant contribution to the observed line widths at room temperature. The smaller nuclear quadrupole moments for35/37Cl allowed us to obtain a207Pb
NMR spectrum for MAPbCl3 at 4.70 T (Figure 8) which
clearly exhibits a splitting pattern that we attribute largely to indirect spin−spin coupling to Cl. Each207Pb nucleus in this
sample is spin−spin coupled to six chlorine nuclei (seeTable S2for the nuclear spin properties of isotopes that factor in the analysis of spectra presented herein). Indirect spin−spin coupling with each chlorine isotope should give rise to a 19-peak multiplet89in the207Pb spectrum, with an approximately
3:1 intensity ratio of the multiplets, based on the natural abundance of the isotope giving rise to the multiplet. The splitting pattern observed inFigure 8is attributed to spin−spin coupling to 35Cl since this isotope has the greater natural
abundance. The peak−peak separation measured near the center of the spectrum suggests that1J(207Pb,35Cl) = 400 ± 40
Hz; a large error of ±10% has been assigned due to complications arising from the perturbation of the Zeeman splitting arising from nuclear quadrupolar interactions with the six neighboring 35/37Cl nuclei.90
Note that the 35Cl NQR
frequency is approximately 8.1 MHz for MAPbCl3in its cubic
phase.6
Although the two magnetically active isotopes of bromine are also spin-3/2 nuclei, as discussed above, it is not possible to resolve any splitting due to1J(207Pb,79/81Br) for MAPbBr
3. The
much greater nuclear quadrupole moments for the two bromine isotopes means that they are expected to have much larger nuclear quadrupolar coupling (NQR frequencies of 70.451 and 58.842 MHz, respectively, were reported for the
79Br and81Br NQR spectra of MAPbBr
3, measured at 298 K)6
giving rise to an uneven splitting pattern in the 207Pb NMR
spectra, further complicating the analysis. Likewise, splitting patterns due to1J(207Pb,127I) are not observed for 207Pb NMR
spectra for MAPbI3, as discussed above.
Table 5 summarizes calculated 1J(207Pb,X) values obtained
using a basic PbX6model structure. These calculations yield a
reasonable value for 1J(207Pb,35Cl) for MAPbCl
3 and suggest Figure 8.207Pb NMR spectrum of CH
3NH3PbCl3acquired at 4.70 T with an MAS frequency of 3.0 kHz at 293 K. The arrows indicate adjacent peaks in the multiplet attributed to1J(207Pb,35Cl).
that much larger values are expected for the X = Br and I perovskites. Table 5 also summarizes the calculated reduced coupling constant,1K(Pb,X), which factors out the effect of the
magnetogyric ratios from the observed spin−spin coupling. The calculated 1K values reproduce the expected trend, with 1K(Pb,Cl) < 1K(Pb,Br) <1K(Pb,I).91,92
■
CONCLUSIONSAs demonstrated more than 30 years ago, solid-state NMR spectroscopy is an ideal tool for characterizing phase transitions and dynamics in MAPbX3 perovskites and in related
photo-voltaic materials. Modern instrumentation and computational resources have permitted a more careful NMR investigation of the MAPbX3 salts. Consistent with structural data, variable
temperature NMR data show that the2H and14N spin−lattice
relaxation times for MAPbI3, although sensitive to temperature,
are continuous through the cubic ↔ tetragonal phase transitions.2H T
1values for CH3ND3PbBr3are also continuous
across this transition. Likewise, the 207Pb chemical shifts are
very sensitive to temperature, but there are no large discontinuities in the observed 207Pb chemical shifts at the
cubic ↔ tetragonal phase transition. Although some inves-tigators have suggested that the MA cation may reside exclusively in or near the ab-plane for these salts in the tetragonal phase, our2H data demonstrate that, although the
cation favors this plane, it must spend some time parallel to the
c-axis; a model has been proposed to describe this behavior. On
the basis of our T1data it is difficult to envision a model where
the motion of the C−N axis of the MA cation immediately below the cubic ↔ tetragonal phase transition is confined to a plane or diffusion about a cone. Finally, we show that the breadth of the207Pb NMR spectra for MAPbCl
3 is primarily
due to spin−spin coupling to35/37Cl, with1J(207Pb,35Cl) ≈ 400
Hz; DFT calculations suggest larger1J(207Pb,X) values for the X
= Br and I salts.
■
ASSOCIATED CONTENT*
S Supporting InformationThe Supporting Information is available free of charge on the ACS Publications websiteat DOI:10.1021/acs.jpca.7b11558.
Summary of νQS values for MAX salts, nuclear spin
properties for nuclei of interest,2H and14N T
1values,2H
quadrupolar splitting plotted vs 1000/T, ln(T1) plotted
as a function of 1000/T, further 2H and 14N NMR
spectra, detailed discussion of207Pb NMR results (PDF)
■
AUTHOR INFORMATION ORCID Guy M. Bernard: 0000-0003-1507-6705 Roderick E. Wasylishen:0000-0003-4150-3651 Victor Terskikh:0000-0003-1514-2610 Jillian M. Buriak: 0000-0002-9567-4328 NotesThe authors declare no competing financial interest.
■
ACKNOWLEDGMENTSWe thank Dr. Mike Lumsden and Mr. J. Bruce Macdonald (Dalhousie University), for preliminary work on this project, as well as Mr. Abdelrahman Askar and Mr. Aaron Dong for their assistance in the preparation of some materials. We are grateful to Drs. Bob McDonald and Mike Ferguson for helpful
discussions on X-ray data, to Dr. Klaus Eichele for many useful discussions, to Ms. Michelle Ha for her help in organizing the literature and to Mr. Eric Wasylishen for his assistance with the analysis of some data. Access to the 21.1 T NMR spectrometer was provided by the National Ultrahigh-Field NMR Facility for Solids (Ottawa, Canada), a national research facility funded by a consortium of Canadian Universities, supported by the National Research Council Canada and Bruker BioSpin, and managed by the University of Ottawa (http://nmr900.ca). Funding is provided by the Natural Sciences and Engineering Research Council (NSERC) of Canada and SABIC. R.E.W. is grateful to his former colleague and friend the late Prof. Osvald Knop for introducing him to these intriguing compounds more than 30 years ago.
■
REFERENCES(1) Weber, D. CH3NH3PbX3, ein Pb(II)-System mit Kubischer Perowskitstruktur. Z. Naturforsch., B: J. Chem. Sci. 1978, 33, 1443− 1445.
(2) Knop, O.; Wasylishen, R. E.; White, M. A.; Cameron, T. S.; Van Oort, M. J. M. Alkylammonium Lead Halides. Part. 2. CH3NH3PbX3 (X = Cl, Br, I) Perovskites: Cuboctahedral Halide Cages with Isotropic Cation Reorientation. Can. J. Chem. 1990, 68, 412−422.
(3) Wasylishen, R. E.; Knop, O.; Macdonald, J. B. Cation Rotation in Methylammonium Lead Halides. Solid State Commun. 1985, 56, 581− 582.
(4) Poglitsch, A.; Weber, D. Dynamic Disorder in Methylammo-niumtrihalogenoplumbates (II) Observed by Millimeter-Wave Spec-troscopy. J. Chem. Phys. 1987, 87, 6373−6378.
(5) Onoda-Yamamuro, N.; Matsuo, T.; Suga, H. Calorimetric and IR Spectroscopic Studies of Phase Transitions in Methylammonium Trihalogenoplumbates (II). J. Phys. Chem. Solids 1990, 51, 1383−1395. (6) Xu, Q.; Eguchi, T.; Nakayama, H.; Nakamura, N.; Kishita, M. Molecular Motions and Phase Transitions in Solid CH3NH3PbX3(X = Cl, Br, I) as Studied by NMR and NQR. Z. Naturforsch., A: Phys. Sci. 1991, 46, 240−246.
(7) Weller, M. T.; Weber, O. J.; Henry, P. F.; Di Pumpo, A. M.; Hansen, T. C. Complete Structure and Cation Orientation in the Perovskite Photovoltaic Methylammonium Lead Iodide Between 100 and 352 K. Chem. Commun. 2015, 51, 4180−4183.
(8) Swainson, I. P.; Hammond, R. P.; Soullière, C.; Knop, O.; Massa, W. Phase Transitions in the Perovskite Methylammonium Lead Bromide, CH3ND3PbBr3. J. Solid State Chem. 2003, 176, 97−104.
(9) Chi, L.; Swainson, I.; Cranswick, L.; Her, J.-H.; Stephens, P.; Knop, O. The Ordered Phase of Methylammonium Lead Chloride CH3ND3PbCl3. J. Solid State Chem. 2005, 178, 1376−1385.
(10) Mashiyama, H.; Kawamura, Y.; Magome, E.; Kubota, Y. Displacive Character of the Cubic-Tetragonal Transition in CH3NH3PbX3. J. Korean Phys. Soc. 2003, 42, S1026−S1029.
(11) Kawamura, Y.; Mashiyama, H.; Hasebe, K. Structural Study on Cubic-Tetragonal Transition of CH3NH3PbI3. J. Phys. Soc. Jpn. 2002,
71, 1694−1697.
(12) Stoumpos, C. C.; Malliakas, C. D.; Kanatzidis, M. G. Semiconducting Tin and Lead Iodide Perovskites with Organic Cations: Phase Transitions, High Mobilities, and Near-Infrared Photoluminescent Properties. Inorg. Chem. 2013, 52, 9019−9038.
(13) Baikie, T.; Barrow, N. S.; Fang, Y.; Keenan, P. J.; Slater, P. R.; Piltz, R. O.; Gutmann, M.; Mhaisalkar, S. G.; White, T. J. A Combined Single Crystal Neutron/X-Ray Diffraction and Solid-State Nuclear Magnetic Resonance Study of the Hybrid Perovskites CH3NH3PbX3 (X = I, Br and Cl). J. Mater. Chem. A 2015, 3, 9298−9307.
(14) Ren, Y.; Oswald, I. W. H.; Wang, X.; McCandless, G. T.; Chan, J. Y. Orientation of Organic Cations in Hybrid Inorganic-Organic Perovskite CH3NH3PbI3 from Subatomic Resolution Single Crystal Neutron Diffraction Studies. Cryst. Growth Des. 2016, 16, 2945−2951.