HAL Id: hal-00576902
https://hal.archives-ouvertes.fr/hal-00576902
Submitted on 15 Mar 2011
HAL is a multi-disciplinary open access
archive for the deposit and dissemination of
sci-entific research documents, whether they are
pub-lished or not. The documents may come from
teaching and research institutions in France or
abroad, or from public or private research centers.
L’archive ouverte pluridisciplinaire HAL, est
destinée au dépôt et à la diffusion de documents
scientifiques de niveau recherche, publiés ou non,
émanant des établissements d’enseignement et de
recherche français ou étrangers, des laboratoires
publics ou privés.
to badlands
N. Thommeret, Jean-Stéphane Bailly, C. Puech
To cite this version:
N. Thommeret, Jean-Stéphane Bailly, C. Puech. Extraction of thalweg networks from DTMs:
appli-cation to badlands. Hydrology and Earth System Sciences Discussions, European Geosciences Union,
2010, 14 (8), p. 1527 - p. 1536. �10.5194/hess-14-1527-2010�. �hal-00576902�
Hydrol. Earth Syst. Sci., 14, 1527–1536, 2010 www.hydrol-earth-syst-sci.net/14/1527/2010/ doi:10.5194/hess-14-1527-2010
© Author(s) 2010. CC Attribution 3.0 License.
Hydrology and
Earth System
Sciences
Extraction of thalweg networks from DTMs: application to
badlands
N. Thommeret1,2, J. S. Bailly3,4, and C. Puech2
1CNRS-UMR 8591, Laboratoire de G´eographie Physique, 92190 Meudon, France
2Cemagref-UMR TETIS, 34093 Montpellier, France
3AgroParisTech-UMR TETIS, 34093 Montpellier, France
4AgroParisTech-UMR LISAH, 34060 Montpellier, France
Received: 23 December 2009 – Published in Hydrol. Earth Syst. Sci. Discuss.: 1 February 2010 Revised: 7 July 2010 – Accepted: 24 July 2010 – Published: 10 August 2010
Abstract. To study gully spatial patterns in the badlands
us-ing a continuous thalweg vector network, this paper presents methods to extract the badlands’ thalweg network from a reg-ular grid digital terrain model (DTM) by combining terrain morphology indices with a drainage algorithm. This method will delineate a thalweg only where the DTM denotes a sig-nificant curvature with respect to DTM accuracy and relies on three major steps. First, discontinuous concave areas were detected from the DTM using morphological criteria, either the plan curvature or the convergence index. Second, the concave areas were connected using a drainage algorithm, which provides a continuous, thick, tree-structured scheme. We assumed that these areas were physically significant and corresponded to a gully floor. Finally, the thick path was re-duced to its main course and vectorised to obtain a thalweg network. The methods were applied to both virtual and ac-tual DTM cases. The acac-tual case was a LiDAR DTM of the Draix badlands in the French Alps. The obtained networks were quantitatively compared, both with a network obtained using the usual drainage area criteria and with a reference network mapped in the field. The CI-based network showed the great potential for thalweg network extraction.
Correspondence to: N. Thommeret
1 Introduction
The badlands are usually defined as an intensely dissected landscape, where vegetation is sparse or absent, and on which agriculture is useless (Bryan and Yair, 1982). A com-bination of various weathering and erosion processes affects the side slopes and channels at different spatial and tempo-ral scales. This results in the modelling of a particular land-scape. To understand the geomorphological and hydrological functioning over highly eroded areas, different scale car-tographies are needed. The badlands morphology consists of numerous gullies of variable size (from 10 cm to 100 m wide) organised in hierarchical networks. The high drainage den-sity and steep slope make fieldwork and detailed cartography difficult. Consequently, remote sensing is the most appropri-ate source of data for mapping the badlands. Badlands map-ping provides essential information for studying the spatial pattern of this environment. The quantitative description of the pattern contributes to a better understanding of the func-tioning and scale relationships (Horton, 1945). In addition, it allows for accurate comparisons between different eroded areas.
Representing and characterising the gully network from remotely sensed data is not straightforward. One possibility is to represent the gullies by one of their constitutive ele-ments: thalweg networks. A thalweg is defined as the line joining the lowest points of the gully. In badlands topog-raphy, these networks are characterised by tree-structured topologies. To study the spatial pattern, digital indices describing the network geometry (fractal dimensions) and topology (as Horton ratios and Tokunaga’s indices) must be computed for different extents and resolutions. These latter
indices are very sensitive to noise, especially for small tree structures (Dodds and Rothman, 2001), so the network rep-resentations must fit the data information to provide stable results.
Airborne or high-resolution satellite sensors supply the source data for the representation of the thalweg. We need an automatic and easily repeatable method with the least subjec-tive parameter possible to extract the thalweg network. Even if manual image interpretation is possible and provides con-sistent networks, the result depends on the operator, so it is not reproducible (Molloy and Stepinski, 2007). Moreover, this operational and fastidious technique is difficult to apply to extensive areas. On the other hand, landforms can be ex-tracted directly from digital terrain models (DTMs). Indeed, DTMs are spatial, digital representations of the relief that allow one to stake out morphological features. Nevertheless, extracting features such as thalwegs from a DTM raises some fundamental issues, such as which methods permit extraction of complete and stable networks from spatial data.
The most-used methods are based on regular grid DTMs. Various drainage algorithms, including D8 (O’Callaghan and Mark, 1984), kinematic routing algorithm (Lea, 1992), FD8 (Quinn et al., 1991) or D∞ (Tarboton, 1997), offer the pos-sibility of computing drainage networks all over the grid sur-face. However, the transition from one drainage flow path to a vector thalweg network is not self-evident (Martz and Garbrecht, 1995; Tarboton and Ames, 2001; Turcotte et al., 2001). Most of the time, the process uses a unique contribut-ing area threshold beyond which thalwegs, valleys or hydro-graphical networks are depicted. Because this criterion has no direct physical significance, a relevant question to ask is where to start the thalwegs upstream? Some authors have proposed using topological or physical reasoning to estab-lish the threshold. Montgomery and Dietrich (1994) have suggested distinguishing dissected areas, where fluvial trans-port influence is dominant, from undissected areas, where diffusional, hillslope transport processes are dominant, to lo-cate channel heads. Tarboton et al. (1991) rely on search-ing the smallest scale, measured in terms of support area, where the constant drop property breaks. This property as-sumes that the average drop is approximately constant along the Strahler order. The authors argue that this point repre-sents the physical transition from channel erosion to hillslope erosion. However, because we plan to analyse the network topology and relate it to morphology, we cannot use this rea-soning. The question, then, is how to get thalweg networks to fit, given the amount of information about landforms con-tained in a DTM? In other words, how should we compute a thalweg network from a DTM grid to minimise algorithm artefacts and altimetrical noise effects?
The morphological index computed from the DTM per-mits one to locate concave areas represented in the data. A large number of parameters exist that identify the terrain con-vergences (Wilson and Gallant, 2000; Peuker and Douglas, 1975; Yokoyama et al., 2002), and some have been used for
thalweg extraction (Tarboton and Ames, 2001; Molloy and Stepinski, 2007; Tarolli and Dalla Fontatana, 2009).
In this paper, we present a method that combines an ex-isting drainage algorithm and a morphological index to de-lineate the thalweg network. Compared with the plan cur-vature, the convergence index seems to be a good choice due to its ability to underscore the morphological features, such as valleys. This method attempts to extract thalwegs ob-jectively, considering the significant landforms included in a DTM. This report is divided into four main sections: Sect. 2 presents the study areas and the data; Sect. 3 describes the method proposed to extract and assess thalweg network from DTMs; Sect. 4 presents the results obtained with both virtual and actual DTM; and Sect. 5 discusses the method and the result and compares them with another extraction method.
2 Material
2.1 Virtual catchment and simulated data
First, several virtual catchment DTMs were used to assess the benefit of the proposed method. The use of virtual catch-ment DTM allows for the representation and comparison of networks extracted using different methods, while the ini-tial shape of the valley is known and controlled. Our virtual DTMs are simple shapes embedded into tilted planes. The chosen shapes are either virtual valleys or idealised mathe-matical shapes. The virtual valleys are presented as various confluences (mainly varying angles), width and network pat-terns. The most interesting mathematical shape used is the corrugated sheet.
2.2 Draix badlands catchments and data
The study area is located in the Southern Alps in France, at approximately 6◦20′E and 44◦08′N. The test site represents one of the upper Durance catchment’s badland areas. These badlands were formed from the highly erodible, black, Juras-sic marls. In addition, the Mediterranean climate and pre-cipitation served to intensify the active weathering and ero-sion processes. This particular test site, known as the Draix experimental catchments, is a field laboratory for the study of mountain erosion processes (Richard and Mathys, 1999). Five small catchments, from 1000 m2 to 1 km2, have been monitored since 1984 and are now labelled, “Observatory for Research on the Environment” (ORE). For this work, we focused on a particular catchment called the Moulin. The Moulin catchment is spread over 0.08 km2with a low vege-tation cover rate (40%) and a very high drainage density. The steep slopes, an average of 33◦, make the fieldwork difficult and the use of remote sensing data, such as the digital terrain model (DTM), essential.
Because of the ORE status and the work of several re-search teams, ample data is available on the study area.
N. Thommeret et al.: Extraction of thalweg networks from DTMs 1529
1
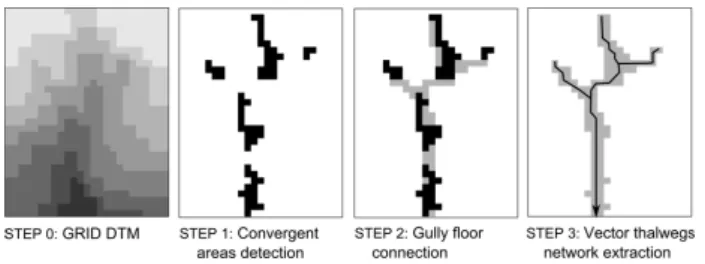
Figure 1. A three-step method to extract a thalweg network from a grid DTM. 2
Fig. 1. A three-step method to extract a thalweg network from a
grid DTM.
Three DTMs of the Moulin catchment were used: a 50-cm-resolution, a one-meter-resolution and a 2-meter-resolution. The three DTMs come from the same LiDAR survey (de-tailed in Bretar et al., 2009). They were derived from the point cloud resulting from the last echo. The DTM RMSE is around 0.17 m. The xyz points acquired with a DGPS (Ja-come et al., 2008) permitted an evaluation of the spatial dis-tribution of the DTM’s altimetrical error.
3 Method
The presented method is intended for the extraction of one morphological feature, the thalweg network, reflecting the information contained in the DTM. More specifically, the ob-jective is to delineate thalwegs from where the DTM denoted a concave curvature in the terrain where flow converges.
Our method consisted of three steps, based on the com-bination of a drainage algorithm and a morphological index (Fig. 1). The morphological index permits to locate conver-gent features. Two indices were tested: the plan curvature and the convergence index (K¨othe and Lehmeier, 1994; Kiss, 2004). First, areas with significant convergence were derived from the DTM. We assumed that these areas corresponded to gully floor elements. But, as these areas can be distinuous, a second step was needed. The discontinuous con-vergent areas were connected using a drainage algorithm to obtain a directed tree structure, considered as the entire gully floor features. The result was a thick network that in the third step was thinned and filtered to get a refined vector thalweg network.
3.1 Detection of significant convergence areas
Several morphological indices are available to distinguish the flow convergence and divergence areas from a DTM (Wilson and Gallant, 2000). Two recent studies (mentioned below) have proposed to integrate the curvature parameters derived from the DTM to extract the thalweg network. For both stud-ies, the core idea is to flag convergence cells; however, they each compute convergence differently. One uses a proxy of curvature stemming from the Peuker and Douglas (1975) al-gorithm (Tarboton and Ames, 2001), and the other uses the
1
Figure 2. Convergence Index calculation.
2
Fig. 2. Convergence Index calculation.
tangential curvature (Molly and Stepinski, 2007). The curva-ture parameter integration aims to improve the ground-truth of the delineated thalwegs and introduce variability in the drainage density of a catchment. In our work, we compared the propensity of the plan curvature and the convergence in-dex (CI) to extract convergence cells. The plan curvature is a popular terrain parameter that seems relevant, as it should di-rectly inquire about the presence of a thalweg. Since the plan curvature and the tangential curvature have the same spatial distribution of convex and concave areas (Molly and Stepin-ski, 2007), these two parameters have the same impact in this work. The CI showed great potential to reveal the gully floor features in a previous work (Bretar et al., 2009).
3.1.1 Using the plan curvature
The plan curvature (or horizontal convexity; Wood, 1996) is defined as the second derivative of the surface elevation (Evans, 1972; Rana, 2006). The plan curvature (PC) mea-sures the contour curvature and distinguishes the flow con-vergent and dicon-vergent cells of the DTM (Wilson and Gal-lant, 2000). The local surface is approximated by a quadratic function, and PC is found by differentiating the surface equa-tion in a direcequa-tion transverse to the slope (Zevenbergen and Thorne, 1987). The PC is computed using a 3×3 moving window.
3.1.2 Using the convergence index
The convergence index (CI) calculation principle (K¨othe and Lehmeier, 1994; Kiss, 2004) differs from the PC. The CI is based on the aspect, which is defined as the slope direction (Zevenbergen and Thorne, 1987) and computed from the lo-cal surface function.
Using a 3×3 moving window (Fig. 2) for each external cell i, θi is the angle, in degrees, between the aspect of cell i
and the direction to the centre (i.e., the direction of the vector
1
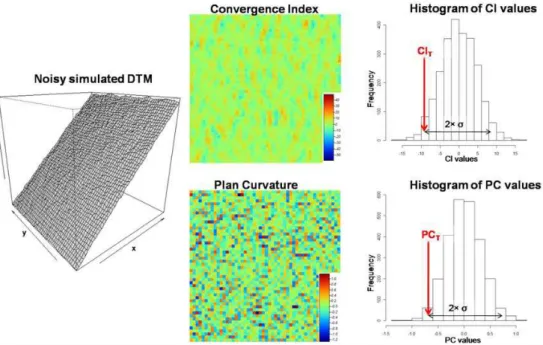
Fig. 3. An example of CI (up) and PC (down) value distributions computed on a noisy simulated tilted plane DTM (left) and the threshold
values (right).
joining the centre of cell i and the centre of the window). The convergence index is the average of θiminus 90◦(Eq. 1).
CI = 1 8 8 X i=1 θi ! −90 (1)
CI can range from −90◦to 90◦(K¨othe and Lehmeier, 1994; Kiss, 2004). In the resulting grid, positive values represent divergent areas, and negative values represent convergent ar-eas. Null values relate to areas without curvature as planar slopes.
3.1.3 Significant values
Some CI or PC values close to zero may not be significant: the DTM noise impacts the results. To highlight the sig-nificant cells, which should effectively correspond to gully floors from the proposed morphological criteria, a threshold is applied on each grid (CIT for the CI grid and PCT for
the PC grid). Lashermes et al. (2007) and Tarolli and Dalla Fontana (2009) have proposed methods to apply a threshold curvature grid to identify hillslope-valley transition. How-ever, the method proposed in this paper considered an objec-tive threshold, dependent on the DTM noise. To objecobjec-tively determine the thresholds for CI and PC, we used the DTM altimetrical error spatial distribution for the main parameter. To determine the CIT, a 50×50-cell, tilted plane DTM
(with a slope of 33◦, which is the Draix mean slope) was simulated with a noise respecting the altimetrical error spa-tial structure of the actual DTM considered (Fig. 3). Since spatially correlated errors were found and modelled on the
DTM, the noise simulation process was based on geostatis-tical Gaussian field simulation, with the spatial covariance function and parameters inferred in the same manner as those used in Bretar et al. (2009). The computation of CI from the simulated DTM provided a threshold CIT, beyond which CI
values can be considered significantly different from a plane landform. The Gaussian distribution of the CI values allows setting the CIT as the mean value minus twice the standard
deviation (σ ). We accepted that 2.5 percent of CI values due to hazard on the DTM noise can be classified as sig-nificant (Bretar et al, 2009). Following this, a binary image attributed a value of one to significant convergent cells (i.e., for CI>CIT and 0 to the non-convergent cells). This same
process was applied to determine the threshold PCT.
At the end of this step, the disconnected convergence areas were identified and considered as gully floor features. This identification was objective and repeatable. Moreover, the threshold computation method is valid for different resolu-tion DTMs.
3.2 Calculation of a tree-structured gully floor area
As the objective was to compute a continuous, tree-structured thalweg network, the disconnected convergence areas needed to be connected to create a continuous area. Drainage algo-rithms allowed for upstream-downstream reconnection, as in Tarboton and Ames (2001) and Molly and Stepinski (2007). Most of the drainage algorithms implemented are based on local analyses and follow the same steps: (i) determina-tion of flow direcdetermina-tion; (ii) computadetermina-tion of flow accumula-tion; (iii) and delineation of the network using a unique
N. Thommeret et al.: Extraction of thalweg networks from DTMs 1531 contributing area threshold (CAT). The concept of flow
ac-cumulation allows for the generation of a continuous flow path. The choice of a unidirectional flow algorithm (each cell has a unique output) versus a multi-directional flow al-gorithm (Tarboton, 1997; Quinn et al., 1992) ensures a tree-structure.
The main ideas are: (i) to start the drainage area upstream only where a convergence is denoted and (ii) to force the flow to pass through the convergence areas detected. To achieve the connection, we integrated the terrain parameter into the flow accumulation computation. Usually, the flow accumulation relies only on the flow direction grid, but to take into account the convergence, the flow accumulation must be weighted by the threshold convergence grid. As a consequence, the cells having an accumulation value other than zero become part of the network. Cells that have a zero-accumulation value are cut out of the network, as this repre-sents areas without concavity. This method differs from the usual accumulation, which needs the application of a con-tributing area threshold to delineate a network.
Several algorithms are relevant to achieve the weighted flow accumulation computation; we compared the widely-used D8 algorithm (O’Callaghan and Mark, 1984) and the kinematic routing algorithm (KRA) (Lea, 1992). The major difference between D8 and KRA is the flow direction deter-mination: the D8 directions are multiples of 45◦, whereas the KRA has a 1◦accuracy (Wilson, 2007). Given that Lea’s flow directions, based on the aspect, are more flexible, we mainly used this algorithm. Lea (1992) routes the flow as if it were a rolling ball on a plane released from the centre of each cell. A plane is fit to elevations of cell corners, wherein the corner elevations are estimated by averaging the eleva-tions of adjoining cell centre elevaeleva-tions (Tarboton, 1997). In contrast, the D8 method routes flow from each cell to one of its eight neighbours that has the steepest slope.
Besides, the DTMs often contain sinks (cells without an output due to an elevation lower than its neighbours). Whichever algorithm is chosen, the DTM needs to be filled before the direction is calculated to obtain a continuous flow path (Martz and Garbrecht, 1999; Planchon and Darboux, 2001) or the flow path may be interrupted. Nevertheless, the morphological indices are computed on the unfilled DTM so the terrain parameters fit to the DTM morphology represen-tation.
As a result, we obtained a binary raster map of gully floors that are represented as a continuous tree structure.
3.3 Vector thalweg network extraction
The last step was to extract a vector thalweg network to per-form a topological analysis of the network extracted. The network was obtained from the raster gully floors area: we consider that the central line represents the thalweg network. As a consequence, the thalweg sinuosity will be erased unless the area also meanders. In the Draix badlands, this
assump-tion seems reasonable; the thalweg path fit well to the gully morphology.
Extracting a vector thalweg network from the map of gully floors involves thinning the gully floor (Molloy and Stepin-ski, 2007) and vectorising and filtering the thinned network. The conversion from a raster area to a vector network is not trivial. The thinning of the area results in a one-pixel-wide network with a course led by the shape of the area. This raster network is then vectorised. The vectorisation corresponds to the classical operation that joins the pixel centres. Be-cause we want a continuous, tree-structure vector network, the vectorisation process integrates both the main informa-tion – the raster network – and the flow direcinforma-tion grid. The incorporation of the flow direction in the calculation creates a continuous network with an upstream/downstream consis-tency and without closed loops. Lastly, a filtering process removed the shortest thalwegs. We assumed that removing segments shorter than twice the resolution was a reasonable option. Using the DTM planimetric error and the badlands morphology, these segments seemed insignificant and unsta-ble.
3.4 Network delineation and errors quantification
We decided that a quantitative assessment of the extracted network was necessary to validate the extraction method. While there is no standard method to assess the quality of an extracted network (Molloy and Stepinski, 2007), Heipke et al. (1997) have proposed an assessment based on a compar-ison of the extracted with a reference network. This global assessment focuses on network lengths. The reference net-work is a field-mapped netnet-work. We consider ground-truth network as reference because it comes from a direct vision that allows a multi-scale representation. The assessment ad-dresses the following questions: how much of the extracted network is over-detected (extracted segments that cannot be matched with the reference) and how much is under-detected (ground-truth segments missing on the extracted network)?
The assessment, which focuses on network lengths, allows for an estimation of the delineation error based on an over-lap of the networks (Heipke et al., 1997; Molloy and Stepin-ski, 2007). The overlap permits a quantification of the match between the two networks. More specifically, this method measures the length of the extracted network included in the reference domain and inversely the length of the reference network included in the extracted domain. The domain is defined as a buffer around the network. The width of the buffer is determined by the operator, and the choice depends on the accuracy required considering the DTM resolution and the type of terrain. Two simple parameters are com-puted from the matching: the false negative (FN), which is the length of the reference not included in the extracted net-work domain, and the false positive (FP), which is the length of the extracted network not included in the reference do-main. In other words, FN and FP should correspond to the
Table 1. Quantitative assessment of the three networks of the Moulin catchment test area.
Total length (m) FP (m) FN (m) FPnormalised FNnormalised EB ES
KRA (CAT=50 m2) 625 73 819 0.05 0.55 0.50 0.60
PC based 754 109 755 0.07 0.51 0.43 0.58
CI based 1216 215 427 0.14 0.29 0.14 0.43
Field reference 1495 – – – – – –
1
Fig. 4. Inconsistency of the assessment-method based on overlap
length.
length of under-detection and the length of over-detection, respectively. For more significant results, the parameters are normalised by the total length of the reference network. FN and FP values close to zero represent minimal under- or over-detection, whereas the highest values (around 1) represent a maximal under- or over-detection. Two error indicators stemming from these parameters provide a quantitative as-sessment of the network extraction, which makes an objec-tive comparison between several extraction methods possi-ble. The first indicator, referred to as error balance (Eq. 2), reflects the geometric balance of the extraction between the over – and under – detection values. It ranges between 0 and 1; the closer the error balance is to zero, the more compliant the network is. The second indicator, referred to as the
er-ror sum (Eq. 3), summarises the total of the erer-rors; the value
interpretation is the same as the error balance.
Error Balance (EB) = |FNnormalised−FPnormalised| (2)
Error Sum (ES) = FNnormalised+FPnormalised (3)
The overlap method provides valuable information on the network’s completeness and geometric accuracy (Heipke et al., 1997); however, some anomalies can disrupt the mean-ing of the calculated length (Fig. 4). For example, the length measure cannot be justified if the streams do not have the same orientation. In this case, the measured thalweg does
1
2
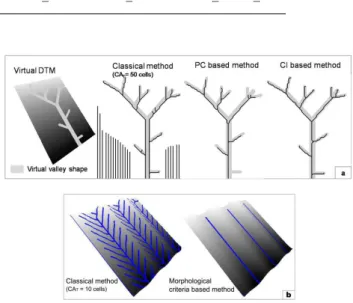
Figure 5. Examples of thalweg networks extracted from two artificial DTMs: a) a virtual 3
Fig. 5. Examples of thalweg networks extracted from two
artifi-cial DTMs: (a) a virtual catchment DTM; (b) a simple corrugated surface.
not necessarily correspond to the buffered thalweg. Thus, the results of the assessment should be discussed before the method is validated.
4 Results
The proposed method was applied to both virtual and actual terrain cases.
4.1 Virtual valleys DTM
Figure 5 compares the results obtained using different traction methods for two virtual DTMs. The classical ex-traction method used was the kinematic routing algorithm (Lea, 1992) with a unique threshold approach (detailed in Sect. 3.2).
For the tilted plane DTM (Fig. 5a), we observed that with the classical method, the main stream was divided into two branches, whereas the algorithms using a morpholog-ical index (PC or CI) returned a single thalweg segment. This unique downstream line reveals that the morphological index-based methods provide a more realistic result in wide valleys. Moreover, with the classical method, artefact lines were created on the sides of the DTM, even though it is a perfect plane; these lines do not appear when a curvature
N. Thommeret et al.: Extraction of thalweg networks from DTMs 1533
1
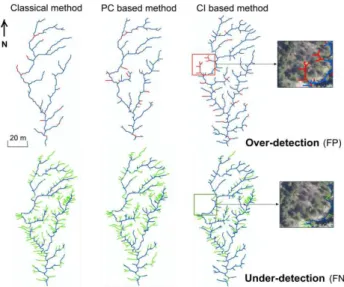
Fig. 6. Comparison of thalweg networks obtained using the three
methods evaluated in this paper with a reference network of the Moulin catchment test area.
index is taken into account. The side artefacts are the
direct consequence of the unique contributing area thresh-old: a thalweg is delineated once the threshold is reached. Differences were also observed between the PC and CI based methods. The CI-based network effectively fit the virtual val-ley: all the thalweg segments of the valley were represented and no over-detected segments were observed, whereas the PC-based network included under-detected segments.
The corrugated surface (Fig. 5b) shows that when a mor-phological index was used, the flow only passed in the con-cave part of the wave, whereas with the classical method, the flow went up on the side where no curvature was represented. In this case, no distinctions were observed between the use of PC and CI.
In summary, it seems essential to integrate a morphologi-cal index for the thalweg’s delineation. Furthermore, the CI-based method provided a unique solution that fits the virtual valley.
4.2 The Moulin catchment
4.2.1 Comparing the extraction methods (PC vs. CI)
As with virtual terrain case, we compared the networks obtained by applying the CI-based method, the PC-based method and the network extracted with unique contributing area criterion methods. The comparison was mainly geomet-ric. We present here the numerical results of the network assessment.
For the CI-based method, the threshold CIT resulting from
the geostatistical calculation, considering the error spatial distribution of the LiDAR DTM, was −9.54◦. For the plan curvature, the PCT was −0.66. For the classical extraction
method, the kinematic routing algorithm was used with a contributing area threshold CAT of 50 m2.
To understand which method would provide more accurate results (more compliant with the ground-truth), we compared the extracted networks to a field reference (Fig. 6). The ref-erence network came from a manual mapping in the field. The quantitative assessment of the three networks extracted
1
Figure 7. Comparison of over- and under-detection for the networks extracted using the three 2
Fig. 7. Comparison of over- and under-detection for the networks
extracted using the three different methods; the Moulin catchment test area.
with different methods is shown in Table 1. According to the quantitative assessment (Table 1), the CI-based method resulted in the most compliant network. Among all of the networks, it had the highest accuracy statistic: its indicators (EB and ES) were the closest to zero. The two other net-works’ indicators gave higher values of EB and ES, which means that the extractions were unbalanced and possessed many errors. Still, the PC-based extraction provided better results than the classical method.
In details, we observed that for both the classical and PC-based methods, the unbalanced extraction came from high normalised FNs (i.e., high under-detection). On the other hand, the classical and PC-based methods resulted in low normalised FPs (i.e., low over-detection). In these two cases, most of the extracted network corresponded to the field, so the geometry was correct, but the network admits a lot of lack. It seems that for the same DTM, the PC-based method extracted less information than the CI-based method. Nonetheless, CI-based normalised FP is slightly higher than for the other methods. This can be explained by the error lo-cation. Figure 7 shows that the main over-detection recorded was located in the same place, a forested area.
Each network domain was defined as a two-meter-wide buffer, considering that twice the resolution of the base DTM approaches the data’s planimetric noise. The more the buffer is reduced, the higher FN and FP. This quality measure helps to assess the geometric accuracy of the extraction. The effect that the choice of buffer width and the length of shortest thal-weg segments to be removed during network extraction have on this assessment is not known.
Besides, we must also take into account the possible scale differences between the assessed network and the reference. Defining a scale for fieldwork can be difficult, and it can be
Table 2. Assessment of the extracted network of the Moulin catchment test area using the CI-based method with different DTM resolutions.
DTM resolution (m) Total length (m) FP (m) FN (m) FPnormalised FNnormalised EB ES
0.5 1151 235 501 0.16 0.34 0.18 0.49
1 1216 215 427 0.14 0.29 0.14 0.43
2 746 181 834 0.12 0.56 0.44 0.68
Field reference 1495 – – – – – –
1
Fig. 8. Results of the CI-based method applied to three different
DTM resolutions compared to the field reference; the Moulin catch-ment test area.
heterogeneous depending on the terrain’s accessibility. In-deed, some areas are more detailed in the field network. The resulting interpretation must incorporate this scale consider-ation.
4.2.2 Testing the CI approach on other resolutions
Because the CI-based method appears to provide more com-pliant results than the other two methods, we tested the method on other DTM resolutions to explore the method’s sensitivity to data resolution.
To test the sensitivity of the CI-based extraction, we ap-plied the method to two other DTM resolutions (50 cm and 2 m). The results for the test area of the Moulin catchment are presented Fig. 8.
The pattern difference between the three networks ex-tracted using the CI-based method is due to the change in resolution because the main part (the highest order streams) is similar between the networks, while the lower orders grow as the resolution gets higher (closer to the field reference). This shows that the networks extracted using the CI-based method accurately express the DTM landform information, verifying the method’s robustness.
The quantitative assessment of the three resolution net-works in the test area reveals error indicators relatively close to zero (Table 2). Theoretically, as the resolution gets higher, the extracted networks should possess a constant over-detection (FPnormalised) and lower under-detection be-cause the network pattern is getting closer to the field
ref-erence. Consequently, EB and ES should be reduced. How-ever, the results are not so clear. The 50-cm-resolution net-work possesses slightly higher EB and ES than the 1-m-resolution network. Because the main parts of the network patterns look similar, we assumed that this inconsistency comes from an inaccuracy of network positioning due to the resolution. As previously, we used a 2-m-wide buffer to de-termine the network domains.
5 Discussion and conclusions
In this paper, we proposed a method to extract tree-structured gully floors and their corresponding continuous thalweg net-works. While classical methods of extraction are based on a unique threshold and a flow routing algorithm (e.g., D8 or kinematic routing approach), the presented method extracts thalwegs only where the DTM expresses a landform. Thus, this method allows for a more robust geometric positioning that can be disrupted otherwise, compared with the reference network. The advantages of this method are the objectivity and the accuracy of the thalwegs that are extracted.
To construct this method, we used terrain parameters re-flecting the convergence. Two main parameters were com-pared: the plan curvature and the convergence index. The results showed the enhanced ability of the convergence in-dex to reveal the landform. The CI-based method provided a more realistic and complete network, especially for bare soils. This method is suitable for the badlands area or any other bare landscape. In other areas, such as forested envi-ronments, the results are less accurate.
This method is data-dependent and data-driven because it relies on DTM noise parameters. These parameters give an objective threshold for the delineation of significant flow convergence areas. This dependence requires that the DTM quality be evaluated first. The main limit of the CI-based method comes from the DTM noise determination. The spa-tial distribution of altimetrical error is valid only for bare-soil areas, which explains the key source of over-detection (Fig. 7). We observed that thalwegs tended to be delineated between sets of trees. In addition, we used only one noisy tilted plane, corresponding to the average slope of the Draix. The threshold would be more accurate if it were determined using several planes with different slopes, in accordance with the badlands’ side slope distribution, or using differencing
N. Thommeret et al.: Extraction of thalweg networks from DTMs 1535 error spatial structure with regards to terrain cover (e.g.,
vegetated/non-vegetated areas).
The CI-based method was applied to three different DTM resolutions (2 m, 1 m and 50 cm) to test the sensitivity of the approach to the resolution. However, for different res-olutions (far from the tested values), local neighbourhood convergence indices can limit network extraction and be un-suitable for network extraction in wide or rough valleys. In that case, a pyramidal approach, based on similar principles, should be developed. At a given resolution, the use of pyra-midal moving windows for CI computation should smooth the resulting network and provide a more accurate result. In this work, for both the plan curvature and convergence in-dex, the kernel used was a 3×3 moving window. Pirotti and Tarolli (2010) showed that the use of other kernels can pro-vide better results. According to the authors, the best com-bination for detecting thalwegs is a curvature window size of 15×15 pixels. Because we intend to extract different-sized morphological elements, a pyramidal analysis would assist in testing different kernels for the convergence index.
The CI-based method applied to DTMs with a resolution on the order of few meters provided an acceptable thalweg network. The application of this method to very high res-olution DTMs will need to be investigated in the future. It is likely that a resolution threshold exists, beyond which the convergence index will not be the optimal parameter for re-vealing a thalweg network. Above this threshold, the conver-gence may only express the terrain roughness. More specifi-cally, in the badlands, the convergence may report the micro-morphology of the terrain rather than the continuous thalweg network. The link between the intended object’s size and the resolution of the base DTM must be considered for a physi-cally significant extraction.
Acknowledgements. The data was acquired and validated by the
Draix ORE (Observatory for Research on the Environment) and GIS. The airborne LiDAR missions were carried out with financial support from INSU (Institut National des Sciences de l’Univers). The authors would like to thank Andres Jacome, who provided additional reference altimetrical data for the DTM accuracy assessment, and the participants of the Geomorphometry 2009 conference for their valuable comments and advice. We also thank the reviewers for evaluating this paper.
Edited by: S. Gruber
References
Bretar, F., Chauve, A., Bailly, J.-S., Mallet, C., and Jacome, A.: Terrain surfaces and 3-D landcover classification from small footprint full-waveform lidar data: application to badlands, Hy-drol. Earth Syst. Sci., 13, 1531–1544, doi:10.5194/hess-13-1531-2009, 2009.
Bryan, R. and Yair, A. (Eds): Badlands geomorphology and piping, Geo Books, Norwich, 1–13, 1982.
Dodds, P. S. and Rothmann, D. H.: Geometry of river networks I: scaling, fluctuation and deviation, Physical Review E., 63, 016115, 13 pp., 2001.
Evans, I. S.: General geomorphometry, derivatives of altitude, and descriptive statistics, in: Spatial Analysis in Geomorphology, edited by: Chorley, R. J., Methuen, London, 17–90, 1972. Heipke, C., Mayer, H., Wiedemann, C., and Jamet, O.: Evaluation
of Automatic Road Extraction, International Archives of Pho-togrammetry and Remote Sensing, 23, 151–160, 1997.
Horton, R. E.: Erosional development or streams and their drainage basins: hydrophysical approach to quantitative morphology, Bull. Geol. Soc. Am., 56, 275–370, 1945.
Jacome, A., Puech, C., Raclot, D., Bailly, J. S., and Roux, B.: Extraction d’un mod`ele num´erique de terrain `a partir de pho-tographies par drone, Revue des Nouvelles Technologies de l’Information, C´epadu`es Editions, 13, 79–99, 2008.
Kiss, R.: Determination of drainage network in digital elevation model, utilities and limitations, Journal of Hungarian Geomath-ematics, 2, 16–29, 2004.
Koethe, R. and Lehmeier, F.: SARA–Systeme Zur Automatis-chen Relief-Analyse, Benutzerhandbuch, 2, Goettigen Univer-sity, 1996.
Lashermes, B., Foufoula-Georgiou, E., and Dietrich, W. E.: Channel network extraction from high resolution topogra-phy using wavelets, Geophys. Res. Lett., 34, L23S04, doi:10.1029/2007GL031140, 2007.
Lea, N. J.: An aspect-driven kinematic algorithm, in: Overland flow: hydraulics and erosion mechanics, edited by: Parson, A. J. and Abrahams, A. D., UCL Press, London, 393–407, 1992. Martz, L. W. and Garbrecht, J.: Automated recognition of valley
lines and drainage networks from grid digital elevation models: a review and a new method–Comment, J. Hydrol., 167, 393–396, 1995.
Martz, L. W. and Garbrecht J.: An outlet breaching algorithm for the treatment of closed depressions in a raster DEM, Computers & Geosciences, 25(7), 835–844, 1999.
Molly, I. and Stepinski, T. F.: Automatic mapping of valley net-works on Mars, Computers & Geosciences, 33, 728–738, 2007. Montgomery, D. R. and Dietrich, W. E.: Landscape dissection and
area-slope thresholds, in: Process Models and Theoretical Geo-morphology, edited by: Kirkby, M. J., John Wiley, New York, 221–246, 1994.
Montgomery, D. R. and Dietrich, W. E.: Where do channels be-gins?, Nature, 336, 232–234, 1988.
O’Callaghan, J. and Mark, D.: The extraction of drainage networks from digital elevation data, Computer vision, graphics and image processing, 28, 323–344, 1984.
Peuker, T. K. and Douglas, D. H.: Detection of surface-specific points by local parallel processing of discrete terrain elevation data, Computer Graphics Image Processing, 4, 375–387, 1975. Pirotti, F. and Tarolli, P.: Suitability if LiDAR point density and
de-rived landform curvature maps for channel network extraction, Hydrol. Processes, 24(9), 1187-1197, doi:10.1002/hyp.7582, 2010.
Planchon, O. and Darboux, F.: A fast, simple and versatile algo-rithm to fill the depression of digital elevation models, Catena, 46, 159–176, 2001.
Quinn, P. F., Beven, K. J., Chevallier, P., and Planchon, O.: The pre-diction of hillslope flow paths for distributed hydrological
eling using digital terrain models, Hydrol. Processes, 5, 59–79, 1991
Rana, S.: Use of plan curvature variations for the identification of ridges and channels on DEM, Spatial Data Handling Proceed-ings, 789–804, 2006.
Richard, D. and Mathys, N.: History, technical and scientific context of the experimental basins of Draix. Characteristics, avalaible data and main results after ten years of monitoring. In: Cemagref Grenoble Etgr (Editor), actes du s´eminaire, Draix Le Brusquet Digne, 22–24 Octobre 1997, Cemagref Editions, Antony, 11–28, 1999.
Tarboton, D. G. and Ames, D. P.: Advances in the mapping of flow networks from digital elevation data, in: Proceedings of World Water and Environmental Resources Congress, Orlando, Florida, 20-24 May, 2001.
Tarboton, D. G.: A new method for the determination of flow di-rections and contributing areas in grid digital elevation models, Water Resour. Res., 33(2), 309–319, 1997.
Tarolli, P. and Dalla Fontana, G.: Hillslope to valley transition mor-phology: new opportunities from high resolution DTMs, Geo-morphology, 113, 47–56, 2009.
Turcotte, R., Fortin, J. P., Rousseau, A. N., Massicotte, S., and Vil-leneuve J. P.: Determination of the drainage structure of a water-shed using a digital elevation model and a digital river and lake network, J. Hydrol., 240, 225–242, 2001.
Wilson, J. P. and Gallant, J. C. (Eds.): Terrain Analysis, Principles and Applications, John Wiley, New York, 1–28, 2000.
Wilson, J. P., Lam, C. S., and Deng, Y.: Comparison of the perfor-mance of flow-routing algorithms used in GIS-based hydrologic analysis, Hydrol. Processes, 21, 1026–144, 2007.
Wood, J. D.: The geomorphological characterisation of digital el-evation models, PhD Thesis, University of Leicester, UK, http: //www.soi.city.ac.uk/∼jwo/phd, last access: 12 June 2009, 1996.
Yokoyama, R., Shirasawa, M., and Pike R. J.: Visualizing topogra-phy by openness: a new application of image processing to dig-ital elevation model, Photogrammetric Engineering and Remote Sensing, 68, 257–265, 2002.
Zevenbergen, L. W. and Thorne, C. R.: Quantitative analysis of land surface topography, Earth Surface Processes and Landforms, 12, 47–56, 1987.