ALUMINUM SUBSTITUTION IN QUARTZ, A STUDY IN GEOTHERMOMETRY
by
Eugene Carleton Perry, Jr.
B.S., Georgia Institute of Technology (1954)
SUBMITTED IN PARTIAL FULFILLMENT OF THE REQUIREMENTS FOR THE
DEGREE OF DOCTOR OF PHILOSOPHY INST. TEC LIBRARY LINDGRFN at the MASSACHUSETTS INSTITUTE OF TECHNOLOGY September, 1963 Signature of Author ---..----...-.. ... Department of Geology and Geophysics,
Bt r 13, 1963
Certified by . ... .
Thesis Supervisor
Accepted by .< ...
Chairman, Departmental Committee
on Graduate Students
ii
ABSTRACT
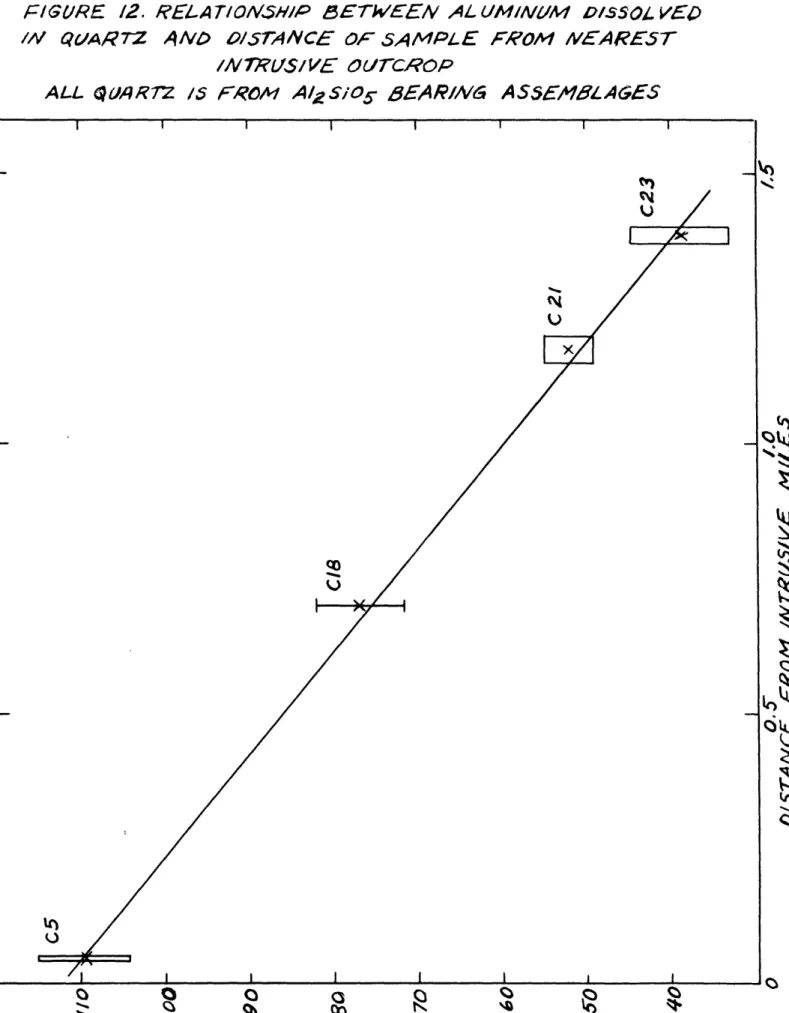
The aluminum content of a suite of quartz samples
from contact metamorphosed kyanite bearing quartzitea
shows a regular variation with distance from the intrusive
contact. The highest recorded'value,109 ppm Al, is found
for a sample adjacent to the contact; concentration
de-creases in an approximately linear manner with distance,
giving the lowest recorded value, 39 ppm A1, at a distance
of
1.4
miles from the contact. A simple temperature model
for
the contact aureole is developed, and an attempt is
made to relate aluminum concentration directly to
tempera-ture of metamorphism.
Techniques are described-for the separation and phase
purification of the quartz and for the spectrographic
determination of aluminum and lithium in solid solution in
this quartz. Final purification is accomplished by
ultra-centrifugation in a bromoform-ethanol mixture to which
n-hexylamine hydrochloride is added as a surface agent.
Lithium concentrations are all below 0.3 ppm, too low to
III ACKNOWLEDGMENTS
This study is part of a detailed program of analysis of minor elements in natural quartz from various environ-ments being conducted at the Cabot Spectrographic Labora-tory. Financial support was received from a National Science Foundation Grant, No. G19743, to W. H. Dennen. S. E. Luria of the Massachusetts Institute of Technology Biology Department generously permitted me to use the
ul-tracentrifuge in his laboratory.
I wish to acknowledge the help and encouragement of W. H. Dennen, my thesis adviser, whose analytical experience
I have drawn upon freely. He has given me every opportunity to develop ideas independently while remaining ready to
offer sound critical advice when necessary. Others who have contributed generously of time or advice are:
J. Annese H. Hughes H. U. Ba'mbauer J, Hwang G. 0. Brunner J. W. Irvine,
Jr.
W. Burows J, Kalnaja W. J. Duffin A. Kats G. H. Espenshade G, C. Kennedy H. W. Fairbairn R. H. McNutt G. Faure Jo A. Philpotts W. H. Grant W, H. Pinson K. Harper J. Smith H. L. Hayes C. C. Schnetzler B. W. HollowayFinally I wish to acknowledge the help of my wife, Joan, whose ministrations have gone well beyond the stand-ardized "help and inspiration." She has accompanied me In the field, typed this manuscript in Its several forms,
drafted the figures, provided sorely needed editorial ad-vice, and nourished and sustained the author
II.-iv TABLE OF CONTENTS Page Abstract 11 Acknowledgments . i List of Figures v List of Plates vi
List of Tables vii
I. Introduction 1
1.1 Review of Previous Work 1
1.2 Objectives of this Study 5
II. Theoretical Considerations 8
2.1 Coupled Substitution 8
2.2 Significance of the A12SiO5 Polymorphs 10
2.3 Temperature Model 17
2.4 Pressure 23
III. Area Studied 27
3.1 General Description 27
3.2 Sample Description 30
3.3 Origin 33
3.4 Metamorphism 36
IV. Experimental Procedures 37
4.1 Separation 37 4.2 Spectrographic Analysis 44 4.2.1 General 44 4.2.2 Aluminum Determination 48 4.2.3 Lithium Determination 53 4.3 Evaluation of Data 58
4.3.1 Precision of Spectrographic Analyses 58 4.3.2 Effectiveness of Separations 60
V. Results and Conclusions 63
5.1 Aluminum as a Geothermometer 63
5.2 Heat of Solution of A12SiO5 in Quartz 67
5.3 A Successful Test 68
Appendix A Investigation of Lattice Expansion of Quartz
as a Function of Aluminum Substitution 71 Appendix B A Note on Infrared Absorption Spectroscopy
and its Application to Quartz Analysis 73
Bibliography 82
Autobiography 86
List of Figures
Figure Page
1 Phase relations in the systems Al203S102 and
A1203-Si02-H20 11
2 Heat flow model for Kings Mountain area,
tempera-ture vs. distance 20
3 Heat flow model for Kings Mountain area,
tempera-ture vs. time 21
4 Sketch map of southern part of Kings Mountain area showing metamorphic facies boundaries 35
5 Diagram of ultracentrifuge head 42
6 Typical calibration curve, -Skl plate 49 7 Analytical curve for aluminum in quartz 50 8 Addition plot of aluminum in quartz (Vein 5 standard) 51 9 Typical calibration curve, 1N plate 54 10 Analytical curve for lithium in quartz 55
11 Analytical curve for titanium in quartz 61 12 Relationship between aluminum dissolved in quartz
and distance of sample from nearest intrusive
outcrop 64
13 Inferred temperature-composition diagram for
aluminum ,-solubility in quartz 66
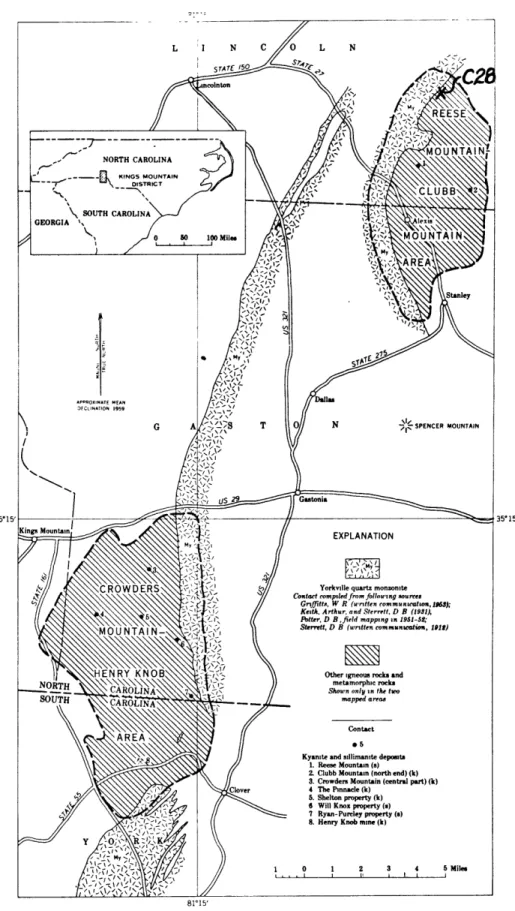
14 Sketch map of entire Kings Mountain area showing
Plate
1 Location map showing Kings Mountain area and other southeastern Al SiO, bearing quartzites
2 D
2 Kings Mountain area, geology and sample local-ities
3 Photographs of pyrite crystals and of voids containing kyanite
4 Photographs of thin section of poikiloblastic kyanite and of voids in quartz
5 Photographs of quartz samples showing inclusions
6 Photographs of purified quartz
7 Reese Mountain-Clubb Mountain area, geology and
sample localities List of Plates Page pocket pocket 75 77 79 81 pocket
vii List of Tables
1 Aluminum concentration and lattice parameters 2 Analytical conditions
3 Standards for aluminum and lithium determination 46 4 Analytical results of the spectrographic
deter-mination of aluminum in quartz 59
PART I
ALUMINUM SUBSTITUTION IN QUARTZ, A STUDY IN GEOTHERMOMETRY
by
Eugene Carleton Perry, Jr.
(To be submitted for publication to The American Journal of Science)
I. INTRODUCTION 1.1 Review of Previous Work
The historical development of metamorphic petrology is reviewed by Fyfe, Turner and Verhoogen (1959), and by Turner and Verhoogen (1960). Although much has been learned about the conditions to which rocks are subjected during metamorphism, neither the isograds of Barrow (in general) nor the facies of Eskola provide quantitative estimates
of metamorphic conditions, i.e., temperature, pressure, and chemical potential of volatile components.
GoldschmitAs postulate (discussed in Fyfe, Turner, and Verhoogen, 195Q) that most metamorphic rocks consist of equilibrium assemblages of minerals is fundamental to any serious study of their physical chemistry. This post-ulate has received recent experimental verification in
the work of Kretz (1959, 1961), Krank (1961), Mueller (1960, 1961), and Clayton and Epstein (1961).
A number of techniques of geological thermometry have been proposed involving both chemical and physical variables. One of the most promising chemical approaches
is that of Ramberg and DeVore (1951) who suggested the
possibility of using the ratio Mg/(Mg + Fe) in coexisting olivines and pyroxenes as a geologic thermometer. Kretz
(op. cit.) and Mueller (op. cit.) have demonstrated that this would be feasible. Another possible way of
obtain-ing temperature (pressure) information is suggested by the work of Carr and Turekian (1961). They studied the
2
distribution of cobalt in rocks of the granulite, amphib-olite, and epidote amphibolite facies. Their Table 23 shows a fair correlation between metamorphic facies and cobalt ratios of coexisting phases. They note that,
"although the total cobalt content of a metamorphic pelitic rock is roughly a function of the Fe content, the partition
of cobalt between the various minerals bears little rela-tion to their Fe content." The disadvantage in both of these methods is that they make use of minerals which are subject to a wide range of compositional variation
depend-ing on their environment.
Keith and Tuttle (1952) and Tuttle and Keith (1954) observed wide variations in the high-low inversion tempera-tures of quartzes from various environments. They post-ulated that these differences arose because different amounts of contaminants were admitted into the quartz structure at different temperatures of formation. They were primarily interested in the variation between quartzes from high and low temperature igneous rocks.
Griffiths, Owen, and Ward (1954) and O'Brien (1954) studied quartz darkened by exposure to y-rays. Griffiths, et al. established that both optical absorption produced by y-rays and the paramagnetic resonance spectrum of a sample were associated with small quantities of aluminum
in the crystal. O'Brien analyzed the paramagnetic reson-ance spectrum of aluminous quartz and concluded from it
silicon, and that electroneutrality is preserved by mono-valent cations in interstitial positions. Cohen (1956a, b, and other papers) reported this color center production in a number of quartzes. Ritter (1962) attempted a system-atic study of the phenomenon in natural quartzes. His
data from y-irradiated specimens indicates that they can be fitted into broad, somewhat overlapping classes according
to their absorption. From strongest to least absorbing (in white light) these are quartzes from:
rhyolite pegmatite granite
schist, gneiss vein filling.
This series bears an. apparent correlation with temperature of formation, particularly in the light of work by Bambauer (1961) described below which shows that color centers ab-sorbing at 466mp are produced by Al-Li couples. The
peg-matite-granite anomaly in the above series can then be
explained by the greater availability of Li in the peg-matite environment.
Bambauer (ibid.), in a comprehensive survey of vein quartzes in the Swiss Alps, found that among "ordinary" and smoky quartzes (as distinguished from low symmetry lamellar quartzes) the minor element content was:
Al< 150 atoms/106Si atoms (68 ppm), Lil00 atoms/106 5
atoms (12 ppm), H<50 atoms/106Si atoms. Also, in y-irradiated samples, a direct correlation was observed between Al-Li content and absorption of light at 466mp.
A further direct correlation was observed between aluminum concentration and the sum of the hydrogen and lithium
concentrations.
Bambauer, Brunner, and Laves (1962) attempted to apply these relationships on a broad regional scale. Hydrogen was measured in quartz from veins throughout the Swiss Alps. Low concentrations are correlated with sedimentary rocks. High concentrations are thought to outline a "heat dome". No sampling control over the com-positional environment of these veins was made. Thus, although the study has broad statistical significance,
5 1.2 Obiectives of this Study
The observation of Keith and Tuttle (1952) and of Tuttle and Keith (1954) that the inversion temperature of quartz depends on its geological environment, along with the work of Ritter (1962), suggested the possibility of using quartz composition as a quantitative measure of the
environment of formation of a rock. The color center
model of O'Brien (1954) suggested that Ritter was actually determining aluminum-alkali metal couples in the quartz. This was confirmed and amplified soon after this study was begun by the work of Bambauer (1961).
Thus the original objectives of this study were to find what elements in natural quartz could be determined simply and accurately and to see whether or not a meaning-ful relation between the concentration of these elements and the temperature of formation of the quartz could be established. Quartz, which is of essentially invariant composition, is useful in such a study because it may be considered a pure solvent regardless of the composition of the rock in which it occurs. However, to make a mean-ingful correlation one should have some measure of the amount of the chosen element that is available in the environment, i.e., some way of normalizing data. In the work of Carr and Turekian (op. cit.), for example, this could be done by studying distribution of a trace element between mineral pairs. An alternative approach is to demand that the component studied in solid solution also
be present in the mineral assemblage as a separate solid phase. This procedure would be analogous to a determina-tion of the temperature of a beaker of water saturated with salt (as shown by the presence of salt crystals) by measuring the concentration of salt in the water and
com-paring this with a previously determined temperature-con-centration relationship.
Aluminum has been chosen as the most suitable element for study in this program of quartz geothermometry.
Since virtually all common minerals contain aluminum in much greater concentration than does quartz, it is not
feasible to compare the aluminum concentration in quartz with that in some coexisting phase. However, by analogy with the salt in the preceding paragraph, one can choose an assemblage saturated in a highly aluminous phase such as one of the various polymorphs of Al2 SIO5. Quartz then
acts as the solvent. To summarize, the concentration of substituted Al in quartz associated with an aluminous miner-al should be temperature dependent.
The quartz studied was obtained from aluminous quartz-ites in the Kings Mountain area, North Carolina - South Carolina, which have been intruded by a granitic mass (the Yorkville Quartz Monzonite) producing one or more Al2SIO5
minerals in association with quartz over a large contact aureole. Within these quartzites it is possible to obtain samples of equivalent and restricted composition across a metamorphic temperature gradient.
There are obvious defects in this approach. First, quartz is not an ideal solvent for aluminum. Coupled substitution (Al-H), over which there is little control information, undoubtedly occurs (Katz, 1961; Bambauer, 1961). Second, although a temperature effect has been demonstrated in field occurrences, there is no correlation with any laboratory temperature-concentration relation-ship. Nevertheless, there is some value in demonstrat-ing the existence of even a relatively simple temperature-composition relationship within a suite of rocks. If nothing more, this work should justify the laboratory study of aluminum solubility in quartz under controlled
II. THEORETICAL CONSIDERATIONS 2.1 Coupled Substitution
The work of Bambauer (1961) and of others on coupled substitution in quartz has already been briefly described. Bambauer has shown that quantitatively the most important
type of chemical substitution in natural vein quartzes is the coupled substitution hydrogen and aluminum-lithium. This was found to be true for a wide range of
samples from the Swiss Alps (excluding low symmetry lamellar quartzes).
In the present study Al-Li substitution may be dis-regarded since it has been demonstrated that Li
concentrat-ion is an order of magnitude too low to be of significance, p.56. Al-H substitution, although it could not be measured, is
probably the dominant means by which aluminum is incorporated into the quartz structure. Unfortunately, there is no way of determining available hydrogen for this substitution
in rocks of the Kings Mountain suite. Several factors, however, suggest that hydrogen was readily available for all samples:
1) Each sample is closely associated with rocks con-taining hydrogen-bearing minerals such as mica or chlori-toid.
2) There is evidence that kyanite formed from clay by a dehydration reaction:
A12 i205(OH)4 -* A12Si05 + SiO 2 + 2H2 0
kaolin kyanite quartz
9 time of metamorphism.
3) Voids in grains, or in associated rocks,were found in three of the 4 sample localities. These voids probably contained a fluid consisting at least in part of water at some time in the metamorphic history of the area.
10 2.2 Significance of the Al2Sio5 Polymorphs
Bell (1963) has experimentally determined the tempera-ture-pressure stability fields of the three Al2SiO5
poly-morphs. His data are reproduced here in figure 1. This work followed the studies of Miyashiro (1949); Clark,
Robertson, and Birch (1957); Clark (1961); Kennedy (1961); and others.
Prior to the work of Bell it was observed that kyanite typically occurred in tectonically disturbed areas. This led to the concept that it was a "stress mineral," i.e., that it could form stably only under intense shearing stress. The following quotation from Harker (1939, pp. 150-51) exemplified this idea:
"It is perhaps possible to frame a more
definite conception of 'stress' and 'anti-stress' minerals as they are here to be understood.
Taking first only temperature and pressure as the two controlling conditions, we must suppose that for any given mineral there is a certain field of stability, to be laid down on the p-t-diagram. If now the introduction of shearing stress as an additional condition causes an extension of the field, we have to do with a stress-mineral, if contraction an anti-stress-mineral. If a sufficiently intense measure of shearing stress causes the field to contract to a point and disappear, we have an anti-stress mineral in a very special sense. On the other hand, some form may make its entry only with the
coming in of the stress factor, having other-wise no field of stability: this will be a
stress-mineral in a very special sense. To picture the relations more clearly we must
imag-ine a three-dimensional diagram with temperature, pressure, and shearing-stress as co-ordinates.
"One case there is which would seem to be simple; viz. that of two dimorphous forms, one a stress- and the other an anti-stress mineral.
It must be remembered, however, that not a few of the common minerals of metamorphism are merely
- - - FROM BELL (19631
FROM
KENNEDY
(/.96/), P
=PN2
o
KYAN/ TEANDAUS/TE
S/LL/MANI T
E
I I I I I I I300
400
500
TEMPERA
TURE, *C
600
700
800
301-CCESITE
QUARTZ
20 -OF
-VV
b9 2 4/M1-/00
200
A I12 metastable forms, in the sense of having no
theoretical field of stability, at least under stress-free conditions, and that such metastable forms are found especially where dimorphism or polymorphism enters. Thus the anti-stress mineral andalusite and the stress-mineral cyanite are
probably both metastable forms, monotropic
to-wards the presumably stable sillimanite. We must
suppose, either that under shearing stress cyanite has a field of true stability, or alternatively that the incidence of shearing stress has the ef-fect of reversing the relative stability of the two metastable forms. It may perhaps be suggested that such rocks as cyanite-schists are formed
under great hydrostatic pressure, and that we are in danger of attributing to shearing-stress effects which are really due to pressure. Since the specific gravity of cyanite (at ordinary temperature) is 3.56 and that of andalusite only 3.16, it is clear that high pressure will favour the formation of the denser cyanite wherever this form is a possible one. If this factor, however, were of foremost importance, it would still be difficult to account for the complete absence
of cyanite from aureoles of thermal metamorphism even under thoroughly deepseated conditions."
In 1951 Miyashiro reported the presence of kyanite projecting into drusy cavities in kyanite quartz veins presumably filled at one time with fluid. The implication was that these crystals had formed stably under
hydro-static pressure. There seems now to be no reason to imbue kyanite with the special properties of a "stress mineral." Nevertheless extremely high pressures are required for its formation. Clark (1961) has noted that lithostatic pres-sure seems inadequate, in general, and introduces the
con-cept of tectonic overpressure.
"These great depths of burial can be escaped, or at-least lessened, if pressures in the crust are sustained by the strength as well as the
weight of the overlying rock. The mere existence of deformation in metamorphic terrains implies that stress differences exceeded the strength of
13 the rocks, and the nature of the deformation
suggests that the stresses causing it were com-pressive relative to Fgh rather than tensile.
Lp
= mean density between surface and depth h; g is gravitational acceleration.] This implies that the mean of the principal stresses at times exceeds Fgh. The magnitude of this 'tectonic overpressure' is set by the strength of the rocksthat support it." (p. 647)
"The hypothesis of tectonic overpressures represents a return to the stress mineral concept of Harker but in modified form. Harker supposed
that the fields of stability of minerals were
influenced by shear.... In the present view, shearing stresses make possible an increased mean principal stress and bring high-pressure minerals into their fields of stability at
depths where they would normally be unstable at the prevailing temperature." (pp. 648-49)
Perhaps it is not unreasonable to extend this theory of overpressures slightly. A shallow intrusive in hydro-static equilibrium with a deeply buried magma could exert a considerable hydraulic "overpressure" on the surrounding rocks so long as it remained confined. If the Yorkville Quartz Monzonite were such an intrusive, the apparent
low temperatures and high pressures of the Kings Mountain metamorphism would be easier to explain.
The data of Kennedy (1961) is plotted as figure 1 with Bell" s curves superimposed. (Note that the pressure
axes are not equivalent.) Thesedata imply- that the
kyanite observed in drusy cavities by Miyashiro (1951, op. cit.) could not have formed stably below ~'16kb water
pressure and ev7000C (rare conditions indeed). Newton.and
xennedy '(-1963)^haVe recently reported the: de'composition 'o.hatiW'al' p'yrophyllitte:-toform' kyarite:+. uartr! +".vapor
14
at 24 kb and temperatures as low as 510 0. They postulate that pyrophyllite and other hydrated silicates persist metastably well above their dehydration temperatures and that this results in inaccurate phase diagrams of the systems involved. It would seem wise not to make too many inferences from the phase diagram for the hydrated alumina-silica system until this system has been experi-mentally clarified.
It should be mentioned that cavities with kyanite projecting into them occur at locality C21 (Henry Knob). These are shown in Plate 3c,d. The inferred temperature at this locality is : 3000C (Fig. 2 ). At locality C17 (a xenolith within the Yorkville Quartz Monzonite) the major assemblage is quartz, sillimanite, and kaolin
(kaolinite or dickite) in which most of the sillimanite has been replaced by extremely well crystallized kaolin. These relations also seem incompatible with data in figure 1 unless pH 0 is very low in the fluid phase at C21.
Despite the uncertainty in experimental work on the
system A1203 - Sio2 - H20, the triple point determination
in the system Al28i05 by Bell permits a limit to be
placed on the metamorphic temperatures of the Kings Mountain
area studied since, fortunately, a triple point assemblage
(kyanite, sillimanite, andalusite) occurs at one place in
16 with an idealized theoretical model of temperature in the aureole.
In light of Bell's data, the observation of a triple
point assemblage in the system Al2Sio5 well within the
almandine amphibolite facies may require a downward re-vision in commonly accepted metamorphic temperature estim-ates, e.g., those of Turner and Verhoogen (1960, p. 553) who estimate temperature in the almandine-amphibolite facies
2. 3 Temerature Model
Potter has mapped the contacts of the Yorkville Quartz Monzonite in the vicinity of the Kings Mountain
aluminous quartzites (Plate 2, (Espenshade and Potter, 1960)). Various workers have, however, shown rather divergent
con-tact relationships (King, 1954; J. L. Stuckey, 1958). Under these conditions, and in the absence of personal investiga-tion of this intrusive, the author has assumed a simple geometrical shape for the Yorkville Quartz Monzonite based essentially on the map of King and upon the steeply dipping contacts shown by Potter.
The chosen model is of a vertical tabular plate of intrusive rock, infinite in two dimensions and 4 miles thick. This is a gross simplification and should not be expected to produce a correspondence with analytical data
that is accurate in detail. Further assumptions are as.fdllows:
the diffusivity of wall rock and intrusive are the same
(1.27 x10-*2 cm2/sec), the intrusion occurred instantaneously,
the intrusive and wall rock are initially at uniform temp-eratures, the latent heat of fusion is negligible, and the wall rock conducts heat isotropically (Lovering, 1935).
The selection of a temperature for the intrusive is based on data of Tuttle and Bowen (1954) showing that at
>4kb pressure granitic rocks can exist as liquids at temperatures ranging down to ~v6500C if sufficient water is available. Presence of perthitic feldspar also sets
18 of intrusion (ibid.). Temperatures higher than i700 0C for the intrusion at Kings Mountain are excluded by the presence-of the 3 phase assemblage kyanite-sillimanite-andalusite near the contact. For the other necessary boundary condition, a wall rock temperature of 1000C was chosen somewhat arbitrarily. Standard estimates of the geothermal gradient would yield somewhat lower values.
Under these conditions one may use the equation given by Lovering (1935) (which is derived in Ingersoll, Zobel, and Ingersoll, 1954) for heat flow in an infinite medium:
T -T
T(x,y,z,=t) + -- 8 wCerf(a)+erf(b)][erf(c)+erf(d)][erf(e)+
+erf(f)] (1)
where T(x,y,zt) = temperature of any point (x,y,z) at time t
T = initial wall rock temperature Ti = initial intrusive temperature
erf(a) is the error function ,4ae. da
x1 + x
(a
=
, X = semidiameter of intrusive along2h/I x axis h = diffusivity) b 2 erf(b)
=
ego da 0 (b = 2h/t etc.19
For y and z inf inite:
Eerf(c)
+ erf(d)][erf(e) + erf(f)]=
4, and (2)equation (1) can then be simplified.
T T a 2b 2
T(x,t) = T + T TW2 ea 2da + e-a 2da] (3)
w
2
Trjf Tr f0 0
Evaluating this according to the assumptions discussed above:
Tw = 100 0C Ti
=
7000C(h2)granite -' (h2)wall ^' 1.27 xlO2 cm2/sec, (Ingersoll, rock
Zobel, and Ingersoll, 1954).
x = 3.22 x 105cm = 2 miles
T(x,t)
=
100
+
600[a (3.22x10
5+
x)/T.226/te.a2da
+
0 (3.22x10⁵ - x)/-.226/t 2 0The curves generated by this equation are shown in figures 2 and 3 . In figure 4 the location of the three phase A12Si0 5 assemblage (06) is shown along with the
possible range of error in the temperature determination
of the triple point as determined by Bell (1963).
Although the assumptions used in constructing.figutre 2 are such that only qualitative significance can be attached
DISTANCE
.5
.0
22 reasonably well the observed triple point assemblage and the temperature gradient inferred from facies mapping (Figure 4 , taken from Espenshade and Potter, 1960).
The two most likely geometrical variations from the model are that the intrusive is not infinite in two dimensions and that the heated region is truncated by the earth's
surface. Neither of these effects would change the initial temperature of metamorphism at the contact, but both would cause more rapid cooling of the magma with consequent
steepening of the maximum temperature envelope in figure 2. The assumption implicit in equating the maximum temp-erature envelope with the temptemp-erature of metamorphism is quite general to metamorphic petrology. It is that a sample collected anywhere along the temperature gradient represents an assemblage which reached equilibrium under
conditions closely corresponding to the maximum temperature achieved during metamorphism. A qualitative justification for this assumption in terms of kinetic theory is given in Fyfe, Turner, and Verhoogen, 1959, p. 96 ; and in Turner and Verhoogen, 1961, pp. 485-87.
23 2.4 Pressure
It is an assumption of this study that pressure over the Kings Mountain outcrop area sampled was essentially constant during the time of metamorphism and that it equal-led "8kb (a requirement set by the pressure of the triple point assemblage kyanite-sillimanite-andalusite at locality
C6).
A further observation may be made that kyanite occursat locality C26 at a distance of 4.4 miles from the in-trusive. At a temperature of 1000C (a minimal estimate) the pressure would have to be at least 6kb for kyanite to be stable (figure 1, from Bell, 1963). This would mean
that the maximum pressure variation among the samples in this report 4 600 bars. A mechanism by which such extra-ordinary pressures could be achieved was suggested in the preceding section. The interesting idea of comparing natural environments to laboratory high pressure devices
is developed by Jamieson (1963).
Experimental data on the effect of pressure on aluminum solubility in quartz is of limited significance because
the resulting lattice changes are near the limit of de-tection by X-ray equipment. J. Kalnajs of the MIT Insulat-ion Research Laboratory was unable to observe consistent variations in the lattice parameters of a suite of samples from the Kings Mountain area (samples C5, C23, C18,
standard quartz from "vein 5"). This work is further
described in Appendix A.
can be expressed as A12Si5 concentration) as a function
of pressure variation can be discussed by applying Eq. (9.132) of Kirkwood and Oppenheim (1961) to very dilute solid solutions. Then ~
-quartz kyanite og x Al.0 = A23105 A1 2S10g(1) P an gquartzRT )T 22
Here x 23105 = concentration of A28105 in quartz
AA12S105
(
A
2si
5
Al/siO
915.05_ TP
922 ~
-RT
4Al2 io5 = chemical potential of Al2Sio5
;quartz Al
=
partial molar volume of Al2Si05 in quartz2siO5 2 5
kyanite = molar volume of kyanite
P = pressure
R = gas constant
T = absolute temperature.
The quantity g2artz
>
0, and for an A&&L solution isequal to2.
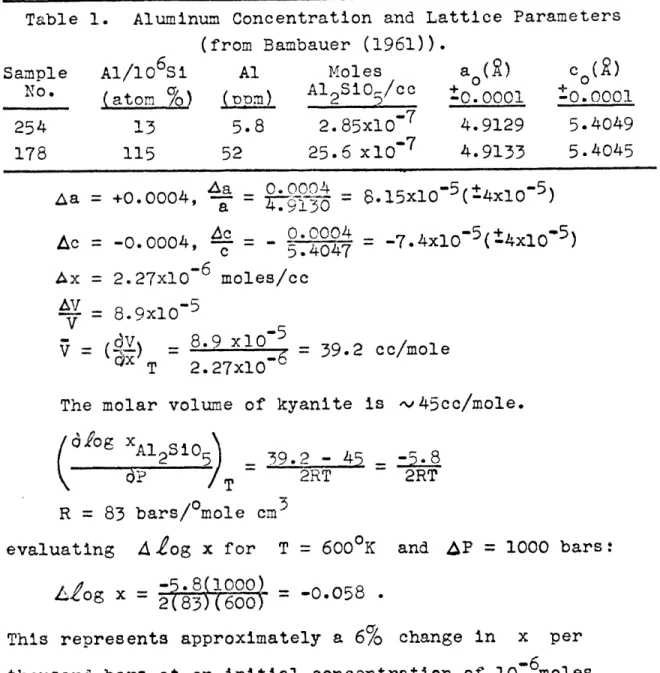
A calculation based on the data in: Table 1 is presented below. The volume of the quartz unit cell is:
3 a2c
2
.*. dV = q(2ac da + a2do)
dV =2da + dc (2)
25 Table 1. Aluminum Concentration and Lattice Parameters
(from Bambauer (1961)).
Sample Al/106Si Al Moles a(A c(A
NO. (atom o) (m) A12Si0/cc 0 10
(a__ n)___ Al__ 25 0.0001 -0.0001 254 13 5.8 2.85x10~7 4.9129 5.4049 178 115 52 25.6 x10~7 4.9133 5.4045 Aa = +0.0004, a = 0 = 8.15x1-5(+4x-5
Ac
=
-0.0004,
=
-
O:2I02
-7.4xl0-5(+4x10-
5)
Ax = 2.27x10⁻⁶ moles/cc AV =89lV
8.9x10⁻⁵E
=
(X)
=
8.9 x10 56=
39.2 cc/mole T 2.27x10The molar volume of kyanite is .-45cc/mole.
Oiog x Ali2O5
-
45-TP
/T
2RT 2RTR = 83 bars/0mole cm3
evaluating A tog x for T = 6000K and AP = 1000 bars: AL'-og OgX-x
=
258(10-=
-0.058 .2 ( 8 3 )( 6 0 0 )--008
This represents approximately a 6% change in x per thousand bars at an initial concentration of 10-6moles
Al2Si05/cc. Thus, in view of the estimated maximum 600 bar
pressure variation over the sample area, it can be asserted that the effect of pressure on aluminum solubility in quartz within the area studied is small and probably negligible
a A slightly irrelevant point concerns a third quartz of
Bam-bauer, the lattice parameters of which are given in the same table. It is a lamellar quartz with very high Al content. Calculation of the partial molar volume of Al in this quartz
(from cell constants) shows that it is ~wl5 cc/mole (vs. 45 for kyanite, one of the densest of silicates). This would seem to be compelling evidence that most of the aluminum in this quartz has gone into a separate phase (perhaps submicroscopic in dimensions), a conclusion which may clarify the undefined expression "interstitial aluminum" found in the literature
26 Theoretically, a more complete way of defining
meta-morphic conditions would be a parallel study of xquartz
quartz Al 2Sio 5
and x Ta 2 from a quartz-kyanite-rutile bearing assemblage.
This could lead to a unique characterization of the temp-erature and pressure of metamorphism. For this it would be necessary that (dx/dT) and/or (ax/cP) be different for the two substances. An attempt was made to study both Al and Ti variations in the Kings Mountain quartzes.
Unfortunately, xquartz TiO is low (except in high quartz);
2
and the size of rutile grains in these samples ranges from "0.5 mm to
<<lp.
It proved impossible to reduce the Ticontamination level below 30 - 50 ppm (vs. a probable solubil-ity of
-5
ppm).27
III. AREA STUDIED 3.1 General Descriotion
Kyanite (and/or sillimanite) bearing quartzites from the vicinity of Kings Mountain, North Carolina - South Carolina were selected for this study. There were three important reasons for this choice:
1) Presence of a mineralogically simple
quartz-Al2Sio5 assemblage which is lithologically similar through-out and which contains separable phases,
2) Existence of a demonstrable thermal gradient across the area during the time of metamorphism, and
3) Availability of maps and other published material to simplify sample collection and analysis of results.
It is the second factor which distinguishes the Kings Mountain area from a number of Al2 SiO5 bearing deposits
extending from Virginia to Georgia (Plate 1). The important localities in this belt have been described by Espenshade and Potter (1960), and it is from their monograph that the location maps in this thesis are taken.
The aluminous quartzites of the Kings Mountain area (Plate 2) consist of bedded, metamorphosed, quartzose sandstones and conglomerates which probably contained, at one time, varying amounts of kaolinitic material. The con-glomerate pebbles are of two kinds:. single bluish quartz
crystals whose color is imparted by fine inclusions, and pebbles made up of multiple quartz grains. With increasing grade of metamorphism, the conglomeratic texture of the
28 quartzite becomes much less obvious. Other minerals present in addition to kyanite or sillimanite include pyrite, rutile
(in tetragonal grains of various sizes), kaolinitic altera-tion products, magnetite, ilmenite, micas, and occasional topaz, zircon, tourmaline, and, in one locality, andalusite (associated with sillimanite and rare kyanite). Poikiloblast-ic crystals of kyanite in the area contain quartz inclusions suggesting that they were formed by the reaction:
Al2S 205(OH)4 -+ Al2SiO5 + Sio2 + 2H20.
kaolinite kyanite quartz
At the lowest stages of metamorphism, rutile exists
as rather spongy, reddish grains, while at higher stages of metamorphism only stubby yellowish brown tetragonal prisms and bipyramids are observed. Pyrite also seems to show a change of habit with increasing grade of metamorphism. Plate 3(a,b) shows photographs of pyrite from locality C10 (3.3 miles from the Yorkville Quartz Monzonite) and from C21 (1.2 miles from the intrusive). In the albite-epidote-amphibolite assemblage at C10, the pyrite has well develop-ed faces which are most often cubic. In the amphibolite facies assemblage at C21, on the other hand, there is a statistical prodominance of pyritohedral faces. In ad-dition, more grains are rounded and indented than at ClO. Near the intrusive (locality C5), pyrite crystal faces are rare. Most grains here are stretched into irregular
plates and indented by other minerals. This variation in habit may well represent systematic changes in composition.
29
The occurrence of the triple point assemblage, kyanite-sillimanite-andalusite (locality C6), is of some importance to this study. Kyanite occurs, but is not common at this locality. So far as textural evidence can be trusted, sillimanite appears to replace andalusite. Although the assumption of equilibrium is probably a good approximation, it is probable that one or more aluminous phases persisted under conditions of limited metastability. Reference to figure 1 shows that petrographic observations are most easily satisfied by constant pressure slightly below the triple point pressure of 8kb, and by a rising temperature passing from the kyanite field through the field of and-alusite into the stability field of sillimanite to a max-imum temperature slightly higher than the triple point
30 3.2 Sample Description
dO is a fresh outcrop of kyanite-bearing quartzite occurring near a dirt road at the south end of Sherrars Gap 3.3 miles from the nearest outcrop of the Yorkville Quartz Monzonite (this and subsequent samples are shown in Plate 2 (in pocket)). This is one of 5 kyanite-bearing samples from the entire area which contain fresh pyrite, although in all other outcrops the presence of heavy iron oxide stains, often filling cavities in the shape of
pyrite grains, demonstrated that pyrite .s. a part of the original assemblage in all of the quartzite samples. The pyrite at this locality displays predominantly cube faces in contrast to its habit in other localities (Plate 3). The quartz here is obviously of conglomeratic origin and the quartzite contains numerous blue quartz pebbles.
Kyanite is not well crystallized here and is not so easily recognized in hand specimen as it is in more highly meta-morphosed rocks. Muscovite is present, and textural re-lations suggest that it replaces kyanite. Rutile is present in spongy, reddish brown, opaque crystals.
C23 is an excellent exposure at the south end of Crowders Mountain, 1.4 miles from the nearest outcrop of the Yorkville Quartz Monzonite. Some of the quartzite here has been exposed to relatively slight weathering and, although no pyrite was seen in hand specimen, some was
observed after grinding and chemical removal of iron oxide. Kyanite occurs in well formed blades showing parallel
31 alignment. Rutile occurs here in clear brown crystals. A heavy liquid separation of material having a density
42.65 reveals that a number of quartz grains contain
voids similar to those shown in Plate 4.
C21 is the site of an active kyanite mine on Henry Knob, 1.2 miles from the nearest outcrop of Yorkville
Quartz Monzonite. Mining has exposed fresh rock here, the freshest outcrops in the area. Pyrite is abundant. Py-ritohedral faces are developed predominantly, although the pyrite here tends to be more rounded and indented than at
C10 (Plate 3). Kyanite is abundant and occurs in well
formed colorless blades. Rutile occurs in small, well formed brown crystals. Open cavities with kyanite blades projecting into them were found at one place in this mine
(Plate 3). These cavities are concentrated in one portion of a" hand specimen and seem to represent some sort of vein.
No associated alteration of any kind was observed. These cavi-tietilay rbe compared with those described by Miyashiro (1951),
dis-cussed elsewhere in this report (p. 12).
C18 is an exposure of kyanite-bearing quartzite at the base of Crowders Mountain, 0.72 miles from the nearest
outcrop of Yorkville Quartz Monzonite. The quartzite is somewhat weathered, and no fresh pyrite was observed.
Rutile here is fine grained but well crystallized. Kyanite occurs in sub-parallel well crystallized blades. The
poikiloblastic nature of kyanite from this locality is
32
Abundant voids are found in quartz from this area. Examples
are shown in Plate 4. Some mica and some kaolinitealter'ation
product were observed in the sample from here.
C5 is a sillimanite-bearing quartzite near the York-ville Quartz Monzonite contact. Sillimanite occurs in fine needles (Plate 5), but these are considerably larger than at the place of first appearance of sillimanite (triple point locality
C6).
Other metamorphic minerals are rutile, pyrite, muscovite, and possibly kaolin. Kaolin is either the result of a univariant equilibrium established during metamorphism, or an alteration product, either of late metamorphism or of weathering. Pyrite is, to some extent, replaced by iron oxide, as well as by a soluble iron33 3.3 Origin
Espenshade and Potter (1960) discuss the origin of the Kings Mountain aluminous quartzites in some detail.
They state (p. 24):
"The deposits of ... kyanite quartzite and
sillimanite quartzite in the Kings Mountain
district, North Carolina - South Carolina, prob-ably are metamorphosed sedimentary rocks. The
principal feature ... pointing to this origin
is the occurrence of the high-alumina quartzite
in persistent layers that have the distribution
patterns of stratigraphic units. These layers occur in rather restricted stratigraphic positions in sequences of metamorphosed sedimentary and
volcanic rocks. Many layers extend for distances
of more than 1 mile; the longest body .. in the
Kings Mountain district [is] about 3 1/2 miles long. Two thin layers of kyanite quartzite are parallel to each other, 20 to 100 feet apart,
for a distance of over 1 mile in the Kings
Mountain district. In this area kyanite-bearing conglomerate, kyanite quartzite, and kyanite schist grade into one another along the strike, and kyanite quartzite is interlayered with
kyanite-staurolite quartzite and with barren quartzite.... the high-alumina quartzites are strongly folded concordantly with the other meta-morphic rocks.
"These features are all characteristic of metamorphosed sedimentary rocks. There seem to be but two possible modes or origin for the
high-alumina quartzites in the ... Kings Mountain ... [district]. They have either been formed from sandy sediments containing clay or bauxite that have been folded and metamorphosed to their
present state with little bulk change in chemical
composition, or they have originated by very selective replacement of certain beds, probably mainly sandstone.... it is concluded that this
[the latter] process is improbable for the origin
of the high-alumina quartzites in ... (this district).
Various other origins have been suggested for the Southeastern kyanite deposits. These require such things as volcanic emanations and widespread aluminum metasomatism; and some of the earlier theories have been strongly colored
34 by Harker-s concept (1939) of kyanite as a "stress mineral.
In this thesis it is necessary to assume only thatt 1) The specific rocks studied arrived at their present mineralogy as the result of chemical reactions occurring under steady state conditions which approximated equilibrium for any small sample;
2) The driving force for these reactions was the intrusion of a large granitic body, the Yorkville Quartz Monzonite;
3) Certain testrictions can be placed on TP LH2O 2
35-Figure
4.
Sketch map of southern part of Kings Mountain
area (North and South Carolinas) showing metamorphic facies
boundaries. Samples are located at the centers of circles
whose radii indicate distance to nearest intrusive outcrop.
(From Fig. 42 of Espenshade and Potter, 1960. References
in explanation refer to that publication.)
36 3.4 Metamorphism
The metamorphic grade of the aluminous quartzites in the area, as determined in the surrounding schists and gneisses, ranges from greenschist facies to amphibolite facies (Figure 4). Metamorphism is the result of intruss-ion of the Yorkville Quartz Monzonite (probably --260
million years ago, Espenshade and Potter (1960, p. 80)). Thus, although the assemblages and textures are character-istic of regional metamorphism (Fyfe, Turner, and Verhoogen, 1958) and have been fitted into this classification (Es-penshade and Potter, 1960, p. 83), they have really been produced in a large contact metamorphic aureole.
The Ybrkville Quartz Monzonite is described by
Es-penshade and Potter (1960, p. 79) as a coarse grained quartz-monzonite (orthoclase:plagioclase ratio, 35:65). It is
medium to dark grey, frequently porphyritic, with flow structure defined by parallel orientation of feldspar phenocrysts and biotite. Feldspar phenocrysts consist of perthitic microcline and of plagioclase (An2 5 - An3 8)*
Hornblende occurs rarely in place of biotite. The in-trusive varies from 2 to 7 miles in width and is more
than 55 miles long. As is mentioned in a pareoeding sect-ion on the temperature gradient within the area (p. 17), there are varying interpretations of the contact relations of this intrusive.
37 IV. EXPERIMENTAL PROCEDURES
4.1 Separation
The research reported here has been guided by simple theoretical principles. The analytical techniques used
are also quite simple and straightforward. It has, however, proved difficult to obtain pure samples for analysis.
2.3 pg of kyanite in a 15 mg quartz sample, (1.5 x 10⁴ gm/gml would contribute 50 ppm to the measured aluminum content of
the quartz. This is I yeda/- '*4,: a4 the measured concentration of Al in solid solution in one of the quartz
samples reported on here and is 4bort'e:qtal:to that of
One
of the other samples. Yet one of the requirements followed in selecting samples is that at least one of the polymorphs of A128iO5 be intimately associated with quartz.Because of the need of high purity quartz for study, and because of the difficulty in obtaining pure concentrates of quartz from typical rocks, most previous investigators have studied large, clear, atypical crystals.
A number of properties of quartz are dependent upon its composition and, therefore, indirect measurements of comp-osition can conceivably be made. An example of this is given in the work of Tuttle and of Keith (op. cit.). Other
indirect methods of possible significance are described elsewhere in this paper. These include accurate measure-ment of the quartz lattice constants, measuremeasure-ment of the infrared spectrum of quartz, and measurement of the color center activity produced by irradiation with y-rays.
M7a Variation in these properties is governed by substitution
in the quartz structure, but considerable refinement of the techniques is required before they are applicable to the quantitative determination of elements in the quartz of normal rocks.
Quartz grains in the suite of samples from the Kings Mountain area contain particles ranging in size to less
than a micron. These are separated from one another by distances of the order of a few microns,(Plate 5). To purify material such as this it must be ground to a very fine powder. The detailed separation technique used has, been developed empirically. This technique depends for its effectiveness on the fact that-virtually all of the impurities in the Kings Mountain suite of samples (kyanite, sillimanite, andalusite, rutile, pyrite) are considerably denser than quartz (3.6, 3.2, 3.2, 4.2, 5.0 g/cc, respect-ively vs. 2.65 g/cc for quartz). Clay- minerkkl: and-fluid inclusions"., are - .ebeilye&eliminatede in the'deuence y
6'f1 %-operations. Samples containing large quantities of mica are uncommon, and such minerals as feldspar are not encountered.
Samples chosen for analysis are coarsely ground in a large steel mortar or in a laboratory jaw crusher, The resulting.coarse powder is seived through a nylon stocking.
(Since exact edinguas not critical, a stocking is preferred
to ordinary screens because it introduces much less con-tamination.) Screened fines are soaked in 6F HC1 (Vycor
38 distilled) at ~,450 C for several days with 2 or more daily changes of acid until the wash acid remains clear and no oxide coatings are visible. The acid is removed by washing the sample 6 or more times with demineralized water. During this procedure only about 10 seconds are allowed for settling so that very fine material is washed out.
The next stages of purification depend somewhat upon how the sample appears under microscopic examination.
Rules have been established to exclude the very fine material which contains concentrated sillimanite, rutile and kyanite,
and also to eliminate large particles containing one or more inclusions of sillimanite, kyanite, or rutile. A
further rough density separation (tetrabromoethane used in a column or funnel) is usually necessary to remove heavy minerals previously cemented by oxide coatings. If
there is any evidence of clay alteration products, the sample is subjected to ultrasonic vibration for 5 or more hours in a polyethylene bottle partially filled with de-mineralized water. The water is then decanted periodically
until two successive washes show no sign of suspended material. If any mica remains at this stage, the sample
is placed in an evaporating dish with a dilute -lN
solu-tion of HF and evaporated to dryness. Repeated HF leach-ings are conducted until no trace of mica remains. The
quartz which remains after this treatment is washed thorough-ly. Fine heavy minerals freed by the leaching are removed by centrifugation at 1000 rpm in a tetrabromoethane acetone
have a fine coating of insoluble residue on its surface. This residue has been found to contribute as much as
20% to the measured aluminum content of one test sample, To remedy this, samples are ground to a fine powder by
hand in a boron carbide mortar, eluted in water and that fraction which does not settle through 10 cm. in 5 minutes
(smaller than 20p) is discarded. After the coarser material has settled and dried it is again ground and washed. This removes virtually all of the coating material.
At this stage all samples are ground to a fine powder in a boron carbide mortar. That fraction settling through 10 cm of water (the length of a 50 cc round-bottom centri-fuge tube) in 5 - 15 minutes is selected for analysis. (This corresponds to ^.12 - 20p.) Repeated elutriation and grinding is carried out until 0.1 - 0.2 g of sized fines is available. The size range selected is somewhat flexible.
Standard heavy liquid separation techniques such as those described by Browning (1961) are wholly inadequate to separate the particles in this powder despite the dis-parity in their densities (3.36 - 2.65 g/cc). This is
true because electrical surface charges on these fine particles are so great that clotting occurs in any non-polar solvent. Among the standard heavy liquids, only a thallium formate solution would be free of this objection, and this compound was rejected because of its extreme
40
(oral communication, 1963) is to neutralize surface charges with the surface agent, n-hexylamine HC1. This chemical was prepared by adding 6N Vycor distilled HC1 to n-hexyl-amine, evaporating to dryness, and precipitating from an acetone-water mixture. About 7 milligrams of hexylamine HC1 is added to 10 ml of a bromoform-ethanols mixture of density 2.70 g/cc (9.1 ml bromoform, .9 ml ethanol). The powder to be purified is first centrifuged in this mixture at 2000 rpm (240 g) in a closed tube for ~45 minutes
after which it is washed thoroughly with acetone, dried, and examined microscopically. If large particles of heavy minerals remain, the step is repeated (two centrifugations are common). When most of the larger heavy mineral grains have been removed the sample is ready for final
purifica-tion.
Final purification is done in a Beckman Instrument Company Spinco Model L ultracentrifuge equipped with an SW40 head. The main effect of this step is a more efficient removal of heavy particles than is possible with slower
centrifuges and, apparently, the plucking off of grains loosely cemented to the quartz.
Runs of 180 minutes at 25,000 rpm and 650F (~ 180C) are made. With an 8 ml sample this produces an acceleration
* The choice between bromoform and tetrabromoethane is largely a practical one. Bromoform is less viscous and therefore gives faster separations. Tetrabromoethane is considerably cheaper and can therefore be thrown away after
at the sample surface of 39,800g (FiLg.5). The heavy liquid used is ethanol-bromoform (0.91 ml:7.1 ml) plus ^s7 mg
of n-hexylamine HC1 per tube. This mixture, together with the sample, is placed in standard polypropylene tubes with anodized aluminum tops fitted with neoprene rubber washers. At the end of a run, quartz is skimmed from the tube with
a polyethylene pipette to which is attached a 25 cc syringe. None of the abrasive quartz suspension is allowed into the syringe. The sample is finally washed 4 times in acetone, once in water, once in 2N HC1 and 5 times in water and is ready for analysis after drying at 11000.
These techniques were developed on a borrowed machine which could not be modified. They are inefficient in
several respects.
1) Under the pressures produced in this machine, both ethanol-bromoform and methanol-bromoform separate into
2 phase regions. Quartz appears at the interface. There-fore, the maximum density difference is not achieved with either liquid. Machine availability did not permit study of the two phase region.
2) Standard tubes supplied for this machine are
poorly suited for heavy liquid work. With stainless steel tubes the sample cannot be observed. Plastic tubes supplied are polypropylene and lusterloid. The lusterloid tubes
are completely soluble in heavy liquids and are therefore unusable. The polypropylene also is somewhat soluble in bromoform-ehtanol at high pressure. The tube thus becomes
F/GURE 5. DIAGRAM OF L/LTRACENT/RFUGE
43 brittle and some of the liquid leaks through. Only
stain-less steel and lusterloid tubes are available for the centrifuge heads with pivoted sample holders, "swing out" type. Considerable remixing of the sample can occur during deceleration with the SW40 head (even though this is
ex-tended over ~1/2 hr.). Carefully machined and balanced
teflon tubes which could be used with a swing out head would be useful.
3) The anodized aluminum caps provide a disconcerting possible source of contamination. This is paralleled by
aluminum foil seals on many organic reagent bottles (methanol, isopropanol, acetone). Reaction with a centrifuge cap
was observed in only one case, however; and in this case the anodized Surface of the tube cap was scarred. HCl-water washings which follow are intended to remove any soluble Al that may be present.
If suitable salts could be found, it would be possible to produce density gradient cells similar to the CsC1
density gradient cells of the biologist. These cells are capable of resolving molecules differing in a single isotope.
44
4.2 Spectrogranhic Analysis
4.2.1 General
Aluminum and lithium in the Kings Mountain quartz suite have been determined spectrographically in the Cabot Spectrographic Laboratory. In this work, Ahrens (1960) has served as a guide to general determinative
techniques. Of more specific applicability to quartz analysis are the papers of Dennen (in preparation for publication)
and of Bambauer (1961). Details of the analytical pro-cedure used are given in Table 2. Although arrived at essentially independently, the technique for determining Al closely resembles that described by Bambauer.
The general sequence of analytical operations can be summarized as follows: Those samples requiring dilution are weighed on an analytical balance. They are then premixed on glazed weighing paper and placed in a teflon cylinder which is vibrated with a dental type homogenizer for 5 to 30 minutes depending on sample size. All samples are loaded into spectrographically pure electrodes using a teflon holder similar to that described in Holyk (1952). In the present model, a graphite rod is substituted for the brass holding screw. Tamping is accomplished with a lucite rod.
The spectrograph used is a Littraw-mounted instrument manufactured by Hilger and Watts, Ltd. and equipped with automatically interchangeable quartz and glass prisms. The image of the are is focused on the collimating lens
45 Table 2. Analytical Conditions
I. General Spectrograph Slit width
Film development
Film measurement
Hilger, large quartz-glass prism 0.030 mm
4.5 minutes in Kodak D19 at 200C (1 liter developing tank, 50 ml developer changed/plate)
Hilger nonrecording microphotometer
II. Aluminum Determination Electrodes Excitation Diluent Analysis lines Comparison standard Sectoring Film
0.18" carbon (National Carbon Company L113SP) drilled to 1/8" depth with a 1/8" diameter drill, tip honed 590 from vertical
12 amperes, D.C., sample arced as
anode (Sample arced to completion) 1:1.2 mixture sample:specpure graphite
(by weight)
Al 3092.7 (Ti 3234) Si 2970.3
4 step, 1:4 sector
Kodak Spectrum Analysis-1 plates III. Lithium Determination
Electrodes Excitation Diluent Analysis line Comparison standard Sectoring Film
1/8" graphite (National Carbon Com-pany AGKSP) drilled to 5 mm depth with a 1/16" diameter drill. These
are pre-arced 15 sec. at 6 amps
before use.
5 amps, D.C., sample arced as anode for 20 sec.
10:1 mixture sample/repurified RbCl (from Johnson-Mathey specpure
No. 4418, 1 ppm Li reported) Li 6707
Rb 7280
8 step, 1:2 sector Kodak 1N plates
46
Table 3. Analytical Standards for Aluminum and Lithium Determination
I. Quartz (Vein 5 standard) + Al2Si05 (from
contains some rutile)
sample 028, Mixture designation
Al
2S10
5
Designated mixture S1 0 2 Al added 0.0074 -o - 0.0266(Mix.A) 0.2630 9.37x10³ 0.2204 1.01x10³ C - 0.0249(Mix.B) 0.2265 D - 0.0273(Mix.C) 0.2250 E 0.0043(Mix.B) 0.0336II. Quartz (Vein 5 standard) + A1203 (other
halides are present in this mixture)
100 10.9 33.8 oxides and Mixture designation IB II II IV V
Al203 Designated mixture
0.0510 0 4 85 5 (other oxdes and halides) 0.0353 (IB) - 0.0392 (II) - 0.0455 (III) - 0.0466 (IV) 5i02 Al added mP-pm - 5.03x10 0.3176 5.04x10³ 0.3512 5.05x10⁻² 004087 0.4163 5006 5.09
III. Lithium Standards (Vein 5 standard + spodumene
(LiAlSi206 Mixture designation LiAlSi 206 Designated mixture Sio 2 Li added 0.134 0.0333 (a) 0.0333 (0) 0.0333
(Y)
0.0333
(W)
0.0450 (6) 0.0251 (Y) 0.366 10 0.3000 103 0.3000 102 0.3000 0.3000 0.1018 10 1 3.06 0.1046 ~19.3 -eY. 1
47 by a long focal-length silica-glass lens placed in front
of the slit. Spectra are recorded on 4"xio" glass plates and line densities are read with a Jarrell-Ash non-recording