MITLIBRARIES DUPL
Digitized
by
the
Internet
Archive
in
2011
with
funding
from
Boston
Library
Consortium
Member
Libraries
11 1-15
Massachusetts
Institute
of
Technology
Department
of
Economics
Working
Paper
Series
THE
ALTERNATIVE
MINIMUM
TAX
AND
EFFECTIVE
MARGINAL
TAX
RATES
Daniel
R.
Feenberg
James
M.
Poterba
Working
Paper
03-37
October
2003
Room
E52-251
50
Memorial
Drive
Cambridge,
MA
021
42
This
paper
can
be
downloaded
withoutcharge from
the SocialScience
Research Network Paper
Collection athttp://ssrn.com/abstract=47060
1MASSACHUSETTS
INSTITUTEOF
TECHNOLOGY
The
Alternative
Minimum
Tax
and
Effective
Marginal
Tax
Rates
Daniel R. Feenberg
NBER
James
M.
PoterbaMIT
andNBER
October2003
ABSTRACT
This paperexaminesthe impact ofthe Alternative
Minimum
Tax on
the weightedaveragemarginal tax rates thatapplytovarious
components
oftaxable income.It also considers theimpact ofseveral
AMT
reformproposalson thenumber
ofAMT
taxpayers, the totalrevenuecollected fromthe
AMT,
and the weighted averagemarginal tax rates thatapplytowages,capitalincome, anddeductionssuchasstate and localtaxes and charitable gifts.
The
paperuses theNBER
TAXSIM
model
toproject federalpersonalincome
tax liabilitiesaswell asAMT
liabilitiesbetween 2003 and2013.
The
AMT
hasonly amodest
impacton theaveragemarginal tax ratesfor
most
sources ofincome
becausesome
AMT
taxpayersfacehighermarginal taxrates,andotherslowertaxrates, as aresultofthetax.
The
projectionsshow
thatmodest
increases in theAMT
exclusion levelhavesubstantial effects on thenumber
ofAMT
taxpayers, andthatindexingthe
AMT
parameterswould
reduce thenumber
ofAMT
payers in2010 by more
thansixtypercent. These changes
would
alsoreduce theAMT's
impacton averagemarginal taxrates.We
areextremelygratefulto InnaShapiro for assistancewiththeTAXSIM
program,toRosanne
Altshulerforhelpfulcomments,
andtothe Smith RichardsonFoundation, theNational1
The
AlternativeMinimum
Tax
(AMT)
isaprovisionoftheU.S.income
taxcodethatcurrently affects amodest
number
oftaxpayers. Itwillbecome
anincreasingly importantcomponent
ofthe federal tax system inthecoming
decade.The
minimum
taxbeganin 1970asaten percent,andlatera fifteen percent, taxon preferences inexcess of $30,000. Preferences
included accelerated depreciation, oil depletion, andthe capitalgains deduction.
A
deduction ofonehalfofregulartax paid,andlaterofalltax,
was
allowedagainstpreferences. Netoperatinglosses andretirement
income
receivedspecialtreatment.The
minimum
taxexpired in 1981. Beforeits expiration, however,in 1979,anew
"Alternative
Minimum
Tax" was
establishedwithabase thatincludedall thecomponents
ofAdjustedGross
Income (AGI)
andthe capital gainsdeductionin additiontopreferences.The
new
AMT
allowedthe fullamount
of regularincome tax asa credit. Aside from changes in thetreatmentofnet operating lossesand slightchanges intheexclusion amount, thisisthe
AMT
thatiscurrentlyin force,andthat isscheduledtoremain inforce indefinitely.
When
apreferential taxrate forlong-termcapital gains
was
establishedin 1991, carewas
takentoavoid treating capitalgains asapreference.
A
number
of research studiespublishedsince the late 1990s have identified theAMT
asagrowing factor inthe
income
tax structure.Harvey
and Tempalski (1997)were
among
the firsttopoint outthatbecause theexclusionlevel for the
AMT
was
not indexed forinflation, whilemost
other keyparametersinthe tax code
were
indexed, theAMT
would
applyto agrowingnumber
oftaxpayers. Rebelein andTempalski(2000),theU.S. Congress Joint
Economic Committee
(2001),Tempalski (2002), and
Burman,
Gale,andRohaly (2002) provide furtheranalysis ofthegrowingimportanceofthe
AMT.
The
AMT
became
more
importantafterthepassageoftheEconomic
Growth
andTaxpayer
ReliefReconciliationAct of 2001(EGTRRA),
which
reduced ordinaryincome
taxtwo
examples ofstudies thatshow
thatbecauseEGTRA
loweredincome
tax liabilities formany
taxpayers, itwill raisethe
number
ofAMT
payers.The
Jobs andGrowth
TaxpayerReliefReconciliationActof
2003
reinforcesthis effect. Formany
upper middleincome
householdswho
willface the
AMT
as a resultofrecenttaxreforms,theAMT
"takesback" a substantial shareofthe potential tax reliefassociatedwiththesereforms.
Burman,
Gale and Rohaly (2003a,2003b)suggestthatin2010, 33.8 percentofthe
EGTRRA
tax cuts willbe"recaptured" intheform
ofhigher
AMT
liabilities. Thispercentageexceeds 65 percent fortaxpayerswithAGI
between
$100,000 and $500,000.
Sullivan (2002) offersa careful review ofthe issues associated withthe potentialrepealof
the
AMT.
Proponents ofrepealpointtothe potentialcomplianceburdenofthe tax,which caneffectivelyrequiretaxpayersto prepare
two
taxreturnsandtocompare
the results,andtotheunanticipated impacton taxpayerliabilities.
The
potentialrevenuecostofAMT
repealisasubstantial impedimenttosystematic reform.
Inthispaper,
we
use theNBER's
TAXSIM
program
to evaluate the impactoftheAMT
on
incentivestowork
andto save.We
presentsome
estimates ofthe growingnumber
oftaxpayers
who
will face theAMT,
but theyare notthe central focusofthe study.We
emphasizeprojectionsforcalendaryear 2010, sinceundercurrentlaw,this istheyear
when
theAMT
willaffectthe largest
number
oftaxpayers.A
number
ofincome
tax provisionsarecurrentlyscheduledtoexpire in2010,so the taxenvironmentin2011 will besubstantially different
from
thatin 2010. Although our projectionsrelyon strongassumptionstoproject the future
number
oftax returns andthe leveland composition of
income
on thesereturns, theyoffersome
insighton
the likely futurecourseofthe
AMT
relativetothe ordinaryincome
tax.The
paperisdividedinto six sections.The
firstdescribes thebasic structureoftheAMT
and comparesalternative
minimum
taxableincome
with taxableincome
asdefinedundertheanditpresentsour projections ofthe
number
ofAMT
taxpayersinaggregate, andinincome
sub-categories, for futureyears.
Our
results fromtheTAXSIM
analysis arebroadlyconsistentwiththose fromotherrecent studiesthatproject future
AMT
liabilities. Sectionthree describestheprobabilitythattaxpayers invarious
income
categories will face theAMT.
It also studieshow
various reformproposals
would
affectthese probabilities.The
fourth section investigates theimpact ofthe
AMT
onthe weightedaverage marginaltax rates thatapplyto wages, interestincome,dividend income, andseveral
income
taxdeductions. Itconsidersmarginal tax ratesassociated withthe federal
income
tax, aswell asthetotal effective tax ratethatcombines thefederal
income
tax withthe potentially-deductible stateincome
tax. Section fiveexplorestheeffectof various reformproposalson the weighted averagemarginal tax rates
on income
anddeductionflows. Thereisa briefconclusion.
1.
The
Structure ofthe AlternativeMinimum
Tax
Although the
AMT
issometimes describedasacomplex
andmysterioustax, formany
taxpayers
who
face theAMT,
theAMT
calculationis straightforward. Fortaxpayerswho
do notitemize,the "tentative
AMT"
is 26percentofAG
I inexcessofan exclusionamount. Fortaxpayers withalternative
minimum
income
above $175,000,theAMT
tax rate is 28percent.The
AMT
is paid asanactual tax liability onlytotheextent that itexceeds thetaxpayer's regulartaxliability. For2010,the year
when
theAMT
isprojectedtogeneratethe largest revenue flow, theexclusionequals$45,000 forjoint filersand $33,750forsingle individuals. Fortaxpayerswith
incomesabove $150,000 onjoint returnsand$112,000 on single returns, theexclusionisphased
outat therateof 25 centsforeachdollarof
AGI
abovethe threshold. This implies thatthe28%
AMT
rate appliestojointfilerswithAGI
above $206,000,and forsinglefilerswithincome
aboveminimum
income
will equal 175,000. Forexample
forjointfilers,thisrequiresAGI
-
(45000-.25*(AGI - 150000))
=
175000.Severalfeatures ofthe
AMT
arescheduledtochangebetween2003
and2010
undercurrentlegislation. For example,after2005, thezero bracket
amount
isno
longeraddedto theexclusion. For
2003
and2004, theexclusionis $58,000forjointfilers and $40,250 forsinglefilers. It declinesin lateryears.
Foritemizers,the
AMT
calculationismore
complicated. Allitemized deductions exceptthose forstateand localtaxes, medical expenses inexcessof
2.5%
ofAGI,
and miscellaneousdeductions are available as deductions against alternative
minimum
income.The
taxpayermust
identify eligibledeductionsand subtract
them
from alternativeminimum
income. Itemizeddeductions underthe
AMT
are notsubjectto thephase-outthatispresentintheregularpersonalincome
tax. In rarecasesthismay
invalidatethe usualrule thattaxpayers should itemize ifitemized deductionsexceedthe standard deduction.Foravery few, thedecreased
AMT
from
itemizationwillcompensatefor a largertaxable income.
For
most
taxpayerswith longtermcapital gains, theAMT
iscalculatedon
non-gainincome
plus20%
oflong-term gains. Forlowincome
taxpayerswithgains, the10%
capitalgainsrateisapplied togainsthat
would
notpushtaxable income abovethe15%
bracketboundary. Alltax credits exceptthe foreigntax creditcan be creditedagainst
AMT
liability,ascanthetaxpayer's regulartax liability. Sincetaxyear 2000,tax creditsdo notaffectthe total liability
calculation.Priorto that year,the taxformsdistinguishedbetween
AMT
liability,recorded onform
6251, and creditswhose
value, iftaken,would
befullyoffsetby theAMT.
Thesewere
referredtoas "lostcredits"andthe credit formsincluded lines toavoid takingsuch credits.
While
theAMT
may
requiretaxpayers tocompute
theirtax liabilityundertwo
regimes,none
ofthe calculationsrequireanyspecial recordkeepingbeyond
whatis requiredby the regulartrue that
some
taxpayers withnetoperating losses,or accelerated depreciation orinothersimilaresoteric situations are subjecttoadditionalrecord keeping,and
may
besubjecttoadditionalAMT
by
2010, but there are few suchtaxpayers. Formost
taxpayerswho
will faceAMT
liability,theAMT
calculation isnotparticularly burdensome.Figure 1 provides informationon the pattern of
AMT
andordinaryincome
tax liabilityforataxpayerfilinga joint return with
two
dependentsandclaimingthestandard deduction.Tax
liabilitiesunderbothtaxschedulesare
shown
atdifferent levels of adjusted gross income.The
figuregraphs
AMT
andordinaryincome
tax liabilityforboth2003 and2010, withthe taxpayer'sreal
AGI
held constantin2003 dollars.The
graphsshow
thatAMT
liabilityexceedsincome
taxliability fora substantialrangeof incomes, beginningatroughly $50,000, and endingatroughly
$375,000,in2010.
The
figure alsoshows
thatthe rangeofincomesoverwhich
AMT
exceedstheincome
tax iswiderin2010
than in2003.The
fourlinesdemonstratehow
similar the shapes ofthe fourtaxschedules are, sothatasmall shiftleftward in thereal
AMT
schedule,such asthe onethattakesplace
between
2003 and2010,shiftsmuch
oftheincome
distribution ontotheAMT
schedule.
2. ProjectingFuture
AMT
Liabilities:The
TAXSIM
Model
The
NBER
TAXSIM
model
isa computerprogram
thatcalculates federal incometaxandpayroll tax liabilitiesfora representative sample of U.S. families. Itanalyzes datafromthe
Statistics of
Income
(SOI)PublicUse
File, a stratifiedrandom
sampleof U.S. taxpayersthatoversampleshigh-incometax returns. Feenbergand Coutts (1993) describethe personal
income
tax sectionsofthe
TAXSIM
model
insome
detail.The
TAXSIM
algorithm includesdetailed computer code basedonthe personalincome
tax systemthat, basedoncurrentlegislation, willbe inforceinfuture years.
To
constructindividual
income
tax return file,the 1999SOI
datafile,to2010. This "aging" processrequiresforecasts ofthe growthrateofthe aggregate
amount
ofvariousincome components
anddeductionflows.
We
assume
annualgrowthratesof1.2percent forpopulation,2.2 percent for realincomesanddeductions, and2.5 percent forthe price level forall
income
anddeductionitems. Thesegrowthratesare
drawn
fromCBO
projections.Long
term gainsare normalizedto5.6 percentofAGI, which was
theiraverage valueovertheyears 1981-1999.When
thegrowthrates describedabove are appliedtothe 1999cross-section dataon
taxreturns,the resulting
income
taxrevenue forecasts for2004-2013 aresubstantiallyhigher thanthose
made
by
the CongressionalBudget
Office.A
one-timeten percent reductioninallnominalmagnitudes,appliedfor examplein 1999, brings our aggregaterevenueestimates into
much
closeragreementwiththe
CBO.
We
thereforereduce allnominal 1999 magnitudesby
tenpercentbefore
we
make
ourfutureprojections.TAXSIM
calculates federal aswell asstate marginalincome
tax rates.AMT
payerscannot deductstate
income
taxesfrom
theirtaxableincome, sotheireffective stateincome
taxrate is higher thanthe comparable ratefacing those
who
payordinary federalincome
taxandclaim an itemized deduction for statetaxes.
To
recognizetheimpactofthe effectivestatetax rateon
the total taxburdenon
wages, interest, dividends, andotherincome
components,we
thereforecalculate federalmarginaltax rates underthe
AMT
aswellasthecombined
tax ratethatequalsthe federalmarginaltaxrateplusthe net-of-federal-deductibilitystate
income
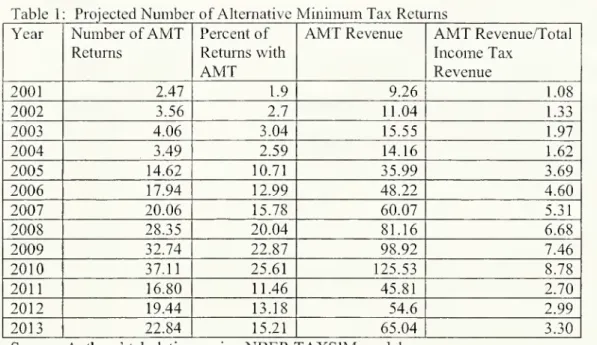
taxrate.Table 1 presentsinformation
on
our projections regardingtheAMT
undercurrent law.The
tableshows
the totalnumber
oftaxpayerswho we
project will face theAMT,
thetotalamount
ofAMT
revenue,andtheratioof revenuefrom
theAMT
torevenuefrom
the ordinaryincome
tax.The
tableshows
thatprojectedAMT
revenue peaks in2010,when
itaccounts fornearlynine percentoftotal
income
taxrevenue.We
project that 37milliontaxpayers-
nearly one7
have no itemized deductions, no capital gains,no phase-out ofthe
AMT
exclusion, and nootherpreferences. Thisgroup of taxpayerswill face relativelysimple
AMT
calculations.Table 1
shows
thatthenumber
ofAMT
filers andthe revenue collectedfromtheAMT
declineafter2010,
when
various provisionsofEGTRRA
expire. Ifthis legislativechange occursin2011, the
number
ofAMT
filers will fallbymore
thanonethird,andAMT
revenues willdecline
by
more
than half.The
projections inTable 1 aresimilartothoseinseveral other studiesoftheAMT.
Forexample,
Burman,
Gale, and Rohaly (2003b) projectthat there willbe33.1 millionAMT
filers in2010.
They
note that inthe absenceofEGTRRA,
theywould
have projected 14.3 millionAMT
filers. Theirprojectionsuggests
AMT
revenue of$124
billionin2010, only $1 billion lessthanourprojection. Kiefer,etal. (2002) projectthatthere willbe35.1 million
.AMT
filersin2010
andthat the
AMT
willyield $133billioninrevenuethatyear. Their projections includethe effectofEGTRRA,
but theydonotincorporate any ofthe2003 tax changes.The
prospective growth ofAMT
liabilitiesandthenumber
ofAMT
taxpayers hasgenerated a
number
of proposals for legislativereformsthatwould
slowthe growthoftheAMT.
We
usetheTAXSIM
model
toevaluatethe impactofsixpotentialreformson
thenumber
ofAMT
taxpayersandtherevenue generatedby theAMT.
Table2 presents these findings.The
first
row
reportsbaselinecalculations for2010, correspondingtothe informationinTable 1.The
nextsix
rows
considerreform proposals.The
firstproposalwe
considerwould
allow personal exemptionstobe subtractedfromotherincome indefiningalternative
minimum
income.Such
exemptions arepermittedundertheordinaryincometax,thereby reducing ordinary taxable
income
relativetoalternativeminimum
taxable income.
The
secondrow
of Table2shows
thatthisreformwould
sharplyreduce thenumber
ofAMT
taxpayersin2010, from37 millionto 12 million, and itwould
also reduce8
A
secondpotential reformcalls fortheextensionofincome
taxprovisionsthat expirebetween
2005
and2010
sothattheywould
remainin forcein2010.The
twomost
significantprovisionsareone that
would
raisetheAMT
exclusionin2010
to $13,000forjointfilers and$6,500forsingle filers,and one that
would
continuethe preferentialtaxation of dividends.The
formergreatlyreducesthe
AMT,
andthe latterreduces boththeregularincome
tax andtheAMT
by
similar amounts.The
thirdrow
of Table 2shows
that extendingall expiring provisionswould
reduce the
number
ofAMT
filersfrom
37millionto 14.1 millionin2010,witha decline in totalAMT
revenue from$126
to $58 billion.The
thirdAMT
reformthatwe
consider involveschanges in the relativetreatmentof
single andmarried taxpayers.
The 2010
jointtaxpayer exclusionof $45,000 undertheAMT
issubstantiallylessthantwicethe singletaxpayer exclusionof$33,750. In principle, the single
exclusioncould simplybedoubledto $67,500, butthat
would
substantiallyincrease themarriagebonusforcoupleswithnon-workingspouses.
We
havethereforemodeled
a lessgenerous optionwhich
offers the couplethe greaterofthecurrent joint deduction, orthe singlededuction plus thesecondary earner's
wages up
tothe single exclusion. Thismeans
thatthefull $67,500isofferedonlyto
two
earner couples, with bothearnersmaking
more
than $33,750.Our
analysisofthisreform
shows
thatitleads to amore modest
reduction inAMT
taxpayers thanthetwo
earlierreformproposals.
The
number
ofAMT
filers in2010
dropsfrom
37 millionto25millioninthiscaseand
AMT
revenuedeclinesby
roughly onethird, from$126
to $87billion.The
lastthreeproposalswe
consider involvechangestotheAMT
exclusionlevel.One
involves indexingtheexclusion, whilethe secondandthird involveraisingtheexclusion
by
$3,000 and$10,000respectively.
The
nominal,un-indexed characteroftheAMT
exclusionisakey contributortotheprojected growthof
AMT
revenuesandtaxpayers.We
project 14.0millionindexation.
AMT
revenuesin thiscase are$48 billion. Indexing theexclusionthereforereducesAMT
revenueinour projectedpeak revenueyearby oversixtypercent.The
findings onthe impact ofindexing theAMT
underscore the importance oftheinflationrate indetermining the relativerevenueyield oftheregular
income
taxandtheAMT.
Figure 1
showed
thatsmallchanges inthe real threshold atwhich
taxpayers areaffectedby theAMT
canhave substantial effectson revenues and onthenumber
ofAMT
filers.By
comparison,real growthinthe aggregate
economy
has amuch
more modest
effect onAMT
revenue, becauserealbracketcreepraises the regular
income
tax as well astheAMT
base.The
lasttwo
reformsthatwe
consider involve specificnominal changes intheAMT
exclusion. Raisingthe exclusionby
$3000
in2010
reducestheprojectednumber
ofAMT
taxpayers
by
6.4 million, from 37 millionto31 million. Raisingthe exclusionby $10,000 reducesthe
number
offilers to 17million.Revenues
drop from$126
billion in the statusquo,to$100
billion ifthe exclusion israised
by
$3000, to$65billion ifthe exclusionrisesby $10,000.The
burden oftheAMT
doesnot fall equally acrosstheincome
distribution. Table3shows
theAMT
tax burdenas a shareofAGI
forhouseholds stratifiedby
AGI.
The
entriesshow
total
AMT
liabilitydividedby totalAGI
forthehouseholds ineachcategory; theyare notrestricted tohouseholdswith
AMT
liability.The
calculationsapplyto2010, andtheyassume no
changes between
now
andthen in the federal tax law.The
AMT
burden ishighestforthosewithAGI
between
$200,000 and$500,000. This groupfacesAMT
liabilitythataverages2.7%
ofAGI.
The
burdenis halfasgreat,1.3%
ofAGI,
fortaxpayers withAGI
of $50,000 to$75,000. It islower for
AMT
taxpayerswith higher-
greaterthan $500,000,and lower-
less than $50,000-AGI.
Figure2 plots information similarto that inTable3.
The
figureshows
average taxrates,10
rate fortaxpayerswith
AGI
between
$200,000 and $500,000, andvery littleimpacton
averagetaxrates forhouseholds
whose 2003
AGI
isbelow
approximately$50,000.3.
The
Probability of FacingtheAMT:
CurrentTax
Policyand VariousReforms
The
results inTable3 andFigure2 underscorethe importanceof disaggregating taxpayersby
income classwhen
analyzingtheAMT.
One
usefulway
to illustratehow
theAMT's
impactvaries acrosshouseholds withdifferent characteristics and
income
levelsis toproject theprobability that ataxpayer willbe an
AMT
filer.Burman,
Gale, andRohaly(2003a, 2003b) andotherearlierstudies estimatetheAMT-filing probabilities fortaxpayers invarious
income
categories.
Our
analysis exploreshow
various reformproposalswould
affect theincome-specificlikelihoodoffacingthe
AMT.
Table4presents resultsbasedon ourprojections ofthe
AMT
in2010.The
table reportsprobabilitiesundertheassumption thatcurrent tax legislationremains in forcethrough
2010
andunderthe variousreformsdescribed inTable 2.
The
results inthe firstcolumn
indicate theprojected
AMT
payment
probabilitiesunderthe status quo.The
tablepresents results forthreesetsoftaxpayers: the
whole
taxpayer population,the thirtypercentof taxpayerswho
areprojectedtoitemize in2010, andthesubsetofalltaxpayers with
two
ormore
dependents.The
probabilitiesoffacingthe
AMT
differacrossthesegroups.The
resultsinthe firstpanelofTable4show
that thetaxpayerswho
havethe greatestchance ofenteringthe
AMT
regimein2010
arethosewithAGI
between
$75,000 and$500,000.These
income
thresholdsare specifiedinconstant $2003. At lower incomelevels, theAMT
exclusion
makes
itunlikelythatataxpayerwill faceAMT
liability.At
AGI
levelsabove$500,000, theprogressivityofthe personal
income
tax schedulemakes
itlikely that formost
taxpayers,personal
income
taxliabilitywillexceedAMT
liability.The
resultsunderscorethe11
facingthe
AMT
is56.3%
fora $50-75,000AGI
taxpayer,77.2%
for ataxpayer withAGI
between$75,000 and$100,000, and
more
than90%
fortaxpayers withAGI
between $100,000 and$500,000.
The
results inthesecondpanelof Table4, foritemizers, arebroadlysimilartothoseforthe universeofall taxpayers.
The
distribution ofitemizers acrossAGI
categoriesis shifted towardhigherincomes, however,sothat while only
25.7%
ofall taxpayersareprojectedto face theAMT,
52.5%
ofall itemizers areprojectedto face theAMT.
The
lastpanelof Table4,which
presentsresults fortaxpayers with
two
ormore
dependents,shows
thatthepresence ofdependentschanges theAGI-specificprobability offacingthe
AMT.
In the $25-50,000AGI
category, forexample,
15.8%
ofall taxpayersareprojected topaytheAMT,
whilemore
than halfofthetaxpayersin this
AGI
category withtwo
ormore
dependents areprojected toface theAMT.
There isalsoasharp increase intheprobability offacingthe
AMT
atincomes between $50,000and $75,000.
The
overallprobability offacing theAMT
isgreaterthan50%
forthe subsetoftaxpayerswith
two
ormore
dependents.The
next sixcolumns
of Table 4presentresults similartothose inthe firstcolumn, butcorrespondingtothe various
AMT
reform optionsdescribed above.The
secondcolumn
considerstheimpact of allowing personal exemptionstobe subtractedfrom alternative
minimum
taxableincome. In thiscase,the overallprobability offacingthe
AMT
drops from25.7%
to8.4%.The
effectis strongestfortaxpayers with
AGI
below
$100,000. Forthe$75-100,000income
category,forexample,the probabilityoffacingthe
AMT
drops from77.2%
to 15.8%.The
effectofthisreformisalso verypowerfulfortaxpayers
who
havepositiveincome and twoormore
dependents.Thisreformreduced theirprobabilityoffacingthe
AMT
in2010
from56.1%
to 15.6%.The
thirdcolumn
of Table 4considers theimpactofextendingtheexpiringEGTRRA
provisionsthrough 2010. Foralltaxpayers, this reformreducestheprobability of payingthe
12
income
AMT
payers. Fortaxpayers withtwo
ormore
dependents,the impact ofthisreform issmallerthanallowing personal exemptionstobe deducted from alternativetaxable income.
The
probabilityoffacing the
AMT
drops from56.1%
underthe statusquo
to27.8%
withthe extensionofexpiringprovisions.
The
nextcolumn
considers the"AMT
marriagepenalty reform"describedin thelastsection. Thisreform reducesthe percentageoftaxpayers facing the
AMT
from25.7%
to 17.4%.The
threepanels ofTable4show
thatthe impact ofthisreformon theprobabilityof payingAMT
islessconcentrated atlower
income
levelsthanathigherlevels. Inparticular,the probability thattaxpayersinthe $50-100,000
AGI
range face theAMT
declines lessforthisreformthan for eitheroftheprevious reforms that
we
considered.The
lastthreecolumns
considerchanges intheAMT
exclusionlevel.Comparison
ofthefindingsinthese
columns
shows
thatindexing generatesthe largestreductionintheprobabilityoffacingthe
AMT
fortaxpayers withAGI
between
$50,000 and $200,000.Even
withindexation,the probabilityof payingthe
AMT
remains83.7%
fortaxpayerswithAGI
ofbetween $200,000and$500,000.
The
probabilityis92%
forthisgroupwhen
the exclusionisraisedby $3000
orby
$10000.
The
thirdpanelofTable4
shows
thatvirtuallyallofthetaxpayersinthisAGI
categorywith
two
ormore
dependentsfacetheAMT.
Indexing theAMT
exclusion hasa smallereffecton
thepercentage oftaxpayerswith
two
ormore
dependentswho
paytheAMT
thanitdoeson thefraction ofalltaxpayers facing this tax.
Figure 3
shows
the impact ofraising theAMT
exclusiononnumber
ofAMT
taxpayersand on therevenueyieldofthe
AMT.
The
marginaleffectof an incremental increaseintheexclusion declinesas theexclusionrises.
A
$10,000increase intheexclusion in2010, forexample,is predictedtoreduce
AMT
revenueby
nearly fiftypercent, and ithas a similar13
the
number
ofAMT
filersby
28million, from34.8 million to6.7 million, and itreducesthe totalrevenue generated
by
theAMT
from $121.2billionto$41.5 billion.4.
The
AMT
and MarginalTax
RatesMost
ofthepopular discussionsurroundingtheAMT
focusesonthenumber
of taxpayerswho may
face thetax, oron theimpactoftheAMT
on federal taxrevenues.The
effectoftheAMT
on incentives forworking, saving,and engaginginvariousactivitiesthatgenerate taxdeductions has received
much
lessattention.To
explorethe incentive effects oftheAMT,
we
compare
the ordinaryincome
tax rateandtheAMT
rate facingtaxpayerswho
areprojected tobesubject to the
AMT
in 2010. Sinceataxpayermay
face differentmarginal taxrates ondifferentincome
flows,we
presenttabulations forvariouscomponents
oftaxableincome. Foreachincome
component,
we
compute
the fractionofthatcomponent
that isreceivedby
AMT
taxpayers.We
then
compute
the percentagewhose
tax raterises, andthepercentagewhose
taxratedeclines, asaresult ofthe
AMT.
We
constructmarginal tax ratesby
calculating theincremental tax that ataxpayerwould
pay ifoneofhis income elementsordeductions
was
onepercentgreaterthanthereportedvalue.The
tax rateon a specificincome component
foragivenhouseholdisdefinedasthechangeintaxliability dividedby .01 timesthe initial taxreturn entry, i.e.,the changein taxdividedby the
changein
income
or the change inthe deductionamount.We
calculatethesemarginal tax ratesunderthe assumptionthatall currently legislated tax rulesremaininforceunless theyarechanged
by
legislation thathas alreadybeenenacted.We
thereforeassume
thatphase-outsofsome
ofthetax provisions thatwereenacted in2001 and
2003
will take effect asplanned.4.1 Marginal
Tax
Rate Increasesand Decreases with theAMT
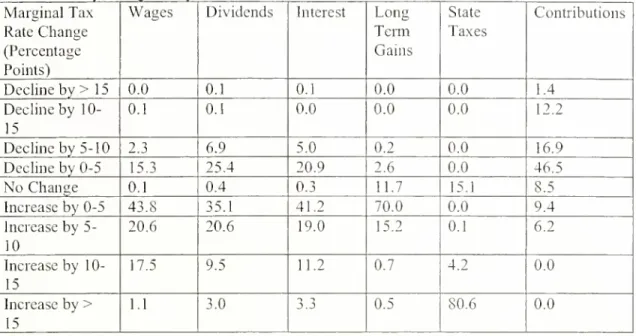
Table 5presents ourfindings with regardtothe disparity betweenataxpayer'sordinary
14
marginal
income
taxrate. Table 6reports parallel calculations thatconsiderthe impactoftheAMT
onthe taxpayer'scombined
federaland statetaxrate, netoffederal tax deductibility.The
first
column
inTable5 considerswages
and salaries. Nineteenpercentofthewages
receivedbyAMT
taxpayersfaces alower marginaltax rateas a resultoftheAMT,
whilethe remaining 81percentfaces ahighertax rate.
The most
common
outcome
isa taxrateincreaseofbetween
zeroand fivepercentage points, for
example
reflectingamove
fromthe 33 percent bracketontheordinary
income
tax scheduleto 28percenton
theAMT
schedule.Almost
onetenthofthewage
and salary
income
receivedby
AMT
payersistaxedata rate 5 to 10 percentagepoints loweras aresultofthe
AMT,
with aroughly equalamount
ofwage
income
taxed atarate 5 to 1 percentagepointshigher.
The
nexttwo
income
categories thatwe
consideraredividends andinterestincome. Forbothofthese income categories, thereisa greaterchance ofa declineinthemarginaltax ratethan
there
was
forwage
andsalary income.More
than32%
ofdividends,and26%
ofinterestincome,facesalowermarginaltax rate asaresultofthe
AMT.
A
largeshare ofboth dividendsandinterest
-
35.1 and41.2percent, respectively-
faces marginaltax rates that arehigher, butno
more
than fivepercentage pointshigher, as a resultoftheAMT.
The
remainingcolumns
of Table5 present similarcalculations for longtermgains, stateincome
tax deductions, andcharitable contributions.Each
ofthesethreeincome
components
ordeductions istreatedina different
way
undertheAMT.
Forlong-termgains, 12percentofthelong-term gains reported
by
AMT
taxpayers face thesame
tax ratewiththeAMT
aswithout it.Becausestate andlocaltaxes are not deductible incomputing alternative
minimum
income, butthey aredeductible for ordinary
income
tax calculations, virtuallyall taxpayers facemuch
highermarginaltax ratesonthese deductionsunderthe
AMT
than undertheordinaryincome
tax. Forsuch taxpayers,the changeinthemarginaltax rateis large
-
thefullvalueoftheAMT
rate.15
charitablecontributionscan be deducted. In partbecausecontributions tendtobe
made
bytaxpayersinupper
income
brackets, forwhom
theAMT
tends toreducemarginal taxrates, nearlythree quarters of these contributionsaredeductible ata lowermarginal tax rate as aresultofthe
AMT.
Table6
shows
the impact oftheAMT
onthecombined
federal andstatemarginal taxratesthat taxpayersface
on income
anddeductions.The
effective marginalstateincome
tax raterises from(l-tfCdcrai)*tSiatetotstatefor an itemizerundertheordinary
income
taxwho
switches tobecome
anAMT
payer.Comparing
theresults inTables 5 and6shows
how
substantial thiseffectcanbe. For example, thepercentage of
wage
incomethatexperiencesa to5 percentage pointtax increase as aresult ofthe
AMT
dropsfrom 55 to44%,
whilethepercentage witha5-10percentage point increase rises from 10 to
21%.
The
effectofrecognizing stateincome
tax rateson the distributionof marginaltax ratechangesforinterest
income
and fordividend income is similarto thatforwage
income. Forlong-termgains, the shareofgainsreceived
by
AMT
payers with no changein theirmarginal tax ratesdeclines from
42%
inthe upperpanelof Table 5 to 11.7%
inTable 6, andthe sharereceivedby
those with marginaltax rate increases betweenzeroand fivepercentrises from
16%
to72%.
Forstatetax deductions, thereisvery littlechange as aresultofthe inclusionofstatetaxes.
4.2
Weighted Average
MarginalTax
RatesTables 5 and6 offer
some
insightsonhow
theAMT
affects taxpayerincentives.The
tables do not consider
how
many
taxpayersface theAMT,
however, andthey donotyield singlesummary
measuresofthe impactoftheAMT.
To
address these needs,we
compute
weightedaverage marginal tax rates ona rangeofdifferent
income
components
receivedby alltaxpayers.We
includebothAMT
payers andothertaxpayers, andthereby obtainameasure oftheAMT's
16
category
by
averaging marginaltax ratesacross taxpayerswith weights equalto theshareofaggregate
income
or deductions inthatcategory receivedby
eachhousehold.Table7
shows
theweightedaverage marginalincome
tax rateson
fourincome
components
andon
four deductioncategories.The
tableshows
weighted average marginal taxrates everythreeyears
between
2001 and2013
both with and withouttheAMT.
Forthe"withoutAMT"
casewe
assume
thattheAMT
isrepealed butthatthere are no otherchangesinthepersonal
income
taxschedule. In practice,AMT
repealwould
presumablycoincide with changesinthe
income
tax lawthatwould
restoreatleastpartoftherevenue thatiscurrentlycollectedby
the
AMT.
Because
there aremany
possibleways
inwhich
theincome
taxcouldbe modifiedtorecoup lost
AMT
revenue, however,we
decided nottomake
anarbitrary choiceandreport theassociatedresults.
Comparing
thecolumns
for2001 and2004
inTable 7shows
thattheAMT
hasa relativelyminor
effecton
weighted averagemarginalincome
tax rates intheseyears. For2004, forexample,the estimatedweightedaveragemarginal tax rate
on
wages
is22.6%
with theAMT,
and22.3%
withoutit.The
onlyincome
ordeduction categoryforwhich
the weighted averagemarginaltax ratediverges
by
more
thanonepercentage pointis stateincome
taxes,where
thedisparityin
2004
isnearlysixpercentagepoints.The
weighted averagemarginaltax rateswithandwithouttheAMT
divergeby
more
in2010
thaninthe earlieryears ofthedecade. Forwages,the weightedaveragemarginal tax rateisprojectedtobe 1.5percentage points higherin
2010
as a resultoftheAMT.
Because themaximum
AMT
rate of28 percentismuch
lowerthanthemaximum
regular bracketrates,itmay
be surprising that the
AMT
raisesaveragemarginal taxrates.However,
the lowestAMT
bracketrateof26percent ishigher thanthe incometax bracketof15 percentthatanon-itemizing family
offourwill leave only at$78,500 ($2003), andit is slightlyhigher thanthe25percent ordinary
17
showed
a substantial fractionofwage income
receivedby
AMT
taxpayers facing ahighertaxratewith, ratherthan without,the
AMT.
The
marginal taxratepatterns forinterestincome
and fordividendsare similartothoseforwages. In2004, the
AMT
hasanegligible effect onthe weightedaverage marginal taxrateforinterestincome, and itraisesthe dividendtax rate
by
0.3 percentagepoints.By
2010,however,the effects are larger. Thereis a0.9percentage point increase inthe marginal taxrateon interest
income, anda 0.7 percentage point increaseinthe tax rateon dividends.
The
distributionofdividend
income
ismore skewed
toward high-income householdsthanthe distributionofinterestincome, soa higherfractionofdividend recipients have marginal incometax rates that areabove
theirmarginal taxrateunderthe
AMT.
The
fourthrow
in Table 7shows
the impactoftheAMT
on themarginaltaxburden oncapital gains.
The
weightedaveragemarginal tax ratewith theAMT
is higher thanthatwithoutthe
AMT,
with thedifferencereaching itsmaximum
at0.7percentagepoints in2010.The
differenceis0.2 percentagepoints in2004.
The
tablealsoshows
thattheweightedaveragemarginal tax rateundercurrentlawis lowerin
2004
than in2001,reflecting thereduction inmarginal tax rates that
was
enacted in 2003. Forrealized long-termcapital gains,JGTRRA
reduced theweightedaverage marginal tax rate by aboutfourpercentage points.
The same
tax actloweredthemarginaltax rateon dividend income,andthe third
row
ofTable7shows
the impactofthischange:a tenpercentage pointdrop inthe weightedaverage marginal taxrate.
The
last fourrowspresentinformation onhow
theAMT
affects theweightedaveragemarginaltax rates that applytovarious personal incometaxdeductions. Forstateand local
income
taxdeductions,shown
inrow
five,the effectis dramatic. Thesetax paymentsarenotdeductible from alternative
minimum
taxableincome,but theyaredeductible from taxableincome
undertheordinaryincome
tax. In2004, theweightedaveragemarginal tax subsidy onhavebeen 24.1 percent.
The
disparityisthe resultof roughly onethirdofstateand localtaxdeductionsbeing claimedby taxpayers
who
are intheAMT
regime, and forwhom
these taxes donot generate adeduction.
The
disparitybetween
theaveragemarginal taxratewith andwithoutthe
AMT
isprojectedtogrow
overthenext decade. In2010,theweighted averagemarginal taxrate
on
stateand localtax deductionsisprojectedtobe9.4 percentwiththe currentAMT
in effect,compared
with26.9 percent iftheAMT
did notexist.The
projectionsalsoshow
that expirationofthe
EGTRRA
provisionsin2011 bringsthetwo
sets ofweighted average marginaltax ratesinto closerproximity,withthe weighted marginaltaxrateunderthe statusquo, withthe
AMT,
rising
from
9.4%
in2010
to18.2%
in2013.The
AMT
hasa smallerimpactonthe weightedaverage marginaltax rates fortheotherdeductionsthat
we
consider. In2004, forexample, ithasno effecton
the weighted averagemarginal tax rateon medical deductions,and itaffectsthemortgage interestdeduction
by
0.4percentage points andcharitablecontributions
by
0.7 percentagepoints. In2010, allofthesedisparities are larger.
The
weighted average marginaltaxrate formedicaldeductions is0.5percentagepoints lowerwiththe
AMT
thanwithoutit,whileboththe mortgage interestandcharitablecontributions deductionsare atweightedaveragesthat arenearly
two
percentage pointsgreaterunderthe
AMT
thanwithoutit.Table 8 presentsweighted average marginaltaxratecalculations similar tothoseinTable
7, butitincludestheeffectofthe
AMT
on net-of-deductibilitystateincome
tax rates aswellasthe effect
on
federalrates.The
levelofthemarginaltax rates in thistable ishigher than the levelinTable7, andthe differences that resultfromthe
AMT
are also larger. For wages, forexample,theprojected impactofthe
AMT
in2010
is an increaseintheweightedaverage marginaltaxrateof2.2percentagepoints,
compared
with 1.5percentagepointswhen
onlyfederaltax rates are19
interest,the weightedaveragemarginal taxrate ondeductions risesto2.6 percentage points in
Table 8,
compared
with2.2 percentagepointsinTable 7.The
weightedaverage federal marginalincome
tax ratesinTable 7 are projections.To
provide a base forcomparison with boththe level andthevariation in similarmarginal tax rates in
thepast, Table 9 presents data foryearssince 1960on theweighted average marginaltax rates on
wages, several different
components
ofcapitalincome, and several deductions.The
dataintheappendixrepresentanupdated version ofthetimeseries formarginal tax ratesin Poterba(2002).
The
tableshows
thatthe changesassociatedwith theAMT,
evenin2010, are inmany
casessmallerthanthechangesassociated with significant taxreforms inthepast.
The Tax Reform
Actof1986, forexample,reducedthe weightedaverage marginal
income
tax rate onwage
income
by4.3 percentagepointsover the 1986 to 1988period.
The
marginalincome
tax ratereductionsassociated with
ERTA,
the 1981 tax legislation,were
comparable inmagnitude.5.
Reform
OptionsandTheirImpactonWeighted
Average
MarginalTax
RatesThe
foregoinganalysis consideredhow
various reformproposalswould
affect thenumber
of taxpayers facing the
AMT
and the distributionofAMT
payers acrossAGI
categories.We
havenotconsidered
how
reformswould
affectweightedaveragemarginal taxrates. Table 10 presentssuch informationfor
two
income components,wages
and interest income, and for stateincome
taxdeductions. Thisdeductionisthe onewith the largestchange in the weightedaveragemarginal
taxrateasa resultofthe
AMT.
The
results inTable 10show
thatall oftheproposed reforms havethe effect of reducingthe marginal taxrateson
wages
and on interest income,although the magnitudeofthese effectsvary acrossproposals.
The
proposalstosubtractpersonalexemptions from alternativeminimum
taxable
income
andto indextheAMT
exclusion forinflationarethetwo
thathave the largest20
overapercentage pointas aresultofthesereforms. Forinterest income, thesetwoproposals
along with extendingthe expiringprovisions in
EGTRRA
andJGTRA
havethe greatestmarginaltaxrateimpact. Indexingand allowing personalexemptionsunderthe
AMT
have significanteffects on theweightedaverage marginal
income
taxratethatapplies tostate incometaxdeductions. Indexing, forexample,
would
raisethismarginal tax rateby
nearlyfive percentagepoints in2010. This isthe largestabsolute effectofany ofthe proposed reforms on any ofthe
marginal tax ratesinTable 10.
Given
thattheAMT
hasmodest
effectsonmost
marginal taxrates, itisnotsurprising that the effectof
most
ofthereformproposals isalsomodest.6. ConclusionsandFuture Directions
Thispaperpresents
new
evidence onthegrowth ofAMT
liabilitiesoverthenextdecade,andthe incentive effects associatedwiththisgrowth.
Our
baseline projectionsconfirmthewidelydocumented
patternthatbecausetheAMT
exclusionlevelis not indexed,there will berapidgrowth inthe
number
ofAMT
taxpayers, andintheamount
of revenue collectedby
theAMT,
until 2010. After 2010,
when
anumber
ofprovisions inthe2001 taxreformarescheduledtophase out,the
number
ofAMT
taxpayerswilldecline, butitwillrise againinsubsequent yearsfromthe lower post-2010base.
Althoughthe
AMT
creates substantial changesinmany
aspectsoftheincome
tax system,we
find that theaverage marginaltax ratesonmany
income
components, suchaswages
andinterestincome, areaffectedonlymodestly by growth ofthe
AMT.
In2010, forexample,we
project that the
AMT
will raise theweightedaveragemarginaltax rateonwage
incomeby
1.3percentagepoints relativeto
what
itwould
be iftheAMT
were
repealed andno
othertaxchangeswere enacted. For interest income,the effect ontheweighted average marginal taxrateisjust
below
onepercentagepoint. These changesconceal largerchanges inmarginaltaxrates for21
ordinaryincometax into the
AMT
brackets of26 and 28percent. Othersdrop from marginaltaxratesabove 30percentunderthe
income
taxtotheAMT
rateof 28 percent.Our
resultsarebased on stylizedassumptions aboutthe rateatwhich
aggregate income,population, andtheprice level will
grow
overthe nextdecade. Allof our analysisusesthesame
underlyingassumptionsto "age"
income
taxrecords from 1999 through2013. Itwould
be usefultogauge the sensitivity ofour findingstotheseassumptions, andtoexplore
how
differencesingrowthrates or
more
importantlyinthe rate ofinflationbetween
2003 and2010
would
affect themagnitude of
AMT
liabilities.One
oftheunder-studied issuesassociatedwith theAMT
concernsthe impactofthistaxonthe tax liabilityofsinglehouseholds andmarried couples.
The
effectofa changein householdstatus ontax liabilitiesisdifferent
when
thetaxpayers facetheAMT
thanwhen
they facetheregular
income
tax schedule. Gravelle (2001) has notedthis potentiallyimportanteffect.The
growingsignificanceofthe
AMT
may
thereforecallinto questionthe traditionalanalysisofthe"marriagepenalty"andrelated featuresofthe
income
tax system. Future research shouldconsiderthisaspectofthe distributionof
AMT
liabilities, along with potentialreformsto address22
REFERENCES
Burman,
Leonard, WilliamGale, andJeffrey Rohaly."The
AMT:Problems
andPotentialSolutions,"National
Tax
Journal 55 (September2002), 555-596.Burman,
Leonard, WilliamGale, andJeffreyRohaly."The Expanding Reach
oftheAlternativeMinimum
Tax." Journal ofEconomic
Perspectives 17(Spring 2003a), 173-186.Burman,
Leonard, WilliamGale, andJeffreyRohaly."The
AMT:
Projections and Problems,"Tax
Notes (July 7, 2003b), 105-117.Feenberg, DanielR.,and ElisabethCoutts.
"An
IntroductiontotheTAXSIM
Model." JournalofPolicyAnalysisand
Management
12 (Winter 1993), 189-194.Gravelle, Jane.
"The
IndividualAlternativeMinimum
Tax: Interactionwith MarriagePenaltyReliefand Other
Tax
Cuts." Congressional Research Service,June 12,2001.Harvey, RobertP.andJerry Tempalski.
"The
IndividualAMT:
Why
it Matters,"NationalTax
Journal 50 (1997),453-473.
Kiefer,Donald, RobertCarroll,JanetHoltzblatt, AllenLennan, Janet
McCubbin, David
Richardson, andJerryTempalski.
"The
Economic Growth
andTax
Relief ReconciliationAct of2001:
Overview
andAssessment ofEffectson
Taxpayers." NationalTax
Journal55
(March
2002), 89-118.Poterba, James. "Taxation, Risk-taking, andPortfolio Behavior."In
Alan
Auerbach
and MartinFeldstein, eds.:
Handbook
of PublicEconomics:Volume
3 (NorthHolland,Amsterdam,
2002).
Rebelein, Robert,and JerryTempalski.
"Who
Pays the IndividualAMT?"
Washington: U.S.Treasury Department,Office of
Tax
AnalysisPaper 87, 2000.23
Tempalski,Jerry.
"The
Impact ofthe2001Tax
Billon the IndividualAMT."
Proceedings ofthe94thAnnual National
Tax
Association Conference onTaxation. NationalTax
Association: 2002. 340-348.
U.S. Congress, Joint
Economic
Committee.The
AlternativeMinimum
Tax
forIndividuals:A
24
Table 1: Projected
Number
ofAlternativeMinimum
Tax
ReturnsYear
Number
ofAMT
Returns
Percentof
Returns with
AMT
AMT
Revenue
AMT
Revenue/TotalIncome Tax
Revenue
2001 2.47 1.9 9.26 1.082002
3.56 2.7 11.04 1.332003
4.06 3.04 15.55 1.972004
3.49 2.59 14.16 1.622005
14.62 10.71 35.99 3.692006
17.94 12.99 48.22 4.602007
20.06 15.78 60.07 5.312008
28.35 20.04 81.16 6.682009
32.74 22.87 98.92 7.462010
37.11 25.61 125.53 8.78 2011 16.80 11.46 45.81 2.702012
19.44 13.18 54.6 2.992013
22.84 15.21 65.04 3.3025
Table 2:
Number
ofAMT
TaxpayersLaw
andReform
Proposalsand
Ags
;regateAMT
Liabilities,,2001- 2013, CurrentTax
Filers
Tax
Liability2001
2004
2007
2010
2013 20012004
2007
2010
2013 StatusQuo
2.1 3.3 21.8 37.2 23.8 7.4 11.7 57.5 125.7 68.1Allow
Personal Exemptions 1.1 1.8 5.7 12.2 5.1 6.2 9.4 24.7 49.7 27.8 Extend Expiring Provisions 2.1 3.3 7.1 14.1 22.9 7.4 11.7 24.8 57.6 101.9Marriage
Tax
Relief1.7 2.7 14.2 25.3 15.0 6.8 10.5 40.0 87.4 46.6 Index
AMT
Exclusion 2.1 2.1 9.8 14.0 3.1 7.4 9.3 26.7 47.8 17.9Add
$3,000 toAMT
Exclusion 1.5 2.6 16.1 30.9 18.2 6.7 10.4 44.7 101.9 53.8Add
$10,000toAMT
Exclusion 1.0 1.7 7.7 17.0 8.6 5.8 8.6 27.0 65.3 33.5Note: Filers aremeasured in millions,
projections usingthe
NBER TAXSIM
liability in billionsofdollars. Entries are basedon
model, asdescribed inthe text.
Table 3:
AMT
Liabilityas aPercentageofAdjusted Gross Income,By AGI
Category,2001-2013
AGI
Class 20012004
2007
2010
2013<25K
0.1 o I o I 0.1 0.125-50K
0.1 0.4 0.350-75K
0.5 1.3 0.675-100K
0.1 0.1 0.8 1.6 0.5100-200K
0.1 0.1 1.3 2.4 1.2200-500K
0.4 0.6 1.8 2.7 0.9>500K
0.3 0.4 0.5 0.6 4TOTAL
0.1 0.2 0.7 1.3 0.626
Table4: Projected Probabilities of
AMT
Payment by AGI, 2010
Status
Quo
Allow
PersonalExemptions
Extend Expiring Provisions MarriageTax
Relief IndexAMT
ExclusionAdd
$3,000toAMT
ExclusionAdd
$10,000 toAMT
Exclusion AllTaxpayers<25K
0.9%
0.6%
0.6%
0.9%
0.6%
0.7%
0.6%
25-50K
15.8 2.2 3.2 13.1 3.2 10.1 3.950-75K
56.3 7.2 12.4 33.8 14.7 43.6 16.675-100K
77.2 15.8 20.7 41.4 23.9 66.0 28.5100-200K
94.7 57.5 56.6 67.1 49.7 90.1 66.2200-500K
91.6 88.9 91.1 89.6 83.7 91.5 91.2>500K
33.3 30.0 35.5 33.2 31.8 33.3 33.3 AllIncomes
25.7 8.4 9.8 17.4 9.7 21.3 11.7 All Itemizers<25K
1.2%
0.8%
0.8%
1.2%
0.8%
0.9%
0.8%
25-50K
11.2 2.6 2.6 9.2 2.9 7.7 3.350-75K
47.1 7.1 11.0 28.1 13.0 34.9 15.475-100K
74.8 16.2 21.2 37.7 25.1 60.9 30.1100-200K
94.9 58.6 58.7 67.2 52.4 90.1 67.7200-500K
92.5 90.0 92.1 90.6 84.8 92.5 92.1>500K
33.9 30.5 36.1 33.8 32.4 33.8 33.8 AllIncomes
52.5 22.2 24.3 34.8 23.9 45.1 29.0Taxpayerswith
Two
orMore Depe
ndents<25K
3.4%
2.3%
2.5%
3.4%
2.5%
2.7%
2.5%
25-50K
52.1 3.4 13.5 y).} 11.5 37.1 13.850-75K
91.9 17.4 39.9 50.4 48.0 84.5 53.675-100K
98.9 30.1 53.6 51.7 63.8 98.2 73.5100-200K
99.4 56.6 77.1 68.5 82.1 98.9 89.5200-500K
100.0 98.4 99.9 99.3 95.5 100.0 100.0>500K
12.3 12.3 12.3 12.3 12.3 12.3 12.3 AllIncomes
56.1 15.6 27.8 35.6 30.6 50.4 34.311
Table 5: Effectof
AMT
on MarginalTax
Rateson VaiTax
Rate Only,Weighted
byAmount
ofIncome
Itemsious
Income Components,
2010, FederalMarginal
Tax
Rate
Change
(Percentage Points)
Wages
Dividends InterestLong
Term
Gains State Taxes Contributions Declineby>
15 0.0 0.1 0.1 0(1 0.0 1.4 Declineby
10-15 0.1 0.1 0.0 0.0 0.0 12.2 Decline by 5-10 2.3 6.9 5.0 0.2 0.0 16.9 Decline by 0-5 15 3 25.4 20.9 2.6 0.0 4(> sNo
Change
0.1 0.4 0.3 11.7 15.1 8.5 Increaseby 0-5 43.8 35.1 41.2 70.0 0.0 9.4 Increaseby 5-10 20.6 20.6 19.0 15.2 0.1 6.2 Increaseby 10-15 17.5 9.5 11.2 0.7 4.2 0.0 Increaseby>
15 1.1 3.0 3.3 0.5 80.6 0.028
Table6: Share of
Income
and Deductions Affectedby
VariousChanges
inFederalandEffectiveState
Margin
alTax
RatesDue
toAMT,
2010
Marginal
Tax
RateChange
(Percentage Points)
Wages
Dividends InterestLong
Term
Gains State Taxes Contributions Declineby
>15
0.0 0.1 0.1 0.0 0.0 1.4 Declineby
10-15 0.1 0.1 0.0 0.0 0.0 12.2 Declineby
5-10 2.3 6.8 5.0 0.2 0.0 16.9 Declineby
0-5 15.3 25.5 20.9 2.6 0.0 46.5No
Change
0.1 0.4 0.3 11.7 15.1 8.5 Increaseby
0-5 43.8 35.1 41.2 70.0 0.0 9.3 Increaseby
5-10 20.6 20.6 19.0 15.2 0.1 6.2 Increaseby
10-15 17.5 9.5 11.2 0.7 4.3 0.0 Increaseby
>15
1.1 3.0 3.3 0.5 80.5 0.029
Table 7:
Weighted
AverageMe
irginal FederalTax
RatesonIncome
and DeductionsWith
AMT
WithoutAMT
2001
2004
20072010
2013 20012004
2007
2010
2013
Wages
24.1 22.6 23 9 25.1 27.4 23.9 22.3 22.5 22.6 26.6 Interest 32.4 30.0 3 1.4 32.9 35.8 23.5 21.2 21.5 21.9 25.5 Dividends 36.6 26.5 27.7 36.4 39.4 26.1 15.8 15.8 23.5 27.5 RealizedLong-Term
Capital Gains 20.4 16.3 16.6 16.8 15.6 16.9 12.9 12.7 12.2 11.2 State Taxes -17.2 -13.6 -8.0 -6.5 -13.7 -21.1 -19.1 -20.2 -22.3 -26.1 Medical Deductions -12.1 -11.1 -11.1 -11.5 -13.7 -12.1 -11.1 -11.4 -11.9 -14 4Mortgage
Interest -22.1 -20.8 -22.8 -24.4 -26.5 -21.8 -20.2 -20.6 -21.8 -25.4 Charitable Contributions -21.7 -20.0 -21.9 -23.6 -26.1 -21.5 -19.4 -20.0 -21.6 -25.3Notes: Without
AMT
scenarioassumes repeal oftheAMT,
butno otherchangestoincome
taxlaw.
Table 8:
Weighted
Average MarginalTax
RatesonIncome
and Deductions, Federal PlusNetState
Tax
RatesWith
AMT
WithoutAMT
2001
2004
2007
2010 2013 20012004
2007
2010
2013
Wages
28.6 27.4 29.2 30.8-
(, 28.4 27.1 27.8 28.3 32.8 Interest 35.9 33.8 35.7 37.7 41.1 27.0 25.0 25.9 26.7 ;o.s Dividends 40.6 30.5 32.0 41.5 45.0 30.0 19.8 20.1 28.6 33.1 RealizedLong-Term
CapitalGains 24.9 21.0 21.5 22.0 21.2 21.3 17.6 17.6 17.4 16.7 State Taxes -19.7 -16.3 -11.0 -10.0 -17.7 -23.6 -21.8 -23.3 -25.8 -30.1 Medical Deductions -14.2 -13.4 -13.7 -15.0 -17.8 -14.3 -13.4 -14.1 -15.0 -17.8Mortgage
Interest -25.4 -24.3 -26.8 -28.8 -31.3 -25.2 -23.8 -24.6 -26.2 -30.2 Charitable Contributions -24.8 -23.2 -25.5 -27.6 -30.5 -24.6 -22.5 -23.6 -25.6 -29.7Notes: Without
AMT
scenarioassumesrepeal oftheAMT,
butno otherchangestoincome
tax30
Table9: Weighted AverageMarginal
Tax
andSubsidy Rates, 1960-2002Year
Wage
Income Interest Income Dividends RealizedLT
Gains Mortgage Interest Pension Income1960 21.86 n/a 41.64 18.99 n/a n/a
1962 22.11 25.55 42.03 17.53 n/a n/a 1964 20.52 23.18 39.37 17.43 -20.08 n/a 1966 20.11 22.39 37.09 17.73 -19.74 n/a 1967 20.46 22.61 37.86 17.81 n/a n/a 1968 22.89 25.76 40.94 20.27 -22.80 n/a 1969 23.90 26.88 41.34 20.92 n/a n/a 1970 22.89 25.99 38.52 18.08 -22.37 n/a 1971 22.01 25.07 37.16 17.98 n/a n/a 1972 22.46 25.43 36.87 17.86 -22.50 n/a 1973 23.33 26.58 38.00 17.89 -23.43 n/a 1974 24.17 27.53 39.31 18.17 n/a 21.35 1975 24.86 26.62 39.03 17.35 -24.73 21.97 1976 25.71 27.52 41.12 18.24 -25.72 24.70 1977 26.73 27.87 41.23 20.00 -27.62 22.81 1978 28.09 29.06 42.61 19.57 -28.50 23.88 1979 28.22 29.74 43.04 18.34 -28.23 24.03 1980 29.78 31.42 43.01 17.38 -29.12 26.15 1981 30.90 32.15 41.33 18.86 -29.99 27.54 1982 28.86 28.69 35.44 19.18 -27.14 25.89 1983 26.96 26.22 34.04 16.88 -24.83 23.77 1984 26.39 26.56 32.86 17.38 -24.36 24.18 1985 26.59 26.71 32.74 17.35 -24.99 24.10 1986 26.74 25.62 30.95 17.97 -24.82 23.73 1987 23.92 23.16 27.35 24.52 -23.08 n/a 1988 22.47 22.10 24.91 25.51 -22.36 22.80 1989 22.55 22.72 25.04 25.08 -22.44 22.31 1990 22.58 23.55 25.15 24.95 -22.26 22.52 1991 22.55 22.63 25.50 23.89 -21.80 22.22 1992 22.55 22.11 25.28 24.33 -21.63 22.43 1993 23.32 23.56 27.10 25.79 -22.41 22.87 1994 23.61 24.33 27.41 26.11 -22.71 24.02 1995 23.90 25.23 27.85 26.56 -22.77 24.48 1996 24.04 25.09 28.02 26.58 -23.08 25.33 1997 24.46 25.93 28.84 20.34 -23.23 26.08 1998 24.72 26.09 28.75 19.82 -23.26 26.53 1999 25.07 26.47 29.04 19.80 -23.42 27.03 2000 24.99 26.22 28.83 18.53 -23.15 26.82 2001 24.06 25.09 27.90 18.36 -22.32 25.65 2002 24.00 24.99 27.69 18.45 -22.49 25.59
m
I - CN NO On oo rn—
i <'-. oo CN NOd
"t r-~'o
—
. ,—
i oo i—
i CN i—
i cn i t i io
<r,©
ONo
d
rn r--' •^o
cnC
i i ON 1 ON 1 On t r- 00 ON '* rn On ^t_o
o
o
SI^
—
d
—
' OO -^ cn 1 1 i i r ~. -1-c
in NO—
C nO i— i ON 3j COO
o
CN ro*
rn Tf^
*' ^F 'J / -i "7 '"7 1 i 1 C ,~ <D ,_^ CN t> CN >n CN in ONo
o
r-; r~ r~ i> C~ r-^ r~ *-, Di s. CN i 1 1 1 i 1 i i _2m
s. CN _, NOq
NOm
2
<
O
CN iri in CNm
iri in in V.m
m
m
m
m
m
m
o ^ — u>
o
On ON •* r- r~- nOq
do
CN r 1 -J—
! CN—
• oi CNo
/ rn rnm
rom
m
m
—
s c/l *_> u bJD t^ -r NO r- CN f~ CN nO 3— C-o
o
CN __d
d
_;d
_Jd
^H g"
m
rnm
m
m
m
O z 1) -5U
o <*~
<*o
ON P~; oo in3
5o
o
CN~
ONd
ON On ON ONo
"
. (N rn CN Ol CN CN d — ^ 3 _o en (D_
-T On*
ro •* CN Ono
o
CN CN ,— < CN CN CN CN—
5>
cm
rnm
CO rnm
m
Cl> q " 3-©
ON CN oom
—
i CO CUo
CN f» l>^
r^ NO r-^ r^ o CN CN CN CN CN CN CN^
~uX
O
—
i NO OOm
nO r~-o
CL, —-
o
CN in rn rn •<tm
^J-^
CN CN CN Ol CN CN CN -J | C 5c r» Onq
>— 1 "* CN NO—
i 3 CO cao
—
CNm
rn ro' r^im
rnm
to 03 S CN CN CN CN CN CN CN 1) •3" no in NO NO ITj vq in CBO
o
CN CN CN CN CN CN CN CN 5 > CN CN CN CN CN CN CN CO<
v TD <L><
CO cao
o
CN -r «* ^r*
-i •^ *d-~3 CN CN CN CN CN CN CN 3 -J ca 3O
5
co CO O £ 3 Pi .2 " S—
<L> X co op § "3§
'55
•- "> x x £c
&
5 x5
§
X 3a
xO
o
O
X
" f—i2
f^C
'353
r^ XO
jHo
.2O
w
O
[-H3
3
o"5
o
35H
r/5<
Oh LUW W
Ch& w
<
2
w
<
&o<
m
Z
Figure1
RegularandTentative
AMT
Effective Rate in2003 and 2010JointFiling ,
No
Deductions and2 Dependents0.35
?e \oe i?p ztO
W
3ot itt> Vfft ffr&
Figure 2
EvolutionofAverageTaxRates 2002-2010
Fixed Distribution ofIncome1995-1999
800 c o J5
h-<
!11
140 120 100 80 60 40 20Figure 3
Effect ofRaising Exclusion in201
\AMT
sAMTforAGI>10C )K
^<\
-?Ss_ #with/kMT &AG >100K , v#withM
*•• AT/
j?
—
llliiiij-——
—
' 8. 10 20 30 40 50 60 70Increase in ExcercisefromS40,250(joint)
(thousands)
Date
Due
MITLIBRARIES