HAL Id: hal-01354938
https://hal-agroparistech.archives-ouvertes.fr/hal-01354938
Submitted on 22 Aug 2016
HAL is a multi-disciplinary open access
archive for the deposit and dissemination of sci-entific research documents, whether they are pub-lished or not. The documents may come from teaching and research institutions in France or abroad, or from public or private research centers.
L’archive ouverte pluridisciplinaire HAL, est destinée au dépôt et à la diffusion de documents scientifiques de niveau recherche, publiés ou non, émanant des établissements d’enseignement et de recherche français ou étrangers, des laboratoires publics ou privés.
Distributed under a Creative Commons Attribution - NonCommercial - NoDerivatives| 4.0 International License
Using a multicriteria assessment model to evaluate the
sustainability of conservation agriculture at the cropping
system level in France
Damien Craheix, Frédérique Angevin, Thierry Doré, Stéphane de Tourdonnet
To cite this version:
Damien Craheix, Frédérique Angevin, Thierry Doré, Stéphane de Tourdonnet. Using a multicriteria assessment model to evaluate the sustainability of conservation agriculture at the cropping system level in France. European Journal of Agronomy, Elsevier, 2016, 76, pp.75-86. �10.1016/j.eja.2016.02.002�. �hal-01354938�
Elsevier Editorial System(tm) for European Journal of Agronomy
Manuscript Draft
Manuscript Number: EURAGR5154R1
Title: Using a multicriteria assessment model to evaluate the
sustainability of conservation agriculture at the cropping system level in France
Article Type: Research paper
Keywords: multicriteria assessment, conservation agriculture, sustainability, direct seeding, cropping system
Corresponding Author: Dr. Frederique Angevin, Phd Corresponding Author's Institution: INRA
First Author: Damien Craheix
Order of Authors: Damien Craheix; Frederique Angevin, Phd; Thierry Doré; Stéphane de Tourdonnet
Highlights
Sustainability of French cropping systems was assessed with a multicriteria model.
Systems implemented various levels of conservation agriculture principles.
Diversified rotations achieved good sustainability scores regardless tillage type.
Combining reduced tillage and diversified rotation improves environmental impacts.
Conservation agriculture is not panacea, but it remains a promising strategy.
1
Using a multicriteria assessment model to evaluate the
sustainability of conservation agriculture at the cropping system
level in France
Craheix D.
a, Angevin F.
a, Doré T.
b,d, de Tourdonnet S.
ca
INRA,UAR 1240 Eco-Innov, F-78850 Thiverval-Grignon, France b
AgroParisTech, UMR 211 Agronomie, F-78850 Thiverval-Grignon, France dINRA, UMR 211 Agronomie, F-78850 Thiverval-Grignon, France
cMontpellier SupAgro - IRC, UMR 951 Innovation, SupAgro-INRA-CIRAD, 2 place Viala,
34060 Montpellier Cedex 1, France
Key words: multicriteria assessment, conservation agriculture, sustainability, direct seeding,
cropping system.
Corresponding author: Frederique Angevin (Frederique.Angevin@grignon.inra.fr)
*Manuscript
Click here to view linked References
2
Abstract
1
Several international research and development organisations are promoting conservation 2
agriculture in a wide range of contexts. Conservation agriculture is based on a combination 3
of three main principles: (i) minimal or no mechanical soil disturbance; (ii) diversified crop 4
rotations and (iii) permanent soil cover (consisting of a growing crop or a dead mulch of crop 5
residues). However, in the face of the diversity of practices that can be associated with 6
conservation agriculture, of goals assigned to agricultural systems, and pedoclimatic 7
contexts, there is still no empirical evidence about the overall performance of conservation 8
agriculture in France. Global assessments of conservation agriculture, with the full or partial 9
application of its principles and in different contexts, are required to provide a more 10
comprehensive picture of the performance of such systems. We tackled these objectives 11
simultaneously, by evaluating 31 cropping systems with the MASC® model (for Multicriteria 12
Assessment of the Sustainability of Cropping Systems). These systems were selected to 13
represent a wide diversity of practices, from ploughed conventional systems to crop 14
sequences based on the full application of conservation agriculture principles. Positive 15
interactions were observed between the key elements of conservation agriculture, resulting 16
in better sustainability performances (particularly in terms of environmental criteria). 17
Nevertheless, the systems most closely respecting the principles of conservation agriculture 18
displayed several weakness, principally of a social or technical nature, in this study. Careful 19
attention should be paid to attenuating these weaknesses. A more detailed analysis of the 20
results also suggested that decreasing soil tillage tends to decrease the overall performance 21
of the system unless associated with a diversification of the crop rotation. 22
3
1. Introduction
23
After the Second World War, increasing yields was a key priority, influencing a shift in 24
European policy towards the promotion of more intensive practices based on mechanisation 25
and high levels of inputs such as energy, fertilisers, and pesticides (Tilman et al., 2002). 26
These policies rapidly lead to increases in yield, but they were counterbalanced by negative 27
environmental impacts, such as groundwater pollution, decreases in soil organic matter 28
content, soil erosion and biodiversity losses. Agriculture is now facing an increasing number 29
of new challenges (e.g. coping with market volatility, resource scarcity and rising demand for 30
raw materials) placing the future of agricultural production systems, ecosystems and the 31
services they provide to society in jeopardy (Tilman et al. 2002) 32
33
In response to these challenges, farmers and agronomists have been trying to develop 34
alternative cropping systems. Conservation agriculture (CA) is one of the innovations 35
proposed and is among the most extensively studied new systems developed in recent 36
decades (Scopel et al., 2012). CA systems are based on the following three principles: (i) 37
minimal or no mechanical soil disturbance; (2) diversified crop rotations and (3) permanent 38
soil cover (consisting of a growing crop or a dead mulch of crop residues) (FAO, 2008). 39
Conservation agriculture has been actively promoted by several international research and 40
development organisations, in a wide range of contexts, on the basis of specific field 41
observations and literature reviews (Dumanski et al., 1998; Hobbs et al., 2008; Holland, 42
2004; Lapar and Pandley, 1999; Lestrelin et al., 2012). CA has already been massively 43
adopted on large-scale mechanised farms, particularly in Australia and Americas but its 44
adoption remains limited in other parts of the world such as Africa and Western Europe 45
(Derpsch et al., 2003; Lahmar, 2010). With the low level of dissemination of CA systems in 46
these regions and the diversity of practices associated with these systems, the effective and 47
global performances of this set of innovations remain unclear and the benefits of CA are 48
increasingly being questioned in the scientific community (Giller et al., 2011; Peigné et al., 49
4 2009; Serpantié et al., 2009). Western European farmers adopting CA approaches often do 50
so without completely respecting all of the principles of CA. This makes it possible for them 51
to broaden the range of options open and to adapt the principles of CA to local conditions. 52
However, it also greatly affects the efficiency and impact of CA systems in the short and long 53
term (Scopel et al., 2012). In the face of the diversity of (i) practices associated with CA, (ii) 54
goals assigned to agricultural systems, and (iii) pedoclimatic contexts, there is still no 55
empirical evidence about the overall performance of CA in the French context (Lhamar, 56
2010). There is therefore a crucial need to determine the reliability of this innovation with 57
respect to conventional practices (generally involving more intensive soil tillage and less 58
diversified crop rotations), and to clarify the benefits and drawbacks of the full or partial 59
application of conservation agriculture in this context. 60
To this end, CA systems should be assessed, like other innovations in agriculture, by 61
considering economic, social and environmental aspects, including the expectations of 62
farmers and society at large. Classical approaches based on the optimisation of economic 63
functions, such as cost-benefit analysis, have several drawbacks in this context. These 64
methods are based on quantitative, often monetary variables and are not entirely adequate 65
for the realistic representation of various performances, particularly those relating to social 66
and environmental performances (e.g. difficulty, complexity of implementation, pressure on 67
biodiversity). As already pointed out by other authors, multicriteria evaluation methods 68
suitable for the analysis of qualitative data may be more relevant for the sorting and 69
classification of technical solutions when considering a broad diversity of performances 70
(Figueira et al., 2005, Sadok et al., 2008). Multicriteria decision aid methods, such as the 71
MASC® model (Sadok et al., 2009) should therefore be used for such assessments. In this 72
study, using this assessment framework and performed in the context of medium-sized 73
mechanised farms in France, we aimed to determine the extent to which the partial or 74
complete implementation of CA principles affected the overall sustainability of cropping 75
systems. More detailed analyses of the consequences of CA implementation, such as this 76
one, should make it clearer which of the principles of CA contribute most (or not at all) to the 77
5 desired effects in France, and should make it possible to identify ways of improving these 78
cropping systems as well. 79
80
2. Materials and methods
81
2.1 Presentation of the MASC model
82
We chose to use the MASC 2.0 (for Multicriteria Assessment of the Sustainability of 83
Cropping Systems) model (Craheix et al., 2012a; Sadok et al., 2009) in this study, for three 84
reasons. Firstly, MASC operates at the level of the cropping system, defined as “a set of 85
management procedures applied to a given, uniformly treated area, which may be a field or a 86
group of fields” (Sebillotte, 1990). The cropping system includes the sequence of crops 87
(rotation) and the various aspects of their management (soil tillage, sowing rate and date, 88
cultivar choice, rates and dates of fertiliser application, crop protection strategy). This small 89
scale is particularly relevant for precise assessments of the negative and positive impacts of 90
the principles of CA, which are closely tied to the field level. Secondly, MASC provides a 91
holistic view of the various performances of the cropping system, because it takes into 92
account the conflicting objectives underlying the economic, social and environmental 93
dimensions of sustainability. Thirdly, this model was also chosen because it can handle 94
various sources of knowledge, managing both quantitative and qualitative information, in the 95
assessment of cropping system performances. MASC was implemented within DEXi 96
computer software (Bohanec, 2014). This software can be used to design qualitative 97
multicriteria models breaking decision problems down into smaller, less complex sub-98
problems formulated in terms of a hierarchy of criteria and aggregation functions. 99
100
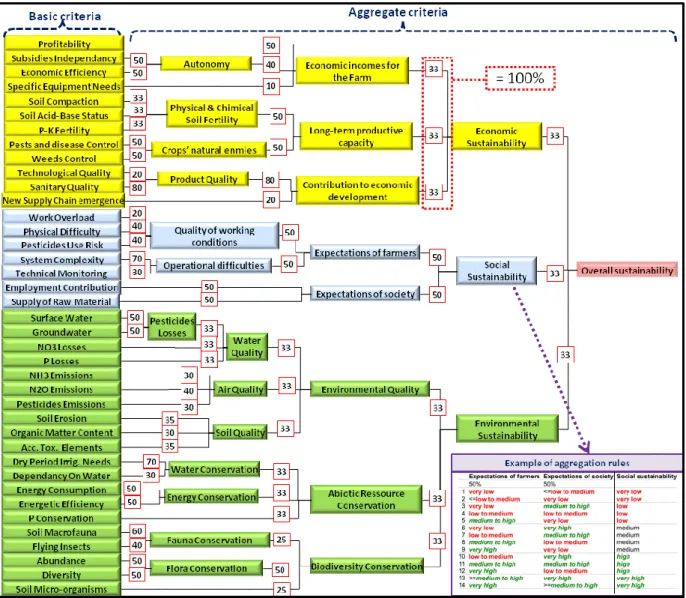
Through this formalism, MASC conceptualises the sustainability assessment problem by 101
breaking it down into the three classical dimensions used to define sustainability (social, 102
economic and environmental; Ikerd, 1993, United Nations, 1996). Each dimension 103
6 represents a hierarchy of sustainability objectives organised into a tree-like structure formed 104
by 65 variables (see Figure 1). 105
Figure 1
106
Each variable has a number of qualitative values (or modalities), from 3 to 7, typically taking 107
the form of a “LowMediumHigh” progression, with the addition of classes such as ”Very 108
Low/Very High” and “Rather low/rather high” in some cases. Variables can be classified as 109
basic criteria (i.e., input variables; 39 variables) and aggregate criteria (i.e., aggregate 110
variables; 26 variables). 111
112
Basic criteria relate to elementary concerns of sustainable development (e.g., “Profitability”, 113
“Nitrate losses” and “Soil erosion”). These criteria are entered into the model via specific 114
indicators proposed by the model designers. The methods for calculating or evaluating these 115
indicators are detailed in Tables 1 and 2. Six of the 39 indicators proposed are based on 116
direct expertise. The main factors to be taken into account in this expertise are also reported 117
in Tables 1 and 2. Twenty indicators are based on quantitative variables obtained by 118
calculation. For this type of indicator, quantitative values are converted into qualitative 119
variables compatible with the DEXi software through the use of locally defined thresholds. 120
For instance, for the criterion “Profitability”, results for the semi-net margin are based on 121
threshold values covering the diversity of the margin observed in a region (e.g. : Very low ≤ 122
€200 /ha ≤ Medium to low ≤ €400/ha ≤ Medium to high ≤ €600/ha). The other 13 indicators 123
are classified as “mixed” as they can deal with both qualitative and quantitative data. These 124
indicators are developed in DEXi software by disaggregating a basic criterion in a subtree, 125
the inputs of which are obtained from a qualitative description of the system or by simple 126
calculation, with the use of threshold values for conversion into qualitative inputs. 127
In DEXi®, aggregations are performed for each criterion with "utility functions" materialised in 128
tables completed with ‘IF-THEN’ aggregation rules, such as IF <the criterion “Expectations of 129
7 Society” is “Very low”> AND IF <the criterion “Expectations of Farmers” is “Low to medium”> 130
THEN <the aggregate criterion “Social Sustainability” is “Very low”> (see the example in
131
Figure 1). Each utility function can be filled in manually or semi-automatically, based on the 132
weights applied to each criterion. All the utility functions were included in the model by the 133
designers and can be considered to provide a well-balanced perception of sustainability, 134
given that the weights are generally evenly distributed between criteria. However, users can 135
modify these functions, to adapt the model to their local context and preferences (Craheix et 136
al., 2012b). In this study, we performed assessments with the weights assigned by the
137
designers of the MASC model (Figure 2). Using the aggregation devices of the MASC model, 138
it is possible to rank the cropping systems according to their overall sustainability and its 139
three dimensions (i.e. economic, social, and environmental). In DEXi software, an ordinal 140
scale is associated with each qualitative scale (e.g. very low=1, low=2, … , very high=5). The 141
mean and standard deviation of the ordinal scales can therefore be calculated and used to 142
represent the results. 143
Relative to the first version published by Sadok et al. (2009), the second version of the 144
model, as used here, presents several improvements that helped to delimit the outline of this 145
assessment. The designers made use of feedback from the initial users (Craheix et al., 146
2012c) and included new criteria in the tree, to ensure that levels such as the production 147
chain and society were better encompassed in the economic and social dimensions (e.g.: 148
"Supply of raw materials", "New supply chain emergence" , "Sanitary quality"). In accordance 149
with a previous adaptation of MASC 1.0 to organic farming systems (Colomb et al., 2012), a 150
new branch, “Long-term productive capacity”, was inserted into the economic dimension of 151
MASC 2.0. This modification makes agronomic viability a key determinant of the economic 152
sustainability of innovative cropping systems, by taking into account both soil fertility and the 153
control of pests and weeds. Finally, based on the DEXiPM model (Pelzer et al., 2012), the 154
"Biodiversity Conservation" branch of the environmental dimension was profoundly modified 155
to restrict assessment to the less mobile groups of organisms, which are heavily dependent 156
8 on crop interventions at the field scale (i.e. flora, soil macrofauna, flying insects and soil 157
micro-organisms). These new criteria were inserted while taking advantage of the sensitivity 158
analysis performed on the MASC model (Carpani et al., 2012; Bergez, 2013). They were 159
designed to both maintain sensitivity of the model and to avoid structural effects leading to 160
involuntarily increase of the weight of some criteria. 161
Finally, the aptness of the model for evaluating the performances of CA systems was 162
evaluated by following a three-step procedure (Bockstaller et al. 2009; 2003) based on: (i) an 163
evaluation of the structure of the model (ii) an evaluation of the outputs generated by the 164
model and (iii) an evaluation of the usefulness of the model in diverse situations of use. At 165
each of these stages, we combined constructive criticism from a broad panel of experts and 166
stakeholders involved in this study (researchers, advisors, farmers) with information 167
published in peer-reviewed articles. This work led to a number of improvements that were 168
directly integrated into the second version of the MASC model used in this study. 169
2.2 Description of the cropping systems evaluated
170
In this study, 31 cropping systems were selected from both farm-based and experimental 171
station sites, to represent a wide diversity of practices, from ploughed systems with short 172
crop rotations to systems in which the principles of CA were fully applied (Table 3). 173
174
The description of these cropping systems was based on a list of farming practices and the 175
yields obtained for each crop, through a combination of recorded data and expertise. The 176
cropping systems were collected from six different regions of France (i.e. Haute-Normandie, 177
Champagne-Ardenne, Rhône-Alpes, Centre, Aquitaine, Franche-Comté), so as to take into 178
account various pedoclimatic contexts. In terms of economic data, we considered, for all the 179
cropping systems assessed, the same purchase prices for inputs and selling prices for crops, 180
based on the average over the preceding five years (i.e. 2008-2013). 181
Table 3
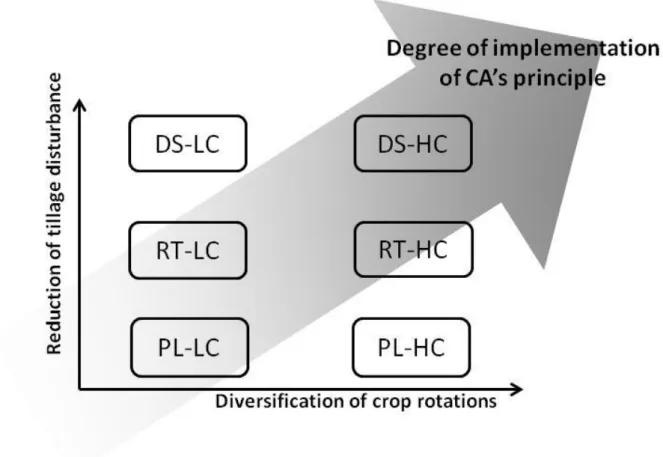
9 We defined six types of cropping system on the basis of the extent to which the principles of 183
CA were applied (Figure 2). These types were defined in terms of the intensity of tillage and 184
the diversity of crops in the rotation. The permanence of soil cover, the third pillar of CA, was 185
taken into account indirectly in this typology, by combining the information for the first two 186
pillars. The intensity of tillage was assessed by assigning cropping systems to one of three 187
classes: (i) ploughed cropping systems (PL), in which ploughing was performed at least one 188
year in three in the crop rotation, (ii) cropping systems based on reduced tillage (RT), 189
including both low-frequency ploughing (less than one year in three) and regular non-190
inversion tillage (i.e. chisel plough, disc plough, rotary harrow) and (iii) direct seeding 191
cropping systems (DS) with no ploughing and a very low frequency of tillage or of shallow 192
interventions (to a depth of no more than 5 cm). Cropping systems were assigned to one of 193
two groups for crop rotation, to distinguish between rotations with high and low levels of 194
diversification. These two groups were defined on the basis of rotation length, the presence 195
of cover crops, the diversity of crop families and the presence of different and distinct sowing 196
dates in the crop sequence. 197
Figure 1
198
3. Results
199
3.1 Analysis of the main sustainability criteria scores
200
The overall sustainability scores of the various cropping system types (Figure 3) were 201
between 3 (“rather low”) and 6 (“high”). Systems based on diversified rotations had the best 202
overall sustainability scores, with a mean score of more than 5 (“rather high”), regardless of 203
the tillage conditions. Diversification of the rotation thus had a stronger positive effect than 204
decreasing soil tillage on the overall sustainability score obtained with MASC. Conversely, 205
decreasing soil tillage only had a marked impact on the results in systems with low levels of 206
crop diversification. In this situation (LC), only systems with superficial soil tillage only (RT-207
LC) had overall sustainability scores above four (“medium”). Systems combining direct 208
10 seeding and a low diversification of the rotation had lower overall sustainability scores (3/7, 209
“rather low”), close to those of conventional systems (PL-LC). 210
Figure 3
211
We then used the results for the three underlying dimensions of sustainability to refine our 212
analysis. For the economic dimension of sustainability, the conventional system (PL-LC type) 213
had a mean score of 3 (“medium”), but all the other types had mean scores of between 4 (i.e. 214
“rather high”) and 5 (i.e. “high”). 215
For the social dimension of sustainability, the DS type presented the worst results, 216
particularly for low levels of diversification of the crop rotation. By contrast, the PL and RT 217
types had better mean scores, between 4 (i.e. “high”) and 5 (i.e. “very high”). 218
For the environmental dimension of sustainability, there was clearly a positive interaction 219
between reducing tillage and diversifying crop rotations. For environmental sustainability, 220
none of the cropping systems based on short and less diversified crop rotations had a score 221
of 3 (“medium”) or more. Environmental performance was more variable for reduced tillage 222
(RT) systems than for the other types of system. 223
3.2 Analysis of scores for basic criteria
224
The results of each dimension were too synthetic to account for the overall ranking on their 225
own. A more detailed analysis of the basic criteria was therefore required to identify the 226
major strengths and weaknesses of the cropping systems studied. Only the results for the 227
principal basic criteria discriminating between the systems evaluated in terms of performance 228
are presented here. 229
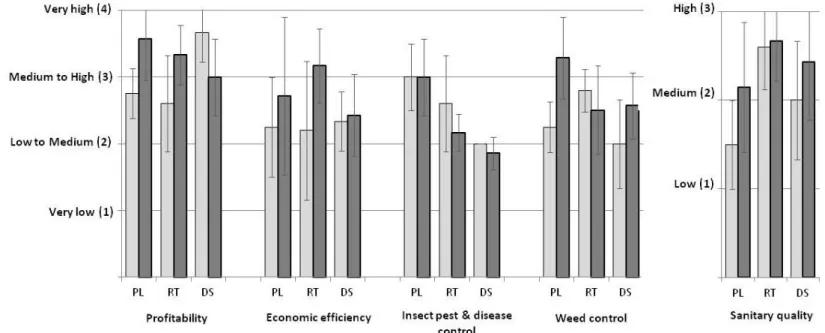
More detailed results for the economic dimension (Figure 4) indicated that systems with low 230
frequencies and shallow depths of soil tillage (i.e. the RT and DS types) were at least as 231
profitable as ploughed systems. These systems obtained better results for the “economic 232
efficiency” criterion, reflecting a lower economic dependence on inputs (e.g. fuel, fertiliser, 233
pesticides). Nevertheless, reduced tillage systems and systems with only very superficial 234
11 tillage operations had worse results than ploughed systems for the criteria “weed control” and 235
“control of insect pests and diseases”. In parallel, systems based on long diversified 236
rotations, particularly those including legumes (as the principal or cover crop) were generally 237
more profitable and had a higher economic efficiency than less diversified systems. These 238
systems also had better scores for the criteria “weed control” and “sanitary quality” 239
(estimating the sanitary risk associated with the presence of mycotoxins). However, systems 240
combining a diversified crop rotation with reduced or very superficial soil tillage did not obtain 241
better results than other systems for the indicator “control of insect pests and diseases”. 242
Figure 4
243
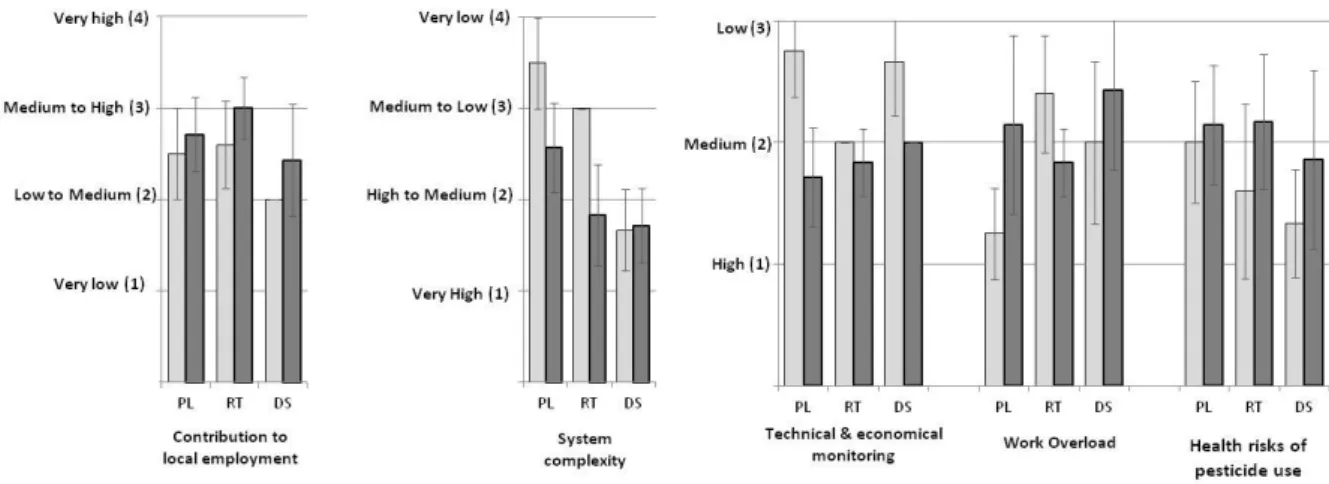
For the social dimension (Figure 5), we observed that reduced tillage and direct seeding 244
systems (i.e. RT and SD) obtained better scores for the criterion “work overload” than 245
ploughed systems. This criterion reflects the capacity of a system to decrease the number of 246
hours of work required at busy times (e.g. sowing, weed control and harvesting). However, 247
these systems were penalised for their small contribution to employment, due to the small 248
number of hours of work required per hectare and per year. Our results indicated that the 249
lower intensity of soil tillage in these systems also had a negative impact on the criteria 250
“health risk for farmers” due to the large number of applications of phytosanitary products. 251
The results for the “system complexity” criterion also reflected the greater difficulty for 252
farmers to control the need for interventions in these cropping systems. 253
254
Figure 5
255
However, the deleterious effects of direct seeding systems were nevertheless smaller in 256
more diversified crop rotations (DS-HC in Figure 3). In these rotations, the presence of a 257
greater diversity of main and cover crops seemed to have a positive impact on the criterion 258
“contribution to local employment”, by increasing the mean number of hours of work per year, 259
and on the criterion “pesticide use-related health risk”, due to smaller numbers of pesticide 260
12 applications (Figure 4). The social impact of a greater diversity of crops in the rotation was 261
nevertheless essentially negative for the criteria “system complexity” and “technical and 262
economic monitoring time”. Indeed, the main and cover crops in these rotations, which 263
differed from those present in less diversified rotations, were often a bit more difficult to 264
manage (e.g. insertion and destruction of new cover crops) and the larger number of different 265
crops also increases the time that the farmer must spend updating his technical and 266
economic knowledge about his crops. 267
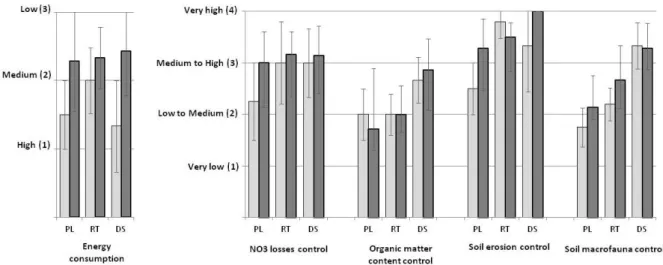
For the environmental dimension, cropping systems with long and diversified crop rotations 268
(HC) obtained the best scores, particularly when combined with reduced tillage (RT) or direct 269
seeding practices (DS) (Figure 3). As indicated by the more detailed results in Figure 6, 270
these systems had better results than ploughed systems for the criteria “soil macrofauna 271
conservation”, “soil erosion control” and “soil organic matter content control”. However, their 272
performances were similar to those of ploughed systems for the criterion “energy 273
consumption” and “control of NO3 losses”. 274
Diversified rotations performed better than less diversified systems for the criterion “energy 275
consumption”. Thus, whereas reducing tillage decreases direct fuel energy consumption, 276
diversifying the rotation, particularly if legumes are included, makes it possible to decrease 277
more strongly the input of mineral nitrogen, a major contributor to the indirect consumption of 278
energy. In this respect, SD-LC systems had the worst results, due to the use of larger 279
amounts of synthetic nitrogen fertiliser to nourish the higher proportion of cash crops in these 280
cropping systems. The diversification of rotations, particularly if cover crops are included, 281
was mildly advantageous for the criteria “soil erosion control” and “control of NO3 losses”. 282
The results obtained for the criteria “organic matter content control” and “soil macrofauna 283
conservation” differed little between rotations as a function of the level of diversification. 284
Figure 6
285
4. Discussion
13
4.1 Variability of the results
287
The results obtained for the aggregate and basic criteria revealed a relatively high level of 288
variability within each of the cropping system types evaluated. This variability was no greater 289
for conventional agriculture systems than for systems following the principles of CA more 290
closely. This variability was sufficiently large for better overall sustainability scores to be 291
obtained, in some situations, by ploughed systems or systems based on short rotations with 292
low levels of diversification than by systems adhering more closely to the principles of CA. 293
This high degree of variability highlights the importance of not focusing too heavily on the 294
determinants used to construct this typology (intensity of soil tillage and diversification of 295
crops in the rotation) at the expense of the broad range of technical options available in each 296
cropping system type (e.g. choice of material, intervention dates, crop varieties). 297
It should also be noted that soil tillage and the diversity of crops included in the rotation are 298
not the only determinants accounting for the performance of cropping systems, in terms of 299
basic and aggregate indices. Many other farming operations, such as the level of use of 300
fertilisers and pesticides, and site-specific factors, including soil characteristics and local 301
climatic conditions, can account for differences in performance within a given cropping 302
system type (Erenstein, 2003; Knowler and Bradshaw, 2007). More precise studies are 303
required to unravel the multiple complex interactions between management factors and to 304
determine the precise locations and conditions most suitable for CA. 305
It should also be borne in mind that differences in performance between years were not 306
taken into account in this study, because the evaluations are based on an “average 307
description” of the systems and their climatic and economic environments. In general, few 308
scientific studies take into account the interannual variability of economic, social and 309
environmental performances in CA systems. There is nevertheless considerable variability in 310
performance, particularly during the transition phase, which largely determines the 311
attractiveness of CA to farmers. In this respect, as pointed out by Giller et al. (2011; 2009), a 312
more precise analysis of the robustness of performances in CA is a key issue that should be 313
14 addressed by researchers, to determine, in particular, the effect of climatic variability on 314
these systems. 315
316
4.2 Output evaluation and the main lessons learned
317
As previously stated and recommended by Bockstaller et al. (2009, 2003), the a priori 318
evaluation of the structure of the model for its use in conservation agriculture was followed by 319
an a posteriori analysis of the results produced. Due to the immeasurable nature of 320
sustainability and the number of indicators used to evaluate it, we were unable to perform an 321
evaluation based on comparisons with measurements or direct observations in the field. The 322
pertinence of the results will therefore be assessed here by comparison with published 323
results from scientific studies focusing on the performances of conservation agriculture in 324
similar contexts. We avoided tautological validation by paying particular attention to avoiding 325
the citation of articles used to construct or improve the structure of the indicators. 326
327
There is little scientific evidence for an economic impact of CA in the European context. 328
Nevertheless, according to Lahmar (2010) and Scopel et al. (2012), cost savings in terms of 329
fuel, labour and machinery remain the most important economic features of conservation 330
agriculture, driving its adoption in Europe. These observations are consistent with the results 331
obtained for the “economic efficiency” indicator. According to the same authors, the impact 332
on profitability of the adoption of the principles of CA remains difficult to estimate due to the 333
diversity of contexts and practices. Nevertheless, according to Scopel et al. (2012), these 334
practices generally appear to be profitable when they are technically well mastered. This is 335
an important aspect, because decreasing soil tillage tends to increase the risks of infestation 336
with weeds (Debaeke and Orlando 1994) and necrotrophic parasites, which may survive and 337
develop on crop residues at the soil surface (Glen and Symondson, 2003, Kreye, 2004). 338
These observations are consistent with the results provided by MASC in this study, indicating 339
that this short-term economic benefit could be counterbalanced by a yield decrease, due to 340
15 higher levels of infestation with weeds, pests and diseases or additional costs relating to their 341
control. According to Lahmar (2010), such problems may lead some European farmers to 342
prefer specific crops that are more easily managed with CA or to return to conventional 343
practices. However, these outcomes go against the empirical experience of some of the 344
farmers and advisors involved in this study, who reported that such systems were actually 345
less susceptible to pests, diseases and weeds because the lower level of soil disturbance 346
results in a greater biodiversity of natural enemies, and well adapted crop rotations prevent 347
the build-up of pests and weeds. These observations are consistent with several other 348
scientific findings (Derpsch et al., 2003; Palm et al., 2014; Sturz et al., 1997). Thus, although 349
the results of this study highlight some of the weaknesses of CA cropping systems, they also 350
identify a weakness of the MASC model, in terms of its ability to estimate the agronomic 351
effects of biodiversity from a description of the practices employed and the context. As 352
suggested by Bell and Morse (2008), the designers of the MASC model built their indicators 353
from the available scientific knowledge, whilst trying to keep their use relatively simple. This 354
probably led to the retention of rules that are too generalised and that do not precisely cover 355
the diversity of pedoclimatic situations and techniques observed in this study. As pointed out 356
by Médiène et al. (2011), we still have little scientific information concerning the responses of 357
biological process to agricultural practices in a given pedoclimatic context. Thus, as 358
highlighted by Palm et al. (2014), the complex trade-off between the services provided and 359
the deleterious effects caused by the greater biodiversity resulting from reduced tillage and 360
diversification of the crop rotation remains unclear. Specific studies on this topic are therefore 361
required to identify the determinants involved and to make it possible to propose more 362
accurate indicators. 363
Reduced and no tillage systems had poorer performances for the social dimensions of the 364
model than other cropping systems with more intensive tillage. DS cropping systems 365
performed less well than other systems for the criteria “system complexity”, “health risk of 366
pesticide use” and “contribution to local employment”. These results are basically consistent 367
16 with most of the published results concerning the performances of CA. Overall, CA is often 368
seen as a complex set of interrelated practices that typically requires several rounds of 369
adaptation to become fully viable. It involves learning on the part of the farmer, local 370
adaptation, and breaking with a long-standing tradition of soil tillage and the removal of crop 371
residues (Giller et al., 2011; Lahmar, 2010). 372
The lack of tillage in SD cropping systems, particularly those with a low level of crop 373
diversification in the rotation, often results in the proliferation of weeds, necessitating the 374
more frequent application of larger amounts of herbicide by farm workers (Chapelle-Barry, 375
2008), resulting in the exposure of these workers to a higher risk of toxicity. Moreover, the 376
overall decrease in working time associated with reduced tillage systems, which is generally 377
attractive for farmers, is considered to be a negative aspect in the MASC model, because it 378
may lead to a decrease in agricultural employment in the area. This criterion draws attention 379
to one of the potential risks of the widespread adoption of CA. However, the accuracy of this 380
assessment is restricted to the information available at the field scale. According to Lahmar 381
(2010), the labour saved by not tilling the soil could be diverted to other agricultural or non-382
agricultural activities on a larger scale. This highlights how the “granularity” of the 383
spatiotemporal scales of the cropping system is less relevant for addressing issues that are 384
partly dependent on higher levels of organisation, such as the farm or an agricultural region 385
(e.g. indicators “work overload” and “emergence of a new supply chain”). The results for this 386
criterion should therefore be interpreted with caution, focusing purely on the contribution of 387
the cropping system, everything else being equal. 388
The main benefits in terms of the environmental dimension of cropping systems closely 389
following CA principles (i.e. RT-HC and SD-HC) are consistent with the observations of 390
several authors in temperate regions in Europe. Reduced and no tillage systems, particularly 391
if the crop residues are left on the soil surface, tend to lead to an increase in carbon 392
sequestration within the soil. In terms of biodiversity conservation, positive effects of CA on 393
the soil macrofauna, flora and micro-organisms have also been reported by many authors 394
17 (Debaeke and Orlando, 1994; Emmerling, 2001; Peigné et al., 2009; Vian et al., 2009). CA 395
has also been reported to limit soil erosion, by improving water infiltration, due to the higher 396
soil organic matter content and the presence of crop residues at the soil surface. The larger 397
population of earthworms in conservation tillage conditions is also known to favour water flow 398
and infiltration (Frielinghaus, 2007). Decreasing the frequency of tillage decreases the direct 399
consumption of fossil energy, but diversifying the rotation by introducing legumes appears to 400
be a more efficient way of decreasing energy consumption. The introduction of legumes into 401
the rotation makes it possible to decrease the total amount of nitrogen fertiliser applied. 402
Several authors have reported a strong correlation between the total energy consumption of 403
cropping systems and the amount of nitrogen fertiliser applied. 404
405
The MASC model provided an overview of the performances of cropping systems as a 406
function of the degree to which CA principles were applied, within the French context. As 407
suggested by Giller et al. (2009) the assessment of a large number of cropping systems and 408
the analysis of their performances according to whether the principles of CA were applied, 409
fully, partially or not at all, make it easy to determine which of these principles contribute to 410
the desired effect. The results of this study suggest that decreasing, or even abolishing 411
tillage, one of the major symbolic pillars of CA systems, is not the most effective way to 412
increase the overall sustainability of cropping systems. Direct seeding systems with short 413
and undiversified rotations gave the worst sustainability results, with scores slightly lower 414
than those for conventional systems. Conversely, the adoption of long diversified crop 415
rotations, regardless of the soil tillage conditions, appeared to be essential for attaining a 416
high level of overall sustainability. Therefore, rotations including diverse cash and cover 417
crops are an essential element of CA systems, as they provide an effective way to manage 418
pests and weeds in the absence of soil tillage. The promotion of greater biodiversity at the 419
field level favours the better use of natural resources, a more regular distribution of labour 420
and more diversified farm incomes (Calegari et al., 2008; Médiène et al., 2011; Scopel et al., 421
18 2012). Therefore, consistent with the assertions of most authors (Derpsch et al., 2003; 422
Erenstein, 2003; FAO, 2008; Hobbs, 2007; Scopel et al., 2012), CA is an “holistic” package 423
that works well only when all three pillars are applied simultaneously. 424
4.3 End-use evaluation of the MASC model and precautions for use
425
This study provides a form of evaluation of the model in terms of its utility in the situation of 426
application. According to Bockstaller et al. (2003), an assessment model may lack 427
usefulness for several reasons: a target of great relevance to potential users may have been 428
left out, some data required for calculations may not be available or the outputs of the 429
assessment may be incomprehensible or illegible. 430
The positive feedback received from several of the stakeholders (e.g. researchers, extension 431
workers and farmers) involved in this study suggests that the major preoccupations of users 432
were adequately taken into account (Craheix et al., 2012b; Craheix et al., 2012c). Thus, the 433
holistic approach of the MASC model, based on a sustainability assessment, provides a 434
suitable overview of the performance of cropping systems, by taking into account 435
simultaneously (i) the multiple objectives of the economic, social and environmental 436
dimensions; ii) various time scales, ranging from the short term to the long term and (iii) the 437
concerns raised at various levels, including the expectations of farmers and of society as a 438
whole. However, although this assessment framework may be seen as very integrative and 439
objective, caution is required in the use of such models and the interpretation of the results 440
obtained, due to the underlying subjectivity inherent in the criteria chosen and their 441
aggregation (Bell and Morse, 2008). Designers try to counterbalance this apparent binding 442
framework by encouraging debate with end-users when interpreting results. Designers have 443
also introduced flexibility by allowing users to modify both the method by which basic criteria 444
are assessed (i.e. choice of indicators) and the weights assigned to the various criteria, so as 445
to integrate their own preferences and visions of sustainable development into the parameter 446
settings. Interesting results have already been reported in France, where the MASC model 447
was used to get farmers involved in the evaluation of their cropping systems through the 448
19 discussion and modification of parameter settings (Craheix et al., 2012b). In this study 449
cropping systems were ranked with the default version of MASC, based on a balanced 450
perception of sustainability. It should be borne in mind that the rankings would be probably 451
different if the weights were modified (e.g. by increasing the relative weight of the 452
environmental dimension for instance). Therefore, according to the designers of the MASC 453
model and as suggested by Bell and Morse (2008), the development and use of the 454
multicriteria assessment method for sustainability requires maximum transparency and 455
flexibility and should never be limited to the interpretation of aggregate results alone. 456
Regarding the ease of use of the model in terms of the availability of the data required and 457
the comprehensibility of the outputs, the ability of MASC to deal with qualitative information 458
appeared very useful in these real-use situations. Firstly, as noted above, processing 459
qualitative information makes it possible to use quantitative values by simply using 460
thresholds to render them qualitative. This flexibility makes it possible for the MASC model to 461
combine various data, such as simple measurements (e.g. yields), calculated data (e.g. 462
semi-net margin) and empirical knowledge (e.g. physical difficulties of crop interventions) into 463
the indicators, so as to make the best use of commonly available information. Secondly, it 464
makes it possible to integrate the decision-maker’s own views (concerning the “system 465
complexity” criterion, for example) into the model, as these views are not necessarily 466
expressed through formal, quantitative models. Finally, regarding the legibility of the outputs, 467
as suggested by Munda et al. (2005), qualitative and linguistic forms (such as “low”, 468
“medium” or “ high”) appeared to be well understood by the stakeholders concerned as 469
natural representations of human judgments and cognitive observations. Furthermore, 470
qualitative decision rule-based methods are considered relevant for non-compensatory 471
decision strategies involving the aggregation of results for different criteria (Ma, 2006), 472
making it easier to tackle the issues of a lack of comparability and immeasurability that often 473
underlie the dimensions of sustainability in agricultural systems (Sadok et al., 2008). 474
Nevertheless, the homogenisation of calculated variables into qualitative variables, which are 475
20 by nature discrete, together with the classification of the systems studied into large classes, 476
may lead to marked differences in judgement concerning performances that are actually 477
relatively similar. The choice of the thresholds separating qualitative classes for particular 478
criteria was adapted here so as to minimise this risk. 479
480
5. Conclusion
481
Assessing the relevance of innovations, such as CA, remains a difficult exercise, because 482
several objectives, some of which conflict, and criteria of different natures must be taken into 483
account. Multicriteria decision aid models, such as MASC®, have been developed to 484
overcome these apparent difficulties by providing a holistic approach to the problem based 485
on an assessment of the sustainability of cropping systems. The use of this model in the 486
French context provides a more comprehensive assessment of the various performances of 487
CA, through comparisons with conventional systems and intermediate systems in which the 488
principles of CA are applied only partially. The results obtained thus provide a better 489
perception of the overall relevance of CA and improve our understanding of the principles 490
contributing to the desired effect. 491
Firstly, the results of this study indicate that CA is a promising alternative to conventional 492
practices that can improve the sustainability of cropping systems in France, provided that it is 493
applied in full. Secondly, a detailed analysis of intermediate systems partially applying the 494
principles of CA revealed that there was a positive interaction between the reduction of tillage 495
and the diversification of the crop rotation for the environmental dimension. However, 496
diversification of the crop rotation was found to be the best way to increase the overall 497
sustainability of cropping systems. Cropping systems involving diversified rotations achieved 498
good results, regardless of the tillage regime, whereas direct seeding-based systems not 499
coupled with a diversified rotation had the lowest sustainability scores. Thus, decreasing soil 500
21 tillage appeared to be less effective in this study than diversifying the crop rotation, and 501
should therefore not be applied in isolation. 502
According to these findings, CA, as a holistic package, is an interesting way to improve the 503
sustainability of agricultural systems in the French context. However, when this strategy is 504
preferred, the social and agronomic difficulties reported in this study should be taken into 505
account. A gradual transition from ploughed conventional systems towards CA systems 506
should be encouraged, with the early consideration of a specific cover crop management 507
strategy involving crops from different families. Finally, the results of this study require 508
confirmation and completion with field measurements, for a larger number of more diverse 509
cropping systems, with the evaluation of CA over larger scales (the farm and regional 510
scales). Furthermore, the validity of our findings could not be easily extended to areas where 511
AC is more widespread and where the conditions of soil and climate, including drought 512
intensity and frequency, are different from those of Western Europe. 513
514
Acknowlegements
515
The authors would like to thank Ms N. Landé (CETIOM), J. Peigné (ISARA), N. Torrès 516
(Vivescia), M.M. F Hirissou (Chambre d’Agriculture de la Dordogne) and B. Omon (Chambre 517
d’Agriculture de l’Eure) for providing them with data for this analysis. 518
This work was carried out with the financial support of the ANR- Agence Nationale de la 519
Recherche (The French National Research Agency) under the Programme national de
520
recherches écoSystèmes, Territoires, Ressources vivantes et agricultures (Systerra) project
521
ANR-08-STRA-10, PEPITES. 522
References
523
Bell, S., Morse, S., 2008. Sustainability Indicators: Measuring the Immeasurable? Second 524
ed. Earthscan, London, Stering, VA. 525
22 Bergez, J.É., 2013. Using a genetic algorithm to define worst-best and best-worst options of 526
a DEXi-type model: Application to the MASC model of cropping-system sustainability. 527
Comput. Electron. Agric. 90, 93–98. doi:10.1016/j.compag.2012.08.010
528
Bohanec, M., 2014. DEXi: Program for multicriteria decision making, User's manual, Version 529
4.0. IJS Report DP-113401134011340, Jožef Stefan Institute, Ljubljana. 530
http://kt.ijs.si/MarkoBohanec/pub/DEXiManual400DEXiManual400DEXiManual400.pdf
531
Bockstaller, C., Girardin, P., van der Werf, H.M., 1997. Use of agro-ecological indicators for 532
the evaluation of farming systems. Eur. J. Agron 7, 261–270.
doi:10.1016/S1161-533
0301(97)00041-5
534
Bockstaller, C., Girardin, P., 2003. How to validate environmental indicators. Agric. Syst. 76, 535
639–653. doi:10.1016/S0308-521X(02)00053-7
536
Bockstaller, C., Guichard, L., Keichinger, O., Girardin, P., Galan, M.-B., Gaillard, G., 2009. 537
Comparison of methods to assess the sustainability of agricultural systems. A review. Agron. 538
Sustain. Dev. 29, 223-235. doi:10.1051/agro:2008058
539
Calegari, A., Hargrove, W. L., Dos Santos Rheinheimer, D., Ralisch, R., Tessier, D., de 540
Tourdonnet, S., de Fatima Guimaraes, M., 2008. Impact of long-term no-tillage and cropping 541
system management on soil organic carbon in an oxisol: a model for sustainability. Agron. J. 542
100, 1013-1019. doi:10.2134/agronj2007.0121
543
Carpani, M., Bergez, J.É., Monod, H., 2012. Sensitivity analysis of a hierarchical qualitative 544
model for sustainability assessment of cropping systems. Environ. Model. Softw. 27–28, 15– 545
22. doi:10.1016/j.envsoft.2011.10.002
546
Chapelle-Barry, C., 2008. Dans le sillon du non-labour. Agreste Primeur, 207. 547
http://www.agreste.agriculture.gouv.fr/IMG/pdf/primeur207.pdf (accessed 01.04.14). 548
Colomb, B., Carof, M., Aveline, A., Bergez, J.É., 2012. Stockless organic farming: strengths 549
and weaknesses evidenced by a multicriteria sustainability assessment model. Agron. 550
Sustain. Dev. 33, 593-608. doi: 10.1007/s13593-012-0126-5
551
Craheix, D., Angevin, F., Bergez, J.É., Bockstaller, C., Colomb, B., Guichard, L., Reau, R., 552
Doré, T., 2012a. MASC 2.0, un outil d’évaluation multicritère pour estimer la contribution des 553
systèmes de culture au développement durable. Innov. Agron. 20, 35–48. 554
http://www.inra.fr/ciag/revue/volume_20_juillet_2012 (accessed 15.10.12). 555
Craheix, D., Angevin, F., Bergez, J.É., Bockstaller, C., Colomb, B., Guichard, L., Reau, R., 556
Omon B., Doré, T., 2012b Multicriteria assessment of the sustainability of cropping systems: 557
A case study of farmer involvement using the MASC model, in: Proceedings of the 10th 558
European IFSA Symposium, 1-4 July 2012, Aarhus, Denmark. 559
23
http://ifsa.boku.ac.at/cms/fileadmin/Proceeding2012/IFSA2012_WS6.4_Craheix.pdf
560
Craheix, D., Angevin, F., Reau, R., Bergez, J. É., Bockstaller, C., Doré, T., Guichard, L., 561
Colomb, B., 2012c. MASC, a model to assess the sustainability of cropping systems: Taking 562
advantage of feedback from first users, in: Proceedings of the XIIth congress of the European 563
Society for Agronomy, 20-24 August 2012, Helsinki, Finland. 282-283. 564
Debaeke, P., Orlando, D., 1994. Simplification du travail du sol et évolution de la flore 565
adventice : conséquences pour le désherbage a l'échelle de la rotation in: INRA (Eds.), 566
Simplification du travail du sol, Colloques de l'INRA (65), Paris, pp. 35-62. 567
Derpsch, R., 2003. Conservation Tillage, No-Tillage and Related Technologies, in: García-568
Torres, L., Benites, J., Martínez-Vilela, A., Holgado-Cabrera, A. (Eds.), Conservation 569
Agriculture. Springer Netherlands, pp. 181–190. 570
Dumanski, J., Pettapiece, W.W., McGregor, R.J., 1998. Relevance of scale-dependent 571
approaches for integrating biophysical and socio-economic information and development of 572
agroecological indicators. Nutr. Cycl. Agroecosyst. 50, 13-22. 573
Emmerling, C., 2001. Response of earthworm communities to different types of soil tillage. 574
Appl. Soil Ecol. 17, 91–96. doi:10.1016/S0929-1393(00)00132-3
575
Erenstein, O., 2003. Smallholder conservation farming in the tropics and sub-tropics: a guide 576
to the development and dissemination of mulching with crop residues and cover crops. Agric. 577
Ecosyst. Environ. 100, 17–37. doi:10.1016/S0167-8809(03)00150-6
578
Figueira, J., Greco, S., Ehrgott, M., 2005. (Eds.) Multiple Criteria Decision Analysis: State of 579
the Art Surveys, Springer-Verlag, New York. 580
Frielinghaus, M., 2007. Soil Erosion and Pesticide Translocation Control, in: Pimentel, D. 581
(Ed.) Encyclopedia of Pest Management. Taylor and Francis, New York, pp. 777–780. 582
FAO, 2008. Investing in Sustainable Agricultural Intensification. The Role of Conservation 583
Agriculture. A Framework for Action. Food and Agriculture Organisation of the United 584
Nations, Rome. http://www.fao.org/ag/ca/doc/proposed_framework.pdf
585
Glen, D.M. and Sysmondson, W.O.C. 2003. Influence of soil tillage on slugs and their natural 586
enemies. In: El Titi, A. (Ed.), Soil tillage in Agroecosystems, CRC Press, Boca Raton, FL, pp. 587
207–227. 588
Giller, K.E., Witter, E., Corbeels, M., Tittonell, P., 2009. Conservation agriculture and 589
smallholder farming in Africa: The heretics’ view. Field Crops Res.114, 23–34. 590
doi:10.1016/j.fcr.2009.06.017
591
Giller, K.E., Corbeels, M., Nyamangara, J., Triomphe, B., Affholder, F., Scopel, E., Tittonell, 592
24 P., 2011. A research agenda to explore the role of conservation agriculture in African 593
smallholder farming systems. Field Crops Res. 124, 468–472. doi:10.1016/j.fcr.2011.04.010 594
Gravesen, L., 2003. The Treatment frequency index – An Indicator for pesticide use and 595
dependency as well as overall load on the environment. In: Proceedings of the PURE 596
Conference, Reducing pesticide dependency in Europe to protect health, environment and 597
biodiversity, 20 November 2003, Copenhagen, Denmark, 28-30.
http://pan-598
europe.info/old/Archive/conferences/pure2003.pdf
599
Hobbs, P.R., 2007. Conservation agriculture: what is it and why is it important for future 600
sustainable food production? J. Agric. Sci. 145. 127-137.
601
http://dx.doi.org/10.1017/S0021859607006892
602
Hobbs, P.R., Sayre, K., Gupta, R., 2008. The role of conservation agriculture in sustainable 603
agriculture. Phil. Trans. R. Soc. B. 363, 543–555. 604
Holland, J.M., 2004. The environmental consequences of adopting conservation tillage in 605
Europe: reviewing the evidence. Agric. Ecosyst. Environ. 103, 1–25. 606
doi:10.1016/j.agee.2003.12.018
607
Ikerd, J.E., 1993. The need for a system approach to sustainable agriculture. Agric. Ecosyst. 608
Environ.46, 147–160. doi:10.1016/0167-8809(93)90020-P
609
Knowler, D., Bradshaw, B., 2007. Farmers’ adoption of conservation agriculture: A review 610
and synthesis of recent research. Food Policy 32, 25–48. doi:10.1016/j.foodpol.2006.01.003
611
Kreye H., 2004. Effects of conservation tillage on harmful organisms and yield of oilseed 612
rape. Bulletin OILB/SROP 27, 25 – 29. 613
Lahmar, R., 2010. Adoption of conservation agriculture in Europe: Lessons of the KASSA 614
project. Land Use Policy 27, 4–10. doi: 10.1016/j.landusepol.2008.02.001
615
Lapar, M.L.A., Pandey, S., 1999. Adoption of soil conservation: the case of the Philippine 616
uplands. Agric. Econ. 21, 241–256. 617
Lestrelin, G., Quoc, H.T., Jullien, F., Rattanatray, B., Khamxaykhay, C., Tivet, F., 2012. 618
Conservation agriculture in Laos: diffusion and determinants for adoption of direct seeding 619
mulch-based cropping systems in smallholder agriculture. Renew. Agric. Food Syst. 27, 81– 620
92. http://dx.doi.org/10.1017/S174217051100055X
621
Ma, L., 2006. Knowledge representation under Inherent uncertainty in a multi-agent system 622
for land use planning, Ph.D. Thesis, Eindhoven University of Technology, Eindhoven, The 623
Netherlands, 164p. 624
Médiène, S., Valantin-Morison, M., Sarthou, J.-P., Tourdonnet, S., Gosme, M., Bertrand, M., 625
25 Roger-Estrade, J., Aubertot, J.-N., Rusch, A., Motisi, N., Pelosi, C., Doré, T., 2011. 626
Agroecosystem management and biotic interactions: a review. Agron. Sustain. Dev. 31, 491– 627
514. doi:10.1007/s13593-011-0009-1
628
Munda, G., 2005. Multiple Criteria Decision Analysis and Sustainable Development, in: 629
Greco, S. (Ed.), Multiple Criteria Decision Analysis: State of the Art Surveys, Springer New 630
York, pp. 953–986. 631
Palm, C., Blanco-Canqui, H., DeClerck, F., Gatere, L., Grace, P., 2014. Conservation 632
agriculture and ecosystem services: An overview. Agric. Ecosyst. Environ. 187, 87-105. 633
Peigné, J., Cannavacciuolo, M., Gautronneau, Y., Aveline, A., Giteau, J.L., Cluzeau, D., 634
2009. Earthworm populations under different tillage systems in organic farming. Soil Tillage 635
Res. 104, 207-214. doi:10.1016/j.still.2009.02.011 636
Pelzer, E., Fortino, G., Bockstaller, C., Angevin, F., Lamine, C., Moonen, C., Vasileiadis, V., 637
Guérin, D., Guichard, L., Reau, R., Messéan, A., 2012. Assessing innovative cropping 638
systems with DEXiPM, a qualitative multicriteria assessment tool derived from DEXi. Ecol. 639
Indic. 18, 171–182. doi:10.1016/j.ecolind.2011.11.019
640
Sadok, W., Angevin, F., Bergez, J.-É., Bockstaller, C., Colomb, B., Guichard, L., Reau, R., 641
Doré, T., 2008. Ex ante assessment of the sustainability of alternative cropping systems: 642
implications for using multicriteria decision-aid methods. A review. Agron. Sustain. Dev. 28, 643
163–174. doi:10.1051/agro:2007043
644
Sadok, W., Angevin, F., Bergez, J.-É, Bockstaller, C., Colomb, B., Guichard, L., Reau, R., 645
Messéan, A., Doré, T., 2009. MASC, a qualitative multi-attribute decision model for ex ante 646
assessment of the sustainability of cropping systems. Agron. Sustain. Dev. 29, 447–461. doi
647
10.1051/agro/2009006
648
Scopel, E., Triomphe, B., Affholder, F., Silva, F.A.M., Corbeels, M., Xavier, J.H.V., Lahmar, 649
R., Recous, S., Bernoux, M., Blanchart, E., Mendes, I., Tourdonnet, S., 2013. Conservation 650
agriculture cropping systems in temperate and tropical conditions, performances and 651
impacts. Agron. Sustain. Dev. 33, 113–130. doi: 10.1007/s13593-012-0106-9
652
Sebillotte, M., 1990. Système de culture, un concept opératoire pour les agronomes, in: 653
Lacombe, L., Picard, D. (Eds.), Un Point Sur Les Systèmes de Culture. INRA Éditions Paris, 654
pp. 165–190. 655
Serpantié, G., 2009. L'agriculture de conservation à la croisée des chemins en Afrique et à 656
Madagascar. Vertigo 9(3) 12. https://vertigo.revues.org/9290 657
Symondson, W.O.C, Glen, D.M., Wiltshire, C.W., Langdon, C.J., Liddell, J.E. 1996. Effects of 658
cultivation techniques and methods of straw disposal on predation by Pterostichus 659
26
melanarius (Coleoptera: Carabidae) upon slugs (Gastropoda: Pulmonata) in an arable field.
660
J. Appl. Ecol. 33, 741 – 753. doi:10.2307/2404945
661
Sturz, A.V., Carter, M.R., Johnston, H.W., 1997. A review of plant disease, pathogen 662
interactions and microbial antagonism under conservation tillage in temperate humid 663
agriculture. Soil Tillage Res. 41-42, 169–189. doi:10.1016/S0167-1987(96)01095-1
664
Tilman, D., Cassman, K.G., Matson, P.A., Naylor, R., Polasky, S., 2002. Agricultural 665
sustainability and intensive production practices. Nature 418, 671–677. 666
doi:10.1038/nature01014
667
United Nations - Department for Policy Coordination and Sustainable Development, 1996. 668
Indicators of Sustainable Development, Frameworks and Methodologies, United Nations 669
New York. 670
Vian, J.F., Peigné, J., Chaussod, R., Estrade, J.R., 2009. Comparison of four tillage systems 671
in organic farming. Effect of soil structure modification and organic matter repartition on 672
microbial biomass and soil respiration. IOBC/WPRS Bulletin 42, 191-194. 673
27
Table captions
Table 1: Methods for evaluating the basic criteria of the economic and social dimensions of the MASC model: QT - indicators based on quantitative and calculated data; QL - indicators based on expert evaluation through the use of qualitative information; ST - indicators based on a subtree design, using DEXi software to combine qualitative expertise and quantitative data through calculation. For these indicators, weights (expressed in %) are assigned to the factors considered.
Table 2: Methods for evaluating basic criteria for the environmental dimension of the MASC model: QT - indicators based on quantitative and calculated data; QL - indicators based on expert evaluation through the use qualitative information; ST - indicators based on a subtree design, using DEXi software to combine qualitative expertise and quantitative data through calculation. For these indicators, weights (expressed in %) are assigned to each of the factors considered.
Table 3: Simplified presentation of the cropping systems studied in each region. Each line of this table corresponds to the description of one of the 31 cropping systems assessed. A code is assigned to each cropping system to specify its affiliation a given type (DS: direct seeding, RT: reduced tillage, PL: frequent use of ploughing, LC: Low diversification of crop rotations, HC: High diversification of crop rotations). For the cultivated crops: AFA alfalfa, FAB faba bean, FES fescue, HP hemp, FF fibre flax, MAG grain maize, MAS silage maize, OR oilseed rape, SBEET sugarbeet, SOY soybean, SPEA spring pea, SUN sunflower, TRIT triticale, WB winter barley, WPEA winter pea, WW winter wheat. The cover crops are indicated in brackets: (Must.) mustard, (mgl) mixture of grass and legumes, (b.wheat) buckwheat, (fab) faba bean, (oat) oat, (rye) rye. For the origin of the observations: F on-farm observations, S for observations at experimental stations.