ORIGINAL ARTICLE
Diagnostic performance of ethyl glucuronide in hair
for the investigation of alcohol drinking behavior:
a comparison with traditional biomarkers
Hicham Kharbouche&Mohamed Faouzi&Nathalie Sanchez&Jean Bernard Daeppen&
Marc Augsburger&Patrice Mangin&Christian Staub&Frank Sporkert
Received: 23 June 2011 / Accepted: 31 August 2011 / Published online: 11 September 2011 # Springer-Verlag 2011
Abstract
Background Ethyl glucuronide (EtG) in hair has emerged as a useful biomarker for detecting alcohol abuse and monitoring abstinence. However, there is a need to establish a reliable cutoff value for the detection of chronic and excessive alcohol consumption.
Methods One hundred and twenty-five subjects were classi-fied as teetotalers, low-risk drinkers, at-risk drinkers, or heavy drinkers. The gold standard for subjects' classifications was based on a prospective daily alcohol self-monitoring log. Subjects were followed for a 3-month period. The EtG diagnostic performance was evaluated and compared with carbohydrate-deficient transferring (CDT) and the activities of aspartate aminotransferase, alanine aminotransferase, and γ-glutamyl-transferase (γGT).
Results A cutoff of >9 pg/mg EtG in hair, suggesting an alcohol consumption of >20/30 g (at-risk drinkers), and a cutoff of >25 pg/mg, suggesting a consumption of >60 g (heavy drinkers), were determined by receiver operating characteristic analysis. The EtG diagnostic performance was significantly better (P<0.05) than any of the traditional biomarkers alone. EtG, as a single biomarker, yielded a stronger or similar diagnostic performance in detecting at-risk or heavy drinkers, respectively, than the best combination of traditional biomarkers (CDT andγGT). The combination of EtG with traditional biomarkers did not improve the
diagnos-tic performance of EtG alone. EtG demonstrated a strong potential to identify heavy alcohol consumption, whereas the traditional biomarkers failed to do so. EtG was not signifi-cantly influenced by gender, body mass index, or age. Conclusion Hair EtG definitively provides an accurate and reliable diagnostic test for detecting chronic and excessive alcohol consumption. The proposed cutoff values can serve as reference for future cutoff recommendations for clinical and forensic use.
Keywords Alcohol consumption . Cutoff . Diagnostic performance . Ethyl glucuronide . Alcohol biomarkers
Abbreviations
ASAT Aspartate aminotransferase ALAT Alanine aminotransferase γGT γ-Glutamyl-transferase
CDT Carbohydrate-deficient transferring EtG Ethyl glucuronide
DASM log Daily Alcohol Self-monitoring log GC-MS/MS Gas chromatography-tandem
mass spectrometry LOQ Limit of quantification
ROC Receiver operating characteristic AUROC Area under the ROC curve BMI Body mass index
OR Odds ratio
CI Confidence interval
Introduction
Chronic and excessive alcohol consumption is recognized as a major public health concern. In Western Europe, it is estimated that 20% of the population have chronic and
H. Kharbouche
:
M. Augsburger:
P. Mangin:
C. Staub:
F. Sporkert (*)
University Center of Legal Medicine, Lausanne–Geneva,
rue du Bugnon 21, 1011 Lausanne, Switzerland e-mail: [email protected]
M. Faouzi
:
N. Sanchez:
J. B. DaeppenAlcohol Treatment Center, Lausanne University Hospital CHUV, 1011 Lausanne, Switzerland
excessive alcohol consumption, including drinkers catego-rized as at-risk and heavy drinkers. At-risk alcohol consumption (>20/30 g/day) is associated with a significant increased risk of disease and premature mortality, and it imposes a considerable social and economic burden [1,2]. The early detection of at-risk alcohol consumption is of particular importance to help reduce alcohol-related injury. The diagnostic value of the traditional and indirect biomarkers aspartate aminotransferase (ASAT), alanine aminotransferase (ALAT), γ-glutamyl-transferase (γGT), and carbohydrate-deficient transferring (CDT) is often limited by their lack of sensitivity and/or specificity, as increased values can be due to numerous other non-alcoholic disorders [3–5]. A combination of traditional biomarkers is thus recommended to improve the diagnosis [3,6–10].
Ethyl glucuronide (EtG) is a promising biomarker of alcohol consumption. In contrast to traditional biomarkers, EtG is a direct metabolite of ethanol that is exclusively produced in vivo following alcohol consumption. EtG is incorporated into hair, which makes its analysis an effective and non-invasive method to monitor retrospective alcohol consumption over a long period of time (weeks/months). Several studies have investigated the potential of hair EtG as a marker of alcohol consumption [11–16]. Overall, EtG was not detected in the hair of teetotalers. Heavy drinkers (>60 g/day) displayed considerably higher hair EtG concentrations than the so-called social drinkers (≤60 g/day). In addition, the levels of hair EtG seemed to reflect the average daily amount of alcohol ingested [17,18].
Various cutoff values (4, 23, 25, 30, and 50 pg/mg) have been proposed to detect chronic and excessive alcohol drinkers [14, 17, 19–21]. Despite the >30-pg/mg cutoff consensus of the Society of Hair Testing (SoHT) from 2009 for heavy drinkers [22], there is no general agreement regarding the cutoff values that should be used.
A study conducted with 154 persons in a driving ability assessment used cutoff values of >7 pg/mg for social drinking between 20 and 40 gethanol/day and >30 pg/mg for heavy drinking (>60 g/day) [23]. Hair EtG concentrations were compared with the plasma %CDT. In contrast to 53 persons tested with hair EtG >30 pg/mg, CDT was detected above the routinely used upper limit in 15 cases only.
Only one retrospective study based on self-reports integrated statistical components in order to validate the performance of EtG in hair [24]. Twenty-seven picograms per milligram has been proposed as cutoff value to identify heavy drinkers with a sensitivity of 0.92 and a specificity of 0.96.
A recently published Swedish study measured EtG in hair after the controlled daily ethanol consumption of 16 g (14 female volunteers) or 32 g (7 male volunteers) of over a 3-month period [25]. EtG could be detected in the hair of six from seven volunteers with a consumption of 32 g/day
and in lower concentrations in 6 of 14 cases with a consumption of 16 g/day. They concluded that EtG determination in hair can not totally exclude minor daily alcohol consumption and lacks sensitivity for the purpose of monitoring total abstinence.
An inaccurate estimation of alcohol consumption may lead to a misclassification of a subject and to unreliable cutoff values. The choice of a gold standard is thus a key element to ensure the validity of results. The assessment of alcohol consumption relies on either retrospective or prospective methods. Retrospective methods have been associated with a lack of compliance and missing data due to the need for subjects to recall alcohol consumption over extended periods [26]. Prospective alcohol self-monitoring logs represent a superior alternative to retrospective, self-reported methods. They allow the subject to collect more accurate alcohol consumption data on a daily or a drink-by-drink basis and do not require that subjects recall their alcohol consumption [27, 28]. To our knowledge, there have been no studies evaluating the diagnostic performance of hair EtG using a prospective, self-monitoring method as a gold standard.
The main objective of this prospective study was to assess the relevance of hair EtG as a marker of alcohol consumption in a well-characterized population. For this purpose, reliable cutoff values to identify chronic and excessive alcohol consumption were determined using statistical analyses. The diagnostic performance of hair EtG was evaluated and compared with traditional bio-markers alone, or in combination. Finally, the influence of intrinsic factors on the diagnostic performance of hair EtG was studied.
Materials and methods
Study population
This prospective study was conducted between March 2009 and June 2010 over a 3-month test period at the University Center of Legal Medicine, Lausanne. One hundred and forty subjects were recruited by advertisement in the local newspapers and by posters displayed in public places. Eligible subjects were above 18 years old, not pregnant, and with no cognitive impairment. Subjects with intrave-nous drug abuse were not authorized to participate in this study. Of the 140 subjects, ten did not meet the eligibility criteria, and five withdrew from the study. Full data were obtained from 125 subjects (69 women, 56 men) who completed the study. All participants provided written informed consent before enrollment. The study protocol was approved by the Clinical Research Ethics Committee of the University of Lausanne.
Daily alcohol self-monitoring log
The subjects' daily alcohol consumption was estimated using a Daily Alcohol Self-Monitoring log (DASM log) recorded over the 3-month study period. They were requested to report their alcohol consumption on a day-by-day basis using weekly calendars. The DASM log allowed to collect prospectively detailed quantitative and qualitative information about number, volume, frequency, and type of drinks (categorized as beer, wine, fortified wine, and spirit) consumed each day. The mean daily alcohol consumption (grams per day) was calculated based on alcohol content, reported volume, and frequency of drinking. Beer, wine, fortified wine, and spirit alcohol contents were defined as 5%, 12%, 20%, and 40% (v/v), respectively.
Identification of subjects' alcohol consumption profile
Subjects were classified into three categories (teetotaler, low-risk, and at-risk drinkers) based on the results from the DASM log. Teetotalers were defined as subjects who declared total abstinence from alcohol consumption (0 g/day) during the last 12 months. Low-risk drinkers were defined as subjects who consumed≤20 g/day for women and ≤30 g/day for men. At-risk drinkers were defined as subjects who consumed >20 g/day for women and >30 g/day for men. These thresholds are based on WHO recommendations. To allow a direct comparison of our findings with results reported in the literature, subjects with an alcohol consumption of >60 g/day for both men and women were also classified and were referred to as heavy drinkers.
Study design
Subjects were required to attend three visits: at weeks 0, 6, and 12. The first interview consisted of introducing the purpose and design of the study. Information, including gender, age, body weight, body height, hair natural color, and hair cosmetic treatment, was collected. The DASM log was explained and handed out to each subject. Subjects were asked to complete and return the DASM log every week over the study period. Blood samples were taken at all visits, and hair at the first and the last one. The DASM logs were checked at week 6 and the end of the protocol.
Blood and hair collection
Blood samples were collected in Sarstedt S-Monovette® Serum Gel tubes, which were immediately centrifuged. Two milliliters of serum were separated and stored at−20°C until analysis. Hair samples were collected from the vertex posterior region, as close as possible to the skin. The 3-cm proximal hair segment, representing approximately 3 months
of growth [29], was used for EtG analysis. Hair samples were stored dry and kept away from light at room temperature until analysis.
Serum and hair analysis
Traditional biomarkers (ASAT, ALAT,γGT, and CDT) were analyzed in all serum samples. ASAT, ALAT, andγGT were measured by immunoassay on a Dimension® Xpand® Plus clinical chemistry system (Siemens). CDT was analyzed by capillary zone electrophoresis, equipped with a UV detector set at 210 nm, using a commercial assay kit (CEofix™ CDT, Analis). CDT was expressed as the percent of asialo- plus disialo-transferrin isoforms in total transferrin.
Hair EtG was analyzed using a fully validated gas chromatography-tandem mass spectrometry (GC-MS/MS) method [30]. The limit of detection and the limit of quantification (LOQ) were 2 and 4 pg/mg hair, respectively.
Data analysis
Statistical analyses were performed using STATA® version 11 and R version 2.9.2 software. Mean, standard deviation, median, and interquartile range (25–75%) were used as descriptive statistics. Continuous variables were compared using the Kruskal–Wallis test and the Mann–Whitney U test (one-tailed); categorical variables were compared using the χ2
test (two-tailed). The diagnostic performance of EtG, ASAT, ALAT, γGT, and CDT (sensitivity, specificity, positive predictive value, and negative predictive value) was calculated for the optimal cutoff values selected from the receiver operating characteristic (ROC) curves (i.e., the value on the ROC curve farthest from the diagonal line [chance] optimizing both sensitivity and specificity). The diagnostic performance of each test was compared using the area under the ROC curves (AUROC). An AUROC closer to 1 indicated a better diagnostic test, while an AUROC of 0.5 indicated no diagnostic ability. Univariate logistic regression analysis was performed to evaluate the independent effects of age, gender, and BMI on the EtG diagnostic performance, expressed as an odds ratio (OR). Multivariate logistic regression analysis was performed to determine the combination among the five biomarkers that could best predict excessive alcohol consumption. P<0.05 was considered statistically significant.
Results
Descriptive results
One hundred and twenty-five subjects were classified according to their self-reported alcohol consumption. The
demographic and reported alcohol intake characteristics and biomarker levels are presented in Table 1. Forty-three subjects did not report any alcohol consumption, 44 subjects reported an alcohol consumption ≤20/30 g/day (women/men), and 38 subjects reported an alcohol con-sumption >20/30 g/day (women/men). Twenty-one subjects had an alcohol consumption >60 g/day. There were no significant differences in age and BMI, whereas significant differences were noted in gender between the three groups. Women were less likely than men to report at-risk consumption.
The median EtG concentration varied among the groups and was significantly higher in at-risk drinkers than in low-risk drinkers (Mann–Whitney U test, P<0.001). The median values of γGT and CDT were also significantly higher in at-risk drinkers than in low-risk drinkers (Mann–Whitney
U test, P<0.001). This difference, though significant, was less apparent with the median values of ASAT and ALAT (Mann–Whitney U test, P<0.05). Heavy drinkers showed significantly higher EtG, ASAT, ALAT,γGT, and CDT levels than the subjects who consumed≤60 g/day (Mann–Whitney U test, P<0.001). Notably, significantly elevated biomarker values were observed in heavy drinkers, as compared with at-risk drinkers (Mann–Whitney U test, P<0.01).
Determination of optimal cutoff values and diagnostic performance of EtG
Table2lists the EtG diagnostic performance for each optimal cutoff value. ROC analyses were performed to determine the optimal EtG cutoff value, to allow distinguishing at-risk drinkers from the others. The optimal cutoff value was set at
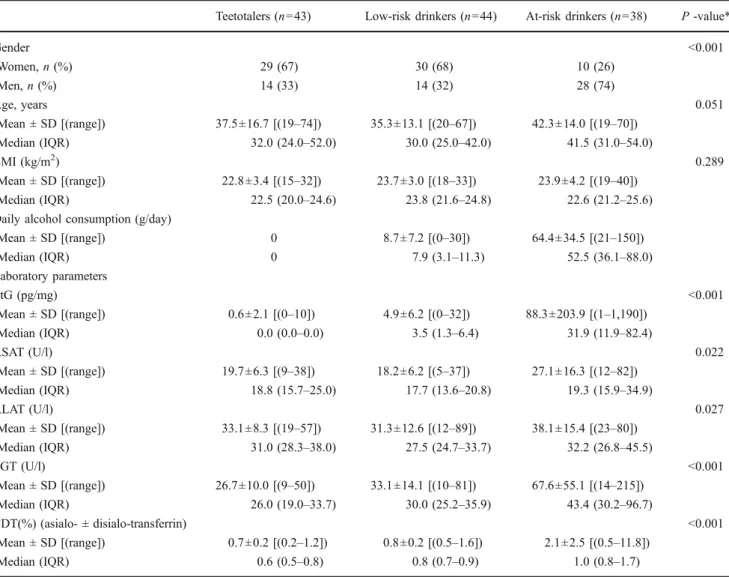
Table 1 Demographic and alcohol intake characteristics and biomarker levels (EtG measured in hair; ASAT, ALAT, GGT, and CDT measured in plasma) for 125 subjects classified according to their self-reported alcohol consumption
Teetotalers (n=43) Low-risk drinkers (n=44) At-risk drinkers (n=38) P -value*
Gender <0.001 Women, n (%) 29 (67) 30 (68) 10 (26) Men, n (%) 14 (33) 14 (32) 28 (74) Age, years 0.051 Mean ± SD [(range]) 37.5±16.7 [(19–74]) 35.3±13.1 [(20–67]) 42.3±14.0 [(19–70]) Median (IQR) 32.0 (24.0–52.0) 30.0 (25.0–42.0) 41.5 (31.0–54.0) BMI (kg/m2) 0.289 Mean ± SD [(range]) 22.8±3.4 [(15–32]) 23.7±3.0 [(18–33]) 23.9±4.2 [(19–40]) Median (IQR) 22.5 (20.0–24.6) 23.8 (21.6–24.8) 22.6 (21.2–25.6)
Daily alcohol consumption (g/day)
Mean ± SD [(range]) 0 8.7±7.2 [(0–30]) 64.4±34.5 [(21–150]) Median (IQR) 0 7.9 (3.1–11.3) 52.5 (36.1–88.0) Laboratory parameters EtG (pg/mg) <0.001 Mean ± SD [(range]) 0.6±2.1 [(0–10]) 4.9±6.2 [(0–32]) 88.3±203.9 [(1–1,190]) Median (IQR) 0.0 (0.0–0.0) 3.5 (1.3–6.4) 31.9 (11.9–82.4) ASAT (U/l) 0.022 Mean ± SD [(range]) 19.7±6.3 [(9–38]) 18.2±6.2 [(5–37]) 27.1±16.3 [(12–82]) Median (IQR) 18.8 (15.7–25.0) 17.7 (13.6–20.8) 19.3 (15.9–34.9) ALAT (U/l) 0.027 Mean ± SD [(range]) 33.1±8.3 [(19–57]) 31.3±12.6 [(12–89]) 38.1±15.4 [(23–80]) Median (IQR) 31.0 (28.3–38.0) 27.5 (24.7–33.7) 32.2 (26.8–45.5) γGT (U/l) <0.001 Mean ± SD [(range]) 26.7±10.0 [(9–50]) 33.1±14.1 [(10–81]) 67.6±55.1 [(14–215]) Median (IQR) 26.0 (19.0–33.7) 30.0 (25.2–35.9) 43.4 (30.2–96.7) CDT(%) (asialo- ± disialo-transferrin) <0.001 Mean ± SD [(range]) 0.7±0.2 [(0.2–1.2]) 0.8±0.2 [(0.5–1.6]) 2.1±2.5 [(0.5–11.8]) Median (IQR) 0.6 (0.5–0.8) 0.8 (0.7–0.9) 1.0 (0.8–1.7)
ASAT aspartate aminotransferase; ALAT alanine aminotransferase;γGT γ-glutamyl transferase; CDT carbohydrate-deficient transferring; IQR
interquartile range
>9 pg/mg. Based on this cutoff, the sensitivity of EtG was 0.82 (31 out of 38 at-risk drinkers were correctly classified), and the specificity was 0.93 (6 out of 87 subjects were misdiagnosed as at-risk drinkers). The positive and negative predictive values were 0.84 and 0.92, respectively, meaning that the probability for a subject with an EtG concentration of >9 pg/mg to be an at-risk drinker was 84%, and the probability for a subject with an EtG concentration of≤9 pg/mg to be a low-risk drinker was 92%. This cutoff value is thus proposed as a good indicator of at-risk drinking. The optimal cutoff value for detecting heavy drinkers was set at >25 pg/mg (>60 g/day versus the others). EtG had a better diagnostic performance in detecting heavy drinkers than at-risk drinkers, with a false negative rate of 5% and a false positive rate of 3%. Low-risk drinkers showed in 58% of the cases EtG concen-trations lower than the LOQ of the applied analytical method of 4 pg/mg. A reliable differentiation between teetotalers and low-risk drinkers was therefore not possible. A gain in the sensitivity of the analytical method may allow a distinction between these groups.
Comparison of diagnostic performances
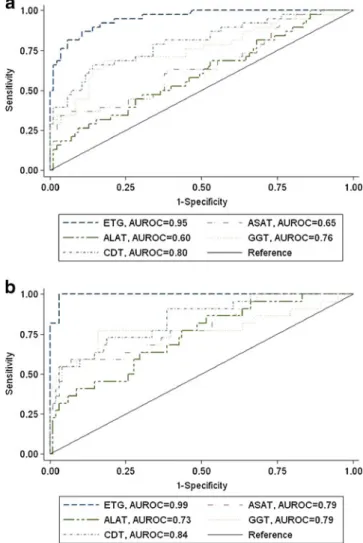
The AUROC of each biomarker is represented in Fig.1. EtG, ASAT, ALAT, γGT, and CDT had AUROC values greater than 0.5, where 0.5 indicates an ineffective test. The EtG diagnostic performance was significantly higher than the traditional biomarkers (P<0.0001). EtG showed the largest AUROC (0.95; 95% CI, 0.92–0.99) value, followed by CDT (0.80; 95% CI, 0.71–0.89), γGT (0.76; 95% CI, 0.66–0.86), ASAT (0.65; 95% CI, 0.54–0.76), and ALAT (0.60; 95% CI, 0.49–0.71). The diagnostic performance of each biomarker for the detection of heavy drinkers was also evaluated. All of the biomarkers were better predictors of heavy than of at-risk alcohol consumption (EtG, 0.99; 95% CI, 0.98–1.00; CDT, 0.84; 95% CI, 0.75–0.93; γGT, 0.79; 95% CI, 0.65–0.93; ASAT, 0.79; 95% CI, 0.68–0.90; ALAT, 0.73; 95% CI, 0.62–0.85). The AUROC value for EtG was significantly higher than that of the other traditional biomarkers (P<0.001).
Diagnostic performance of combined biomarkers
EtG, as a single biomarker, yielded a similar diagnostic discriminatory ability in detecting at-risk drinkers as the
Table 2 The diagnostic perfor-mance of ethyl glucuronide in detecting abstinence, at-risk alcohol consumption, and heavy alcohol consumption
PPV positive predictive value; NPV negative predictive value; CI confidence interval
Daily alcohol consumption (g/day)
0 >20/30 >60
Teetotalers vs. others At-risk drinkers vs. others Heavy drinkers vs. others
AUC (95% CI) 0.95 (0.91–0.99) 0.95 (0.92–0.99) 0.99 (0.98–1.00) Cutoff (EtG, pg/mg) 0 >9 >25 Sensitivity 0.93 0.82 0.95 Specificity 0.94 0.93 0.97 PPV 0.89 0.84 0.88 NPV 0.96 0.92 0.99
Fig. 1 A comparison of the diagnostic performance of ethyl
glucuronide in detecting (a) at–risk alcohol consumption (>20/30 g/day;
women/men) or (b) heavy alcohol consumption (>60 g/day; women and
men) with traditional biomarkers (CDT,γGT, ASAT, and ALAT) using
ROC curve analysis. AUROC, area under the receiver operating characteristics curve
best EtG-included biomarker combination, which used EtG, ALAT, and γGT. The AUROC value of this combination was 0.96 (95% CI, 0.93–0.99), whereas the AUROC of EtG alone was 0.95 (95% CI, 0.91–0.99). As a single biomarker, EtG yielded a stronger diagnostic performance in detecting at-risk drinkers than any combination of the multiple traditional biomarkers. In particular, EtG was better in detecting at-risk drinkers than the best traditional biomarker combination, which included CDT andγGT (P<0.05). No significant differences in detecting heavy drinkers were observed when comparing EtG with the best traditional biomarker combination (P=0.06).
Effects of intrinsic factors on EtG
A univariate regression analysis of age, gender, and BMI revealed that none of these variables affected the diagnostic performance of EtG in identifying chronic and excessive alcohol consumption (age [OR, 0.95; 95% CI, 0.89–1.01; P= 0.09], gender [OR, 0.86; 95% CI, 0.21–3.45; P=0.83], or BMI [OR, 1.04; 95% CI, 0.88–1.23; P=0.62]). Based on these results, no corrections were deemed necessary.
Discussion
Performance diagnostic and cutoff values
The main finding of this study was that hair EtG is a reliable indicator of chronic and excessive alcohol consumption, regardless of the subject's age, gender, or BMI.
Hair EtG demonstrates a high diagnostic performance in diagnosing chronic and excessive alcohol consumption. Even the best combination of EtG and traditional bio-markers does not significantly improve the diagnostic performance of EtG alone. Although EtG alone performed better in identifying at-risk drinkers than the best combina-tion of tradicombina-tional biomarkers, it showed a similar diagnos-tic performance in identifying heavy drinkers (as shown for CDT andγGT by Sillanaukee [7]). As expected, all of the biomarkers performed better in detecting heavy drinkers than at-risk drinkers. The highest diagnostic performance of the traditional biomarkers was obtained for the detection of heavy drinkers (0.73–0.84), whereas the lowest diagnostic performance was for the detection of at-risk drinkers (0.60– 0.80), with minimum reported values that were not much higher than would be expected by chance. These findings are in agreement with previously reported results [3] and have been attributed to the known increase in the activity of traditional biomarkers following an alcohol consumption of over 60–80 g/day, sustained for a 2-week period [8,31,32]. Thus, the high amount of alcohol required to increase traditional biomarker levels makes the early detection of
alcohol misuse particularly difficult. In contrast, EtG is present even after low to moderate alcohol consumption, and it allows the identification of at-risk drinkers with a high diagnostic performance (0.95), as compared to traditional biomarkers.
To identify heavy drinkers, a robust cutoff value has been determined: a cutoff value of 25 pg/mg offered the best combination of sensitivity (0.95) and specificity (0.97). These results are in agreement with a previous study, which suggested a cutoff of 27 pg/mg to identify heavy drinkers; the sensitivity and specificity were 0.92 and 0.96, respec-tively [24]. Using the 30-pg/mg cutoff recommended by the SoHT [22], we would have obtained a similar specificity (0.97); however, sensitivity would have decreased (0.81). In clinical and forensic practice, ensuring high specificity is important to reduce false positive results. In this study, the best specificity was obtained with a cutoff of 39 pg/mg: no subjects would have been misclassified as heavy drinkers, though only 81% would have been correctly identified as heavy drinkers. Similarly, a robust cutoff value was deter-mined to detect at-risk drinkers. The optimal cutoff value was 9 pg/mg and yielded a sensitivity of 0.82 and a specificity of 0.93. To our knowledge, this is the first study investigating the usefulness of EtG in detecting at-risk drinking, which is often an early sign of chronic and excessive alcohol consumption.
A distinction between low-risk drinking and abstinence under the given analytical limits is not possible because of the high percentage of negative results in the group of low-risk drinkers. This limitation may be partially solved in the near future by upcoming analytical equipments offering a better sensitivity. However, when EtG is detected in hair, abstinence can generally be excluded.
Several studies have reported an effect of gender, age, or BMI on traditional biomarker levels. Interestingly, in this study, EtG was not affected by gender, age, or BMI. In addition, earlier studies demonstrated that EtG was likely not influenced even by hair color [18,33]. These data support the relevance of EtG as a reliable biomarker because it does not require any gender, age, or BMI adjustments. These findings confirm the trends previously reported [24].
However, worries about artificial positive EtG results due to cosmetics or food cannot be neglected. A recent study carried out by Martins et al. [34] did not show false positive results after hair treatment with ethanol-containing hair care products. Nevertheless, a contamination by EtG-containing products cannot be excluded, even if that is exceptionally as reported in a case presented by Sporkert et al. [35]. Therefore, the hair treatment should always be recorded during the sampling. Positive EtG cases in hair due to food or none-hair cosmetics like mouthwash or hand sanitizers have not yet been reported in contrast to positive EtG urine results [36–41]. That can be explained by the small amount of ethanol ingested or absorbed leading to
EtG concentrations in urine insufficiently high to produce a positive EtG findings in hair.
Interpretation and practical considerations
In clinical and forensic practice, EtG has shown a high potential in monitoring abstinence, identifying a relapse to drinking, or in diagnosing chronic and excessive alcohol consumption. The analysis of hair EtG (0–3 cm, a proximal segment) should be interpreted according to the following criteria: (1) a hair EtG concentration of 0 to≤LOQ suggests an absence of alcohol consumption (teetotalers), although a low-risk alcohol consumption cannot be ruled out; (2) a EtG concentration of>LOQ to ≤9 pg/mg suggests low-risk con-sumption and can exclude abstinence; (3) a EtG concentration of >9 to≤25 pg/mg indicates at-risk consumption; and (4) a EtG concentration >25 pg/mg indicates heavy consumption.
In addition, care should be taken in the interpretation of hair EtG results to demonstrate a recent abstinence from alcohol. Because hair growth is irregular, and approximately 15–20% of the hair follicles remain in an inactive cycle phase, residual EtG can still be detected (rate, approximately 15– 20%) even after the complete cessation of alcohol consump-tion [42]. Depending on the previous alcohol consumption behavior, a waiting period, corresponding to the inactive phase of hair growth, might be recommended when monitoring abstinence in order to avoid misinterpretations. For the abstinence control days or a few weeks after the cessation of alcohol consumption, the detection of EtG and ethyl sulfate in urine [43, 44] or phosphatidylethanol in blood [45–47] are therefore a better choice.
In conclusion, hair EtG demonstrates a strong diag-nostic performance in detecting both at-risk and heavy alcohol consumption, and it clearly outperforms the diagnostic performance of the standard traditional bio-markers. In contrast with traditional biomarkers, age, gender, and BMI did not affect the EtG diagnostic performance. The analysis of hair EtG definitively provides an efficient clinical diagnostic tool to detect chronic and excessive alcohol consumption. Reliable cutoff values have been determined which can serve as reference for future cutoff recommendations in practice to identify alcohol-drinking behaviors.
Acknowledgments This study was generously supported by a grant
from the Swiss Foundation for Alcohol Research. The authors would like to thank Sara Petter for her assistance as well as Annette Jordan and Magali Dovat-Sabatella for their support in sample analysis.
References
1. Rehm J, Gmel G, Sempos CT, Trevisan M (2003) Alcohol-related
morbidity and mortality. Alcohol Res Health 27(1):39–51
2. WHO (2011) Global status report on alcohol and health. World Health Organization, Geneva. Accessed 11 Feb 2011
3. Conigrave KM, Degenhardt LJ, Whitfield JB, Saunders JB, Helander A, Tabakoff B (2002) CDT, GGT, and AST as markers of alcohol use: the WHO/ISBRA collaborative project. Alcohol Clin Exp Res 26(3):332–339
4. Arndt T (2001) Carbohydrate-deficient transferrin as a marker of chronic alcohol abuse: a critical review of preanalysis, analysis,
and interpretation. Clin Chem 47(1):13–27
5. Fleming MF, Anton RF, Spies CD (2004) A review of genetic, biological, pharmacological, and clinical factors that affect carbohydrate-deficient transferrin levels. Alcohol Clin Exp Res
28(9):1347–1355
6. Sillanaukee P (1996) Laboratory markers of alcohol abuse.
Alcohol Alcohol 31(6):613–616
7. Sillanaukee P, Olsson U (2001) Improved diagnostic classification of alcohol abusers by combining carbohydrate-deficient transferrin
and gamma-glutamyltransferase. Clin Chem 47(4):681–685
8. Anton RF, Lieber C, Tabakoff B (2002) Carbohydrate-deficient transferrin and gamma-glutamyltransferase for the detection and monitoring of alcohol use: results from a multisite study. Alcohol Clin Exp Res 26(8):1215–1222
9. Chen J, Conigrave KM, Macaskill P, Whitfield JB, Irwig L (2003) Combining carbohydrate-deficient transferrin and gamma-glutamyltransferase to increase diagnostic accuracy for problem
drinking. Alcohol Alcohol 38(6):574–582
10. Rinck D, Frieling H, Freitag A, Hillemacher T, Bayerlein K, Kornhuber J, Bleich S (2007) Combinations of carbohydrate-deficient transferrin, mean corpuscular erythrocyte volume, gamma-glutamyltransferase, homocysteine and folate increase the significance of biological markers in alcohol dependent patients. Drug Alcohol
Depend 89(1):60–65
11. Alt A, Janda I, Seidl S, Wurst FM (2000) Determination of ethyl
glucuronide in hair samples. Alcohol Alcohol 35(3):313–314
12. Janda I, Weinmann W, Kuehnle T, Lahode M, Alt A (2002) Determination of ethyl glucuronide in human hair by SPE and
LC-MS/MS. Forensic Sci Int 128(1–2):59–65
13. Yegles M, Labarthe A, Auwarter V, Hartwig S, Vater H, Wennig R, Pragst F (2004) Comparison of ethyl glucuronide and fatty acid ethyl ester concentrations in hair of alcoholics, social drinkers and teetotallers. Forensic Sci Int 145(2–3):167–173
14. Politi L, Morini L, Leone F, Polettini A (2006) Ethyl glucuronide in hair: is it a reliable marker of chronic high levels of alcohol
consumption? Addiction 101(10):1408–1412
15. Jurado C, Soriano T, Gimenez MP, Menendez M (2004) Diagnosis of chronic alcohol consumption. Hair analysis for ethyl-glucuronide.
Forensic Sci Int 145(2–3):161–166
16. Skopp G, Schmitt G, Potsch L, Dronner P, Aderjan R, Mattern R
(2000) Ethyl glucuronide in human hair. Alcohol Alcohol 35(3):283–
285
17. Appenzeller BM, Agirman R, Neuberg P, Yegles M, Wennig R (2007) Segmental determination of ethyl glucuronide in hair: a pilot
study. Forensic Sci Int 173(2–3):87–92
18. Kharbouche H, Steiner N, Morelato M, Staub C, Boutrel B, Mangin P, Sporkert F, Augsburger M (2010) Influence of ethanol dose and pigmentation on the incorporation of ethyl glucuronide into rat hair. Alcohol 44(6):507–514
19. Pragst F, Yegles M (2008) Determination of fatty acid ethyl esters (FAEE) and ethyl glucuronide (EtG) in hair: a promising way for retrospective detection of alcohol abuse during pregnancy? Ther Drug Monit 30(2):255–263
20. Kintz P, Villain M, Vallet E, Etter M, Salquebre G, Cirimele V (2008) Ethyl glucuronide: unusual distribution between head hair
and pubic hair. Forensic Sci Int 176(1):87–90
21. Bendroth P, Kronstrand R, Helander A, Greby J, Stephanson N, Krantz P (2008) Comparison of ethyl glucuronide in hair with
phosphatidylethanol in whole blood as post-mortem markers of
alcohol abuse. Forensic Sci Int 176(1):76–81
22. Kintz P (2010) Consensus of the Society of Hair Testing on hair testing for chronic excessive alcohol consumption 2009. Forensic Sci Int 196(1–3):2
23. Liniger B, Nguyen A, Friedrich-Koch A, Yegles M (2010) Abstinence monitoring of suspected drinking drivers: ethyl glucuronide in hair versus CDT. Traffic Inj Prev 11(2):123–126 24. Morini L, Politi L, Polettini A (2009) Ethyl glucuronide in hair. A
sensitive and specific marker of chronic heavy drinking. Addiction
104(6):915–920
25. Kronstrand R, Brinkhagen L, Nystrom FH (2011) Ethyl glucuronide in human hair after daily consumption of 16 or 32 g of ethanol for
3 months. Forensic Sci Int. doi:10.1016/j.forsciint.2011.01.044
26. Gmel G, Daeppen JB (2007) Recall bias for seven-day recall measurement of alcohol consumption among emergency depart-ment patients: implications for case-crossover designs. J Stud
Alcohol Drugs 68(2):303–310
27. Lemmens P, Knibbe RA, Tan F (1988) Weekly recall and dairy estimates of alcohol consumption in a general population survey. J Stud Alcohol 49(2):131–135
28. Townshend JM, Duka T (2002) Patterns of alcohol drinking in a population of young social drinkers: a comparison of question-naire and diary measures. Alcohol Alcohol 37(2):187–192 29. Pragst F, Balikova MA (2006) State of the art in hair analysis for
detection of drug and alcohol abuse. Clin Chim Acta 370(1–2):17–49
30. Kharbouche H, Sporkert F, Troxler S, Augsburger M, Mangin P, Staub C (2009) Development and validation of a gas chromatography-negative chemical ionization tandem mass spectrometry method for the determination of ethyl glucuronide in hair and its application to forensic toxicology. J Chromatogr B Analyt Technol Biomed Life Sci
877(23):2337–2343
31. Helander A, Tabakoff B (1997) Biochemical markers of alcohol use and abuse: experiences from the Pilot Study of the WHO/ISBRA Collaborative Project on state and trait markers of alcohol. International Society for Biomedical Research on Alcoholism.
Alcohol Alcohol 32(2):133–144
32. Stibler H (1991) Carbohydrate-deficient transferrin in serum: a new marker of potentially harmful alcohol consumption reviewed. Clin Chem 37(12):2029–2037
33. Appenzeller BM, Schuman M, Yegles M, Wennig R (2007) Ethyl glucuronide concentration in hair is not influenced by pigmentation.
Alcohol Alcohol 42(4):326–327
34. Martins L, Binz T, Yegles M (2011) Influence of ethanol containing cosmetics on ethyl glucuronide concentration in hair.
Ann Toxicol Anal 23:S1–10
35. Sporkert F, Kharbouche H, Augsburger M, Mangin P (2011)
Positive EtG findings in hair as a result of cosmetic treatment—a
case report. Ann Toxicol Anal 23:S1-9–S1-10
36. Musshoff F, Albermann E, Madea B (2010) Ethyl glucuronide and ethyl sulfate in urine after consumption of various beverages and foods—misleading results? Int J Legal Med 124(6):623–630
37. Thierauf A, Wohlfarth A, Auwarter V, Perdekamp MG, Wurst FM, Weinmann W (2010) Urine tested positive for ethyl glucuronide and ethyl sulfate after the consumption of yeast and sugar.
Forensic Sci Int 202(1–3):e45–e47
38. Thierauf A, Gnann H, Wohlfarth A, Auwarter V, Perdekamp MG, Buttler KJ, Wurst FM, Weinmann W (2010) Urine tested positive for ethyl glucuronide and ethyl sulphate after
the consumption of “non-alcoholic” beer. Forensic Sci Int
202(1–3):82–85
39. Hoiseth G, Yttredal B, Karinen R, Gjerde H, Christophersen A (2010) Levels of ethyl glucuronide and ethyl sulfate in oral fluid, blood, and urine after use of mouthwash and ingestion of
nonalcoholic wine. J Anal Toxicol 34(2):84–88
40. Rosano TG, Lin J (2008) Ethyl glucuronide excretion in humans following oral administration of and dermal exposure to ethanol. J
Anal Toxicol 32(8):594–600
41. Reisfield GM, Goldberger BA, Crews BO, Pesce AJ, Wilson GR, Teitelbaum SA, Bertholf RL (2011) Ethyl glucuronide, ethyl sulfate, and ethanol in urine after sustained exposure to an ethanol-based hand sanitizer. J Anal Toxicol 35(2):85–91 42. Sachs H (1995) Theoretical limits of the evaluation of drug
concentrations in hair due to irregular hair growth. Forensic Sci
Int 70(1–3):53–61
43. Helander A, Bottcher M, Fehr C, Dahmen N, Beck O (2009) Detection times for urinary ethyl glucuronide and ethyl sulfate in heavy drinkers during alcohol detoxification. Alcohol Alcohol 44
(1):55–61
44. Halter CC, Dresen S, Auwaerter V, Wurst FM, Weinmann W (2008) Kinetics in serum and urinary excretion of ethyl sulfate and ethyl glucuronide after medium dose ethanol intake. Int J Legal
Med 122(2):123–128
45. Aradottir S, Asanovska G, Gjerss S, Hansson P, Alling C (2006) Phosphatidylethanol (PEth) concentrations in blood are correlated to reported alcohol intake in alcohol-dependent patients. Alcohol Alcohol 41(4):431–437
46. Gnann H, Weinmann W, Engelmann C, Wurst FM, Skopp G, Winkler M, Thierauf A, Auwarter V, Dresen S, Bouzas NF (2009) Selective detection of phosphatidylethanol homologues in blood as biomarkers for alcohol consumption by LC-ESI-MS/MS. J
Mass Spectrom 44(9):1293–1299
47. Wurst FM, Thon N, Aradottir S, Hartmann S, Wiesbeck GA, Lesch O, Skala K, Wolfersdorf M, Weinmann W, Alling C (2010) Phosphatidylethanol: normalization during detoxification, gender aspects and correlation with other biomarkers and self-reports.