HAL Id: hal-01282936
https://hal.archives-ouvertes.fr/hal-01282936
Submitted on 8 Mar 2016
HAL is a multi-disciplinary open access
archive for the deposit and dissemination of sci-entific research documents, whether they are pub-lished or not. The documents may come from teaching and research institutions in France or abroad, or from public or private research centers.
L’archive ouverte pluridisciplinaire HAL, est destinée au dépôt et à la diffusion de documents scientifiques de niveau recherche, publiés ou non, émanant des établissements d’enseignement et de recherche français ou étrangers, des laboratoires publics ou privés.
Activity Recognition Using Multiple Inertial
Measurement Units
Nahed Jalloul, Fabienne Porée, Geoffrey Viardot, Philippe L ’Hostis, Guy
Carrault
To cite this version:
Nahed Jalloul, Fabienne Porée, Geoffrey Viardot, Philippe L ’Hostis, Guy Carrault. Activity Recogni-tion Using Multiple Inertial Measurement Units. InnovaRecogni-tion and Research in BioMedical engineering, Elsevier Masson, 2016, 37 (3), pp.180-186. �10.1016/j.irbm.2016.02.008�. �hal-01282936�
Activity Recognition Using Multiple Inertial Measurement
Units
Nahed Jalloula,b∗, Fabienne Poréea,b, Geoffrey Viardotd, Philippe L’Hostisd, Guy Carraulta,b,c
Addresses:
a Laboratoire Traitement du Signal et de l’Image (LTSI), Université de Rennes 1, Campus de Beaulieu,
35042 Cedex, Rennes, France
bINSERM, U1099, Université de Rennes 1, Campus de Beaulieu, 35042 Cedex, Rennes, France cINSERM, CIC-1414, Hôpital de Pontchaillou, 2 rue Henri Le Guilloux, 35033 Cedex, Rennes, France dBiotrial, 35000 Cedex, Rennes, France
Corresponding author: Nahed Jalloul
Laboratoire Traitement du Signal et de l’Image (LTSI), Université de Rennes 1, Campus de Beaulieu, 35042 Cedex, Rennes, France
Tel.: +33-2-23-23-62-20
E-mail address: [email protected]
Abstract
Objectives: This paper addresses the design of an ambulatory monitoring system based on a set of wear-able, wireless inertial measurement units able to perform activity recognition for healthy individuals and Parkinson’s disease patients, as well as analyze and assess the severity of levodopa induced dyskinesia. Material and methods: The monitoring system is composed of six Shimmer3 modules placed at different positions of the individual’s body. Both healthy individuals and one patient performed a protocol of simple daily life activities while wearing the Shimmer3 modules. As an initial step, validity of the monitoring system in identifying healthy individuals’ activities is presented. Data corresponding to the activities was separated and features in both the time and frequency domains were extracted. Multiple factor analysis was used to evaluate and infer the relationships between the different module positions. A method of feature selection was implemented to determine the most important features, positions and sensors included in the different modules. The classification of activities was done using a KNN classifier.
Results: Promising results were obtained in classifying the activities of healthy individuals, with a global accuracy of 77.6%, while certain adaptation is required for the application on Parkinson’s disease patients. Conclusion: While activity recognition for healthy individuals using this system was successful, further evaluation of the contribution of each module needs to be done in order to determine optimal module po-sitions. To validate the obtained results on Parkinson’s disease patients, more acquisitions on patients are required.
1. Introduction
In the past few decades, activity recognition through wearable sensing devices has become a widely researched area finding applications in various domains such as medicine, security and entertainment. In particular, several medical applications have been concerned with utilising these non-invasive, wearable devices for detecting motor symptoms of patients.
Parkinson’s disease is the second most common neurodegenerative disorder, following Alzheimer’s [1]. This disease is characterised by several motor symptoms such as hypokinesia, bradykinesia, freezing of gate, and tremor as well as motor complications of treatment methods such as dyskinesia. The assessment of the motor symptoms today is based on the clinician rated scales and patient diaries. Although some of these scales, such as the unified Parkinson’s disease rating scale, have proven to have reliable test-retest performance, they remain to be subjective, short-based assessments that lack the ability to quantify the disease’s motor complications. Therefore, research has been aimed towards finding a more objective, long-term automated method for the detection and quantification of Parkinson’s disease motor symptoms.
Recent studies have been conducted that aim to detect certain motor symptoms such as tremor, bradyki-nesia and hypokibradyki-nesia using kinematic sensors. However, these studies are usually concerned with the assessment of one or two motor symptoms and are based on short time recordings of patients in somewhat restricted environments (see [2] for review). The enhancement of therapeutic measures lies in understanding the complexity and evolution of motor complications that manifest both due to disease progression as well as the implementation of the therapeutic plan itself. In order to do that, there is a need for a long-term and reliable monitoring device that is able to assess the patient’s general motor state, detect and quantify motor symptoms, providing an objective means for determining disease progression [3]. Because of that need, there exists a link between the field of ambulatory monitoring of Parkinson’s disease motor symptoms and the field of activity recognition.
Although there have been many advances in the field of activity recognition, there are several issues that still remain urging further exploration of the currently available technologies in enhancing the accuracy of classifying daily activities [4]. Some of the most commonly used types of sensors in activity recognition today are inertial sensors such as accelerometers and gyroscopes, magnetic sensors, and physiological signal measurement devices. Studies have reported varying results based on these different types of sensors, mostly due to differences in the types of activities to be recognised and depending on the application at hand. The objective of this paper is to propose the design of a new ambulatory monitoring system based on a set
of wearable, wireless inertial measurement units able to perform daily life activity recognition for healthy individuals and Parkinson’s disease patients.
Section II introduces the system of data acquisition, along with the placement of modules, the incorpo-rated sensors and the activity protocol performed. Following that, the signal processing method is explained and the extracted features are described, including a brief summary of multiple factor analysis, the feature selection method and K Nearest Neighbour (KNN) classification. Section III presents the obtained results for both multiple factor analysis and KNN classification, while Section IV shows the results of the primary application of the developed algorithm on a Parkinson’s disease patient. In Section V, a brief conclusion is presented.
2. Materials and Methods 2.1. Data acquisition
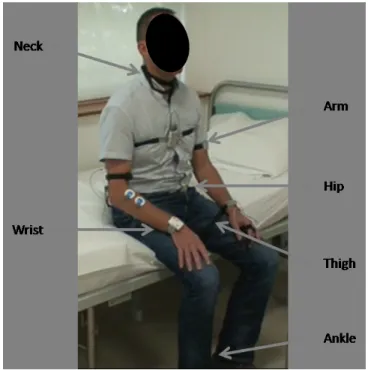
The entire system of acquisition is composed of six Shimmer3 modules [5] placed at different segments of the subject’s body (Figure 1). The modules were attached to the subject’s body by elastic straps and did not affect the subject’s free movement. Each of the sensing modules contains the five following sensors: triaxial low noise accelerometer, triaxial wide range accelerometer, triaxial gyroscope, triaxial magnetome-ter, temperature sensor, and altimeter. The sensors all operated under the same sampling rate of 512 Hz and data was collected on each module’s internal memory card. For the analysis of movement, only the signals collected from both accelerometers, gyroscope and magnetometer were considered. Twelve different signals were therefore collected from each shimmer module, and a total of seventy-two signals were analysed for all module positions.
Nine healthy subjects (3 males and 6 females) participated in the data acquisition protocol which con-sisted of a series of N = 7 simple daily life activities (see Figure 2). The activities were performed during the session without interruption and data acquisition was done continuously. Each subject performed the same protocol twice, on two different days. During the acquisition sessions, subjects were instructed to act freely and perform each activity at their own pace. The period of each activity was timed for an average of two minutes and subjects were then instructed to move on to the next activity. The sessions were video-taped, and the exact start and end times of each activity were annotated based on the collected video recordings.
Figure 1: Shimmer3 module positions.
Neck
Wrist
Arm
Hip
Thigh
Ankle
Triaxial LN Acc
Triaxial WR ACC
Triaxial Gyroscope
Triaxial Magnetometer
Temp (not used)
Altimeter (not used)
Walking
Standing
Lying
Sitting
Writing
Reading
Eating
6 Positions
6 Sensors
7 Activities
Figure 3 shows examples of collected signals from sensors of a single module (Ankle) during two dif-ferent activities (walking and lying down).
Figure 3: Example of collected signals from a single module’s sensors during walking and lying down.
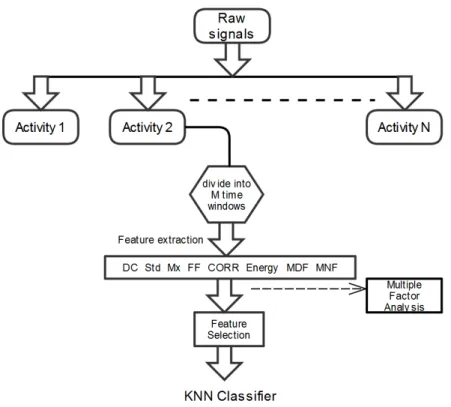
2.2. Feature extraction
Signals were then processed according to the schema in Figure 4. Each activity’s raw signal data was first extracted from the total acquired data based on that activity’s annotated start and end times. Then, the data corresponding to each raw signal was segmented into M = 7 second time windows.
Then, for each time window, x[n], n = 1,..., Mx512, features in both the time and frequency domain were extracted.
• DC and Std are the mean and standard deviation of each sensor data taken over the specified time window.
Figure 4: Data processing and feature extraction.
• The mobility and form factor parameters are denoted by Mx and FF respectively. Mobility is defined as the ratio of the standard deviation of the first derivative of x[n] with respect to time to the standard deviation of x[n] itself, where x[n] is the discrete time vector corresponding to the data of the specified window. Form factor, on the other hand, is defined as the ratio of the mobility of x’[n], the first derivative of x[n], to the mobility of x[n].
• The last time domain parameter (CORR), represents the peak cross correlation between the three orthogonal axes of each sensor present in a single sensing module. The maximum value of cross correlation between the sensor axes gives an indication of the time lag/leads between the signals corresponding to each axis.
Prior to calculating the frequency domain parameters, the zero-frequency component of the collected signals was removed.
• Energy was calculated as the sum of squared discrete Fourier transform component magnitudes for each time window [6].
power spectral density of each window was first estimated using the Burg method [7], which fits an autoregressive model to the signal by minimising the forward and backward prediction errors. The mean frequency is defined as the average of the obtained power spectrum, while the median frequency is defined as the value dividing the power spectrum into two equal areas. The order of the autoregressive model was selected after an exhaustive search on all the database using the Akaike information criterion.
The total number of features calculated for each module is therefore 96 (8 features x 12 signals).
2.3. Multiple Factor Analysis
Multiple factor analysis is a geometrical approach to analyse data comprised of a number of observa-tions, in which each observation is described by variables of quantitative and categorical nature simultane-ously [8]. Different sets of variables can be organised into groups, given that each group contains variables of the same nature. This method is based on performing factor analysis on the entire set of variables while being able to apply weighting to the observations or different groups [9]. This leads to a representation of the observations and variables, resulting in a categorisation of the observations, a categorisation of the variables, and the association of the observations to each group of variables. The factor analysis performed is either equivalent to principle component analysis, in the case of quantitative variables, or multiple correspondence analysis, in the case of categorical variables.
2.4. Feature Selection and KNN classification
In certain cases, a large number of descriptive variables can have a negative effect on the performance of classification systems. Feature selection is the process of selecting a subset of variables that best distinguish between the different classes of a set of observations [10]. This method provides the ability to reduce the number of variables and allows only the most pertinent variables to be used for classification. It is possible to achieve better classification results using this process since the noise caused by unimportant or redundant variables is eliminated. The Relief Method, is a feature selection tool that works by estimating how well each of the provided variables can separate between the given classes. According to their weights, the variables are then re-arranged in a decreasing order of importance [11]. In order to test the effect of feature selection on the classification accuracy, several datasets will be considered. The first, consisting of all calculated variables, and then datasets that consist of a varying number of selected variables by the relief method to find the optimal number of variables.
KNN classification [12] was chosen due to its simplicity and the fact that it is one of the most funda-mental classification methods when there is little or no prior knowledge about the distribution of data. This method is based on the Euclidean distance measure between a test sample and the specified training samples. The predicted class of any test sample is set equal to the most frequent true class of the k nearest surrounding training samples.
3. Results
3.1. Multiple Factor Analysis
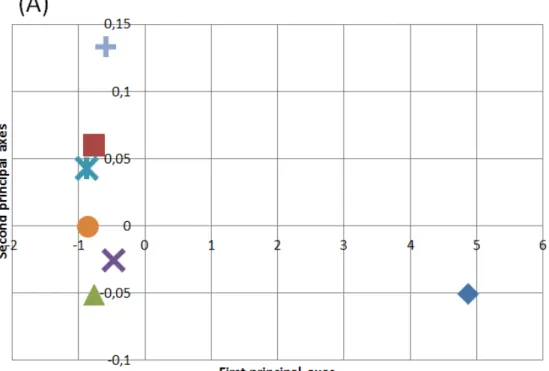
The previously mentioned variables were computed for the subjects activity protocol data performed on the first day. Each time window corresponding to the different performed activities is considered as an observation, and the variables belonging to the same module position are considered as a single group. The total matrix is composed of 2266 observations x 576 variables. Initially, the groups of variables are equally weighted and a representation of the relationship between the different classes of observations and the groups of variables, or in other words the module positions, is obtained. The factor analysis is applied to the data including all groups of variables. In Figure 5, the mean of observations belonging to each class is projected on the common factors. Using this projection, a clear separation between the classes of activities is observed. On the one hand, when projecting the mean values on the first factor, dynamic activities, such as walking, and static activities, such as standing still or lying down, show a large difference. On the other hand, a moderate separation can be observed between the static activities when projected onto the second factor.
3.2. Feature Selection and KNN Classification
Classification of the activities was based on the extracted features using a KNN classifier. The classifier was trained and tested using two different approaches.
In the first approach, no feature selection was implemented and the computed features corresponding to all module sensors and positions were included. The classifier was trained on all subjects activity protocol data performed on the first day, and tested using the subjects activity protocol data taken from the second day. This resulted in a global accuracy of 53% for the activity classification, with the best performance obtained
Figure 5: (A) Projection of the mean of observations of each class on the first and second axes obtained after performing MFA on the data obtained from healthy subjects. (B) Total variance for each type of activity for the first (blue) and second (red) axes.
for the activity of walking which had sensitivity and specificity values of 100% and 87.1% respectively. The poorest performance obtained corresponded to low-energy activities such as reading and standing still.
In the second approach, feature selection was applied to the subjects activity protocol data performed on the first day. The classifier was then trained by the selected features and tested using the same features computed for the subjects activity protocol data of the second day. The obtained rankings of the variables based on the given weight by the relief method is shown in Figure 6.
Figure 6: Variable rankings by decreasing order of weight.
Each time, a different number of ranked variables by the relief method was chosen, and the classification process was repeated. The resulting classification accuracy of all the activities for a different number of selected features is represented in Figure 7.
The best overall classification accuracy of 77.6% was obtained when classification was done using the first 20 ranked variables by the relief method. Table 1 shows the sensitivity and specificity obtained for each activity classification and the contingency matrix.
Figure 7: Classification accuracy obtained from different numbers of selected variables. The best performance was found for R = 20 variables.
Activity Walking Standing Lying Sitting Writing Reading Eating Total
Walking 234 32 0 5 4 1 0 276 Standing 75 176 0 3 0 0 0 254 Lying 0 2 510 4 0 4 0 520 Sitting 5 53 0 442 3 1 37 541 Writing 0 0 0 1 252 0 9 262 Reading 0 10 0 35 58 56 0 159 Eating 1 0 0 88 33 44 88 254 Total 315 273 510 578 350 106 134 2266 Sensitivity 84.78 69.29 98.08 81.7 96.18 35.22 34.65 Specificity 95.93 95.18 100 92.12 95.11 97.63 97.71
Table 1: Classification results obtained using relief feature selection with R = 20 features and KNN classification and their corre-sponding sensitivity and specificity values.
4. Application on Parkinson’s Disease Patient
A primary evaluation of the developed algorithm was done using data from a Parkinson’s disease patient who performed the same protocol of activities while wearing the sensing modules. During the recording session, the patient suffered from varying intensities of Levodopa induced dyskinesia [13]. In certain cases, the dyskinesia was at a debilitating severity, preventing the patient from performing the activity. In such cases, the protocol was paused for a few minutes giving the patient enough time to recuperate before mov-ing onto the next activity. The patient displayed dyskinesia primarily in the left side of the body. It was also evident, during the performance of the protocol, that certain activities were difficult to perform while experiencing dyskinesia, while others were relatively unaffected by it.
Similarly to the analysis performed on the data collected from healthy subjects, MFA was performed on the data collected from the Parkinson’s disease patient. Dyskinesia was prominent during lying down, standing and sitting still for this particular patient. As a result, there were noticeably significant movements during these activities that distinguished between their nature when performed by the patient, and the static nature in which they were performed by the healthy subjects. The mean of the observations belonging to each class corresponding to the patient’s data is projected onto the first and second factors (Figure 8).
The same process of feature selection using the relief method and KNN classification was also implemented on the data collected from the patient. However, a leave one out training and testing method was applied here due to the lack of available data. Without feature selection, and using the features extracted from all module sensors and positions, an overall classification accuracy of 43.8% was obtained. The activity walking displayed the highest sensitivity and specificity values of 77.8% and 83.96% respectively, while the activity of lying showed the poorest classification sensitivity and specificity, in the majority of cases being misclassified as walking. These results must be considered as preliminary due to the small size of observations compared to the number of features. Nevertheless, for our final goal which is the detection and classification of dyskinesia and akinesia, these results are promising, demonstrating that during a dyskinetic episode, we were able to separate between dynamic and static activities.
5. Discussion-Conclusion
Preliminary evaluation of activity classification using the Shimmer3 inertial measurement units shows promising results. The sensing modules small size, portability and simple operating manner make them
Figure 8: (A) Projection of the mean of observations of each class on the first and second axes obtained after performing MFA on the data obtained from a PD patient. (B) Total varaince for each type of activity for the first (blue) and second (red) axes.
ideal for the design of an ambulatory system for long-term monitoring of activities and the motor states of patients.
In the case of healthy subjects, the sensing modules were able to successfully classify the different activities with a global accuracy of 77.6%. Further evaluation of the contribution of each module position with respect to the performed activity needs to be done in order to determine the optimal placement of the modules. Following this step, further features will be explored and more complex classification methods will be tested, such as Support Vector Machine, to enhance the accuracy of identifying different activities in healthy subjects.
Optimizing the activity classification process is an important step before testing the system’s ability to detect and estimate Parkinson’s disease motor symptoms. Disease progression and the prevalence of motor symptoms, specifically Levodopa induced dyskinesia, will affect the patient’s general motor condition and their ability to perform simple daily activities. This change will be significant in estimating the severity of motor symptoms and objectively monitoring the patient’s disease progression.
Conflicts of interest No conflict of interest.
Acknowledgment
The authors gratefully acknowledge volunteers and technicians who participated in the acquisition pro-cess. This work was funded by Biotrial.
References
[1] G. Alves, E.B. Forsaa, K.F. Pedersen, et al. "Epidemiology of Parkinson’â ´Cˇnâ ˇD´cs disease", Journal of Neurology, 2008, Vol. 255, pp. 18-32.
[2] M.A. Hobert, W. Maetzler, K. Aminian, et al. "Technical and clinical view on ambulatory assessment in Parkinson’s disease", Acta Neurologica Scandinavica, 2014, Vol. 130, pp. 139-47.
[3] D.G. Zwartjes, T. Heida, J.P. van Vugt, et al. "Ambulatory monitoring of activities and motor symptoms in Parkinson’s disease", Biomedical Engineering, IEEE Transactions on, 2010, Vol. 57, pp. 2778-86. [4] O. D. Lara, and M.A. Labrador, "A survey on human activity recognition using wearable sensors",
Communications Surveys & Tutorials, IEEE, 2013, Vol. 15, pp. 1192-209.
[5] A. Burns, and B.R. Greene, M.J. McGrath, et al. "SHIMMERT M – A wireless sensor platform for non-invasive biomedical research", Sensors Journal, IEEE, 2010, Vol. 10, pp. 1527-34.
[6] L. Bao, and S.L. Intille, "Activity recognition from user-annotated acceleration data", Pervasive com-puting, 2004, pp. 1-17.
[7] J. Huang "Study of Autoregressive (AR) Spectrum Estimation Algorithm for Vibration Signals of Indus-trial Steam Turbines", Control and Automation, 2014, Vol. 7, pp. 349-62.
[8] B. Escofier, and J. Pagès, "Multiple factor analysis (AFMULT package)", Computational statistics & data analysis, 1994, Vol. 18, pp. 121-40.
[9] J.F. Hair, R.L. Tatham, R.E. Anderson, et al. "Multivariate data analysis", Pearson Prentice Hall Upper Saddle River, NJ, 2006.
[10] A. Jain, D. Zongker, "Feature selection: Evaluation, application, and small sample performance", Pattern Analysis and Machine Intelligence, IEEE Transactions on, 1997, Vol. 19, pp. 153-8.
[11] K. Kira, and L.A. Rendell, "The feature selection problem: Traditional methods and a new algorithm", Proceedings of the Ninth National conference on Artificial Intelligence, 1992, pp. 129-34.
[12] T. Cover, and P. Hart, "Nearest neighbor pattern classification", Information Theory, IEEE Transac-tions on, 1967, Vol. 13, pp. 21-7.
[13] G. Fabbrini, and J.M. Brotchie, F. Grandas, et al. "Levodopa-induced dyskinesias", Movement disor-ders, 2007, Vol. 22, pp. 1379-89.