HAL Id: inserm-00188503
https://www.hal.inserm.fr/inserm-00188503
Submitted on 20 Nov 2007
HAL is a multi-disciplinary open access
archive for the deposit and dissemination of
sci-entific research documents, whether they are
pub-lished or not. The documents may come from
teaching and research institutions in France or
abroad, or from public or private research centers.
L’archive ouverte pluridisciplinaire HAL, est
destinée au dépôt et à la diffusion de documents
scientifiques de niveau recherche, publiés ou non,
émanant des établissements d’enseignement et de
recherche français ou étrangers, des laboratoires
publics ou privés.
Coupling texture analysis and physiological modeling for
liver dynamic MRI interpretation.
Muriel Mescam, Johanne Bezy-Wendling, Marek Kretowski, Krzysztof
Jurczuk, Pierre-Antoine Eliat, Damien Olivié
To cite this version:
Muriel Mescam, Johanne Bezy-Wendling, Marek Kretowski, Krzysztof Jurczuk, Pierre-Antoine Eliat,
et al.. Coupling texture analysis and physiological modeling for liver dynamic MRI interpretation..
Conference proceedings : .. Annual International Conference of the IEEE Engineering in Medicine and
Biology Society. IEEE Engineering in Medicine and Biology Society. Annual Conference, Institute of
Electrical and Electronics Engineers (IEEE), 2007, 1, pp.4223-4226. �10.1109/IEMBS.2007.4353268�.
�inserm-00188503�
Coupling texture analysis and physiological modeling for liver dynamic
MRI interpretation
Muriel Mescam, Johanne B´ezy-Wendling, Marek Kretowski, Krzysztof Jurczuk,
Pierre-Antoine Eliat, Damien Olivi´e
Abstract— We coupled our physiological model of the liver, to a MRI simulator (SIMRI) in order to find image markers of the tumor growth. Some pathological modifications related to the development of Hepatocellular carcinoma are simulated (flows, permeability, vascular density). Corresponding images simulated at typical acquisition phases (arterial, portal) are compared to real images. The evolution of some textural features with arterial flow is also presented.
I. INTRODUCTION
Image analysis is a non invasive method used to precise the diagnosis of liver lesions. In their visual inspection, radiolo-gists mainly base their decision on anatomical criteria (num-ber of lesions, position in the liver segments, shape, size), and also on functional factors, like the lesion enhancement after contrast agent injection. Some quantitative methods like texture analysis can also give encouraging results in lesions classification [5]. A physiological interpretation of these textural features (that seem to be efficient in tumor characterization) could ameliorate the semi-automatic image analysis. This is particularly true when these image features are strongly dependent on image acquisition conditions. In MRI for instance, the sequence (Spin-Echo, Gradient Echo, etc) and its parameters (Repetition Time, Echo Time, slice thickness, etc) have a great influence on the contrast between normal and tumoral tissues, but also on their texture. We propose to couple a bi-level model of the liver, which takes into account some physiological and pathological parameters, with the dynamic MRI acquisition simulation, in order to understand some relations between image characteristics and the tumoral development.
II. CLINICAL PROBLEM
Hepatocellular Carcinoma (HCC) ranks as the fourth most common cancer in the world. Its incidence is increasing in many countries (4 per 100 000 persons in the United States, 5 in Northern Europe, around 30 in China, and 40 in Western Africa) [9]. This cancer is the result of the carcinogenesis process, from the regenerative nodule until M. Mescam and J. B´ezy-Wendling are with INSERM, U642, Rennes F-35000 France; and with Universit´e de Rennes 1, LTSI, F-F-35000 France. {muriel.mescam, johanne.bezy}@univ-rennes1.fr
M. Kretowsky and K. Jurczuk are with Faculty of Computer Science, Bialystok Technical University, Wiejska 45a, 15-351 Bialystok, Poland. {kjurczuk, mkret}@ii.pb.bialystok.pl
P.-A. Eliat is with PRISM ImagiVeC UPRES-EA 3890 IFR 140 Universit´e de Rennes 1, France. [email protected] D. Olivi´e is with D´epartement d’Imagerie M´edicale, CHRU Pontchaillou, rue Henri Le Guilloux - 35033, Rennes, France.
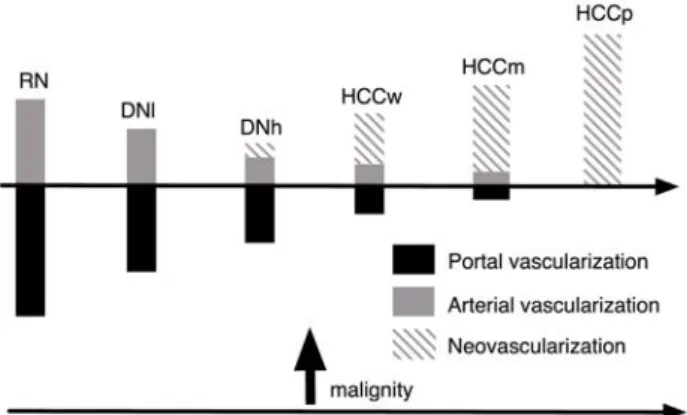
the poorly differentiated HCC (Fig.1). A great number of nodules are detected in images of cirrhotic patients, and in this context, semi-automatic characterization methods able to distinguish between regenerative nodule, dysplastic one or HCC are needed. Texture analysis can be one of these methods if it is able to extract pertinent image parameters, representative of the main physiological changes appearing during carcinogenesis. One of these main modifications con-cern the arterial and portal blood flows, as it is represented on the scheme of Fig.1.
Fig. 1. Evolution of blood supply during hepatocarcinogenesis (RN: Regenerative Nodule, DNl,h: low, high grade Dysplastic Nodule, HCCw,m,p: well, moderate and poorly differentiated HCC).
Other microvascular properties are also modified during the tumoral development like transport across the vessels wall. To find the most pertinent textural features, our phys-iological models presented in §3 include these flows and transport parameters.
III. METHODS
A. Vascular model
1) Macroscopic vascular model: In our computational
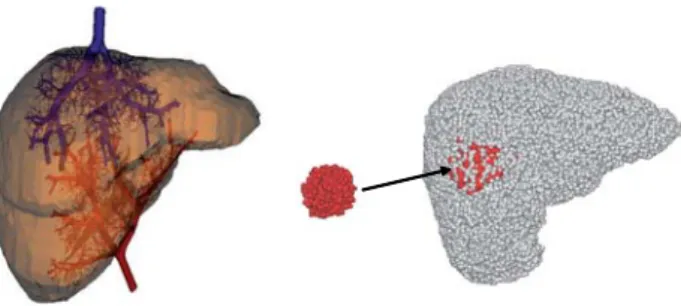
model detailed in [7], the liver is constituted of parenchyma and vessels. The macrovascular network is made of 3 trees (Hepatic Artery, Portal Vein, Hepatic Vein), whose growth is simulated, considering at each growth cycle, the geometric (length, caliber) and haemodynamic properties (blood flow and pressure) (see Fig.2 left). This model is used to simulate local pathological changes, like hyper-vascularization due to a tumor development (vascular modifications are mainly arterialization). The contrast product propagation, in normal
HAL author manuscript inserm-00188503, version 1
HAL author manuscript
Fig. 2. Model of the macrovascular hepatic network. Left: vascular network (arterial and venous trees); right: macro-functional units (red cells corresponding to tumoral tissue).
or tumoral tissues, is calculated by using all the vessels characteristics. These 3 vascular trees are connected at the level of macro-functional units (“macro-cells”) (Fig.2 right). A macro-cell is made of parenchyma and very small vessels, whose geometry is not considered, but whose enhancement has to be known, in order to simulate realistic MRI im-ages. At this level, compartmental modeling intervenes: each macro-cell is replaced by an independent pharmacokinetic model.
2) Model of transcapillary exchanges: Each macro-cell is
replaced by an independent five-compartments model (Fig.3) whose entries (arterial and portal blood flows and concentra-tions) depend on the corresponding data in the macrovascular model. Their profiles are deduced from the contrast agent propagation in the macrovessels until the terminal arterioles and venules. This pharmacokinetic model integrates the hepatic arteriole and portal venule as full compartments and not just as simple inputs of the model. The inputs are the terminal branches of the hepatic artery and portal vein, that supply the hepatic lobule, considered here as the functional unit of the liver parenchyma. The output is the terminal hepatic venule, supplied by a capillary network that con-stitutes the sinusoidal compartment. These compartments do not only communicate with each other while the molecule is propagating. Transmembranar exchanges also exist between them and the interstitial fluid inside the lobule. A model of these exchanges was already applied by Kellen et al [6] in the cardiovascular system. In this work, several pathways are considered for solute and fluid exchanges through the vessels or capillaries membrane. For example, sinusoids, that are a particular type of discontinued capillaries, present large fenestrations, in addition to small and large pores. In the opposite, arterioles and venules are supposed to be impermeable in a normal liver. Some important parameters whose variations characterize the tumoral stage evolution are integrated. They are mainly transport parameters (vascular permeability, hydraulic conductivity, reflection coefficient) related to the molecule and to the vascular walls prop-erties, but also exchange area, concentration and pressure gradients. The molecule propagation is described by the system of ordinary differential equations given below, where the evolution of its concentration in each compartment is
computed as a function of time (V/S notations correspond to Volumes/Surfaces). Vha dCha(t) dt = Q 0 haC0ha(t)− Sha×haJs(t)− QhaCha(t) (1) Vpv dCpv(t) dt = Q 0 pvC0pv(t)− Spv×pvJs(t)− QpvCpv(t) (2) Vsi dCsi(t) dt = QhaCha(t) + QpvCpv(t)− Ssi×siJs(t) −QsiCsi(t) (3) Vil dCil(t) dt = Sha×haJs(t) + Spv×pvJs(t) + Shv×hvJs(t) +Ssi×siJs(t)− QLCil(t) (4) Vhv dChv(t) dt = QsiCsi(t)− Shv×hvJs(t)− QhvChv(t) (5) Concentrations in the five compartments are used to compute the resulting concentration in each macro-cell (average, weighted according to each compartment volume), and thus T1 and T2 values necessary to generate the 3D phantom needed by the MRI simulator. Those new relaxation parameters (after injection of contrast agent) are obtained from the following equation:
R1,2observed= R1,2intrinsic+ r1,2C(t) (6)
Where R1,2are relaxation rates (s−1), r1,2are relaxivities (mM−1.s−1) and C(t) (mM) is the agent concentration. Relaxation times are obtained by inversing relaxation rates (T1,2= 1/R1,2).
B. Model of MRI
A 3D MRI simulator, named SIMRI and recently de-veloped by Benoit-Cattin et al. [2], was used to generate simulated images of the liver. The simulation system is based on the 3D Bloch equation resolution [3]. A 3D virtual object constitutes the input of the simulator. Each voxel is defined by three values describing the proton density PD, the spin-lattice relaxation time T1 and the spin-spin relaxation time T2, associated to the corresponding tissue. After application
Sinusoids Hepatic Arteriole Portal Venule Hepatic Venule Interstitial fluid ha ha t V C ),( pv pv
t
V
C ),
(
hv hvt V C ),( si sit
V
C ),
(
il ilt
V
C ),
(
)
(
0t
C
ha)
(
0t
C
pv 0 haQ
0 pvQ
hvQ
LQ
⎩
⎨
⎧
S ha f haJ
J
⎩
⎨
⎧
S pv f pvJ
J
⎩
⎨
⎧
S si f siJ
J
⎩
⎨
⎧
S hv f hvJ
J
siQ
haQ
pvQ
Chv(t) Sinusoids Hepatic Arteriole Portal Venule Hepatic Venule Interstitial fluid ha ha t V C ),( pv pvt
V
C ),
(
hv hvt V C ),( si sit
V
C ),
(
il ilt
V
C ),
(
)
(
0t
C
ha)
(
0t
C
pv 0 haQ
0 pvQ
hvQ
LQ
⎩
⎨
⎧
S ha f haJ
J
⎩
⎨
⎧
S pv f pvJ
J
⎩
⎨
⎧
S si f siJ
J
⎩
⎨
⎧
S hv f hvJ
J
siQ
haQ
pvQ
Chv(t)Fig. 3. Compartmental model of the hepatic microcirculation; Sym-bols: Q (flows, mL.s−1), C(t) (concentrations, mM), V (volumes, mL), J (fluxes, f stands for fluid, cm.s−1, and s stands for solute, mmol.cm−2.s−1).
of a MRI sequence on the input, the magnetization kernel computes a set of RF signals, stored in the k-space. Addition of noise to the k-space, associated to its filtering before the reconstruction of the MR image using fast Fourier transform, provides relatively realistic images.
C. Texture Analysis
Texture features were measured on MR simulated images of the liver, using MaZda, a software developed for COST B11 and B21 European projects [1] [11]. The purpose of this study was to better understand the relationship between physiological parameters, related to the model of the liver, and textural parameters, related to the simulated images. Variation of a physiological parameter can be expressed in a sequence of images where it has been modified, or in a single image on which its different values are expressed in different regions. The next step consists in the selection of squared ROI (Regions of Interest) on each image of the set of images, or more generally, on each region expressing a particular value of the parameter. Statistical (based on histogram, co-occurence matrix and run length matrix) and transform-based (Haar wavelet transform coefficients) methods are used to compute texture parameters from each ROI. At this stage of the analysis, a feature selection, based on Fisher criterion [10] or on POE-ACC (lowest probability of error and average correlation coefficient) [8], can be applied to the set of parameters to reduce their number. The resulting parameters thus allow some quick discrimination between tissues. As an example of texture analysis, the arterial flow variation has been studied and the results are presented in the next section.
IV. RESULTS AND DISCUSSION
A. Evaluation of the bi-level model
After coupling both macro- and microscopic models, a HCCp-like virtual tumor was generated based on a simu-lated adult liver. Propagation of a Gd-DOTA contrast agent, currently used in clinical routine [4], was simulated and post-injection T1, T2 and PD maps were created at typical arterial and portal phases. These maps were then used to simulate MR images via the simulator SIMRI. Results presented on Fig.4a correspond to images simulated after applying a T1-weighted 3D Gradient Echo sequence at 3 Tesla (Repetition time (TR), 2.75ms, Echo time (TE), 1.36ms, Flip angle, 10◦, Slice thickness, 4mm). Corresponding real images (obtained from the same acquisition parameters) are presented on Fig.4b. At arterial phase, the amount of contrast agent is more important in the tumor than in normal tissue. Indeed, sinusoids permeability decreases as the fenestrations tend to disappear, resulting in a weaker concentration of the contrast agent in the interstitial fluid. In addition, the arterial neovascularization, combined to an inhibition of the portal one, produces an “arterialization” phenomena, known as a typical symptom in hepatic tumoral development. In consequence, the global concentration of Gd-DOTA in the tissue presents a peak, close to the arterial one. The contrast between tumoral and normal tissues is then higher at this
b. Real MR images of the liver a. Simulated MR images of the liver
Arterial Phase
Portal Phase
Fig. 4. Comparison between simulated (a) and real (b) Dynamic Contrast-Enhanced MR images of the liver. Acquisition condi-tions: 3D Gradient Echo sequence 3T (TE= 1.36ms, TR= 2.75ms,
Flip Angle = 10◦, Slice T hickness = 4mm); Contrast agent: Gd-DOTA; Up: arterial phase. Down: portal phase. Note: red arrows indicate the tumor.
time, where T1 and T2 values are decreased in the tumor, according to Eq.6. The T1-weighted gradient echo sequence enhances the T1contrast in images, brightening tissues with lower T1, thus explaining the observed contrast (Fig.4). Later, at portal phase, Gd-DOTA concentration has decreased and the contrast is much less visible (Fig.4 down).
B. Texture analysis of simulated images
Five MR images were simulated from an artificial adult liver, on which five different classes of macro-cells were created. Those regions are similar in terms of geometrical parameters (size of the tumor, etc) and, at the microscopic level, in terms of transport parameters (permeability, etc) that correspond to a HCC. In addition, they are not supplied by the portal vein. The arterial flow entering the macro-cells is the only parameter that varies from one region to another, from normal tissue (around 0.14.10−3mL.s−1), to a highly graded HCC (around 0.56.10−3mL.s−1). Corres-ponding 128× 128 MR images were then simulated, apply-ing a 3D Gradient Echo sequence 3T (TE/TR/Flip angle, 1.36ms/2.75ms/10◦) at the arterial phase (simulation of a Gd-DOTA injection and generation of T1, T2and PD maps at 16s). The resulting images are presented on Fig.5. Two squared ROI were drawn on each tumoral region. Feature extraction was done using MaZda, for five classes of two samples each, corresponding to five different values of the arterial flow. Although many parameters were computed with different methods (statistical, wavelet-based, AR model-based), only a few of them appeared to discriminate rather well the different tissues. Both Fisher coefficients and POE-ACC methods allowed to select ten parameters that are
Qha = 0.14e-3 mL/s Qha = 0.21e-3 mL/s Qha = 0.31e-3 mL/s
Qha =0.42e-3 mL/s Qha = 0.56e-3 mL/s
Fig. 5. Effect of the arterial flow growth on simulated Dynamic Contrast-Enhanced MR images of the liver. Acquisition conditions: 3D Gradient Echo sequence 128×128 (TE= 1.36ms,TR= 2.75ms,
Flip Angle = 10◦, Slice T hickness = 1mm, 3T); Contrast agent: Gd-DOTA; arterial phase. Corresponding arterial flow values are depicted on the figure.
susceptible to better discriminate and classify textures. As an example, we chose to present two statistical parameters, derived from the co-occurence matrix, that were selected by both methods. The first one is the inverse difference moment S(2,0)InvDfMom and the second one is the sum variance S(3,-3)SumVarnc. Their evolution with arterial flow is presented on Fig.6. A strong dependence of these two parameters on the arterial flow appears, especially for the sum variance (see Fig.6 right) that clearly decreases as the flow grows. As a consequence, we might expect it to be a good marker of arterial neovascularization (see Fig.1), which is one of the main changes known to occur during carcinogenesis. 0.2 0.3 0.4 0.5 0.6 0.1 0.15 0.2 0.25 0.3 0.35 0.4 0.45 S (2, 0) In v D fMom Qha (10-3 mL/s) sample 1 sample 2 mean 0.2 0.3 0.4 0.5 0.6 0 100 200 300 400 Qha (10-3 mL/s) S( 3 ,-3 )Sum V a rn c sample 1 sample 2 mean
Fig. 6. Evolution of two co-occurence matrix-derived textural features with the arterial flow that supplies the macro-functional units (MFUs). left: S(2,0)InvDfMom (Inverse Difference Moment); right: S(3,-3)SumVarnc (Sum Variance).
V. CONCLUSIONS AND FUTURE WORKS
A. Conclusions
In this paper, we present a first evaluation of our bi-level model of the hepatic vascularization, by coupling it to MRI simulation and comparing simulated to real images. Indeed, simulated MR images of the liver appeared to be in good agreement with real ones. The possibility to change physiological parameters such as transport parameters, flows, etc, combined to our ability to simulate an image acquisition process currently used in clinical routine (Dynamic Contrast-Enhanced MRI), should allow us to better understand patho-logical events. Such important goal necessitates to build bridges between virtuality and reality, and thus requires to establish relationships between physiological parameters and textural features. With this aim in view, the computation of some statistical parameters already showed some promising results, particularly concerning the evolution of the arterial flow during the neoangiogenesis.
B. Future Works
In order to provide more realistic images, and thus better discrimination between textural parameters, several improve-ments are foreseen, especially at the microscopic level where new compartments should be added. Indeed, addition of cel-lular compartments such as hepatocytes, Kuppfer cells, en-dothelial cells, would allow the simulation of other transport mecanisms (facilitated and active transport, phagocytosis, etc). Therefore, the study of new contrast agents or even therapeutic molecules biodistribution, will be possible with the model.
REFERENCES [1] http://www.eletel.p.lodz.pl/cost/cost project.html.
[2] H. Benoit-Cattin, G. Collewet, B. Belaroussi, H. Saint-Jalmes, C. Odet, The SIMRI project: a versatile and interactive MRI simulator, J. Magnetic Resonance, vol. 173, 2005, pp. 97-115.
[3] F. Bloch, Nuclear induction, Physical Review, vol. 70, 1946, pp. 460-474.
[4] C. Corot et al., Physical, chemical and biological evaluations of P760: a new gadolinium complex characterized by a low rate of interstitial diffusion, J. Mag. Res. Im., vol. 11, 2000, pp. 182-191.
[5] D. Duda, M. Kretowski, J. Bezy-Wendling, Texture characterization for hepatic tumor recognition in multiphase CT, Biocybernetics and Biomedical Engineering, vol. 26(4), 2006, pp. 15-24.
[6] M. R. Kellen and J. B. Bassingthwaighte, An integrative model of coupled water and solute exchange in the heart, Am. J. Physiol. Heart Circ. Physiol., vol. 285, 2003, pp. 1303-1316.
[7] M. Kretowski et al., Physiologically based modeling for medical image analysis: application to 3D vascular networks and CT Scan modality, IEEE Trans. Med. Im., vol. 22, 2003, pp. 248-257.
[8] A. Mucciardi, E. Gose. A comparison of seven techniques for choosing subsets of pattern recognition properties, IEEE Trans. Computers, vol. 20(9), 1971, pp. 1023-1031.
[9] M. W. Russo, I. M. Jacobson, Hepatocellular cancer: screening, surveillance, and prevention, In: Kelsen DP, Daly JM, Kern SE, et al., eds.: Gastrointestinal Oncology: Principles and Practices. Philadelphia, Pa: Lippincott, Williams and Wilkins, 2002, pp. 559-568.
[10] J. Sch ¨urmann, Pattern Classification, John Wiley & Sons, 1996. [11] M. Strzelecki, A. Materka and P. Szczypinski, MaZda, In: M. Hajek,
M. Dezortova, A. Materka, R. Lerski eds.: Texture analysis for Magnetic Resonance Imaging, European Network Cost Action B21, 2006, chap. 4, pp. 107-113.