HAL Id: hal-01829439
https://hal.archives-ouvertes.fr/hal-01829439
Submitted on 4 Jul 2018HAL is a multi-disciplinary open access archive for the deposit and dissemination of sci-entific research documents, whether they are pub-lished or not. The documents may come from teaching and research institutions in France or abroad, or from public or private research centers.
L’archive ouverte pluridisciplinaire HAL, est destinée au dépôt et à la diffusion de documents scientifiques de niveau recherche, publiés ou non, émanant des établissements d’enseignement et de recherche français ou étrangers, des laboratoires publics ou privés.
Titanium Dioxide Nanotube Layers
Marie Siampiringue, Christophe Massard, Eric Caudron, Yves Sibaud,
Mohammed Sarakha, Komla Oscar Awitor
To cite this version:
Marie Siampiringue, Christophe Massard, Eric Caudron, Yves Sibaud, Mohammed Sarakha, et al.. Impact of Annealing Treatment on the Behaviour of Titanium Dioxide Nanotube Layers. Journal of Biomaterials and Nanobiotechnology, Scientific Research, 2016, 07 (03), pp.142 - 153. �10.4236/jbnb.2016.73015�. �hal-01829439�
http://dx.doi.org/10.4236/jbnb.2016.73015
How to cite this paper: Siampiringue, M., Massard, C., Caudron, E., Sibaud, Y., Sarakha, M. and Awitor, K.O. (2016) Impact of Annealing Treatment on the Behaviour of Titanium Dioxide Nanotube Layers. Journal of Biomaterials and Nanobiotech-nology, 7, 142-153. http://dx.doi.org/10.4236/jbnb.2016.73015
Impact of Annealing Treatment on the
Behaviour of Titanium Dioxide
Nanotube Layers
Marie Siampiringue1, Christophe Massard1*, Eric Caudron1, Yves Sibaud1, Mohammed Sarakha2,3, Komla Oscar Awitor1
1Clermont Université, Université d’Auvergne, Clermont-Ferrand, France
2Clermont Université, Université Blaise Pascal, Institut de Chimie de Clermont-Ferrand, Clermont-Ferrand, France 3Centre National de la Recherche Scientifique, Unité Mixte de Recherches 6296, Institut de Chimie de
Clermont-Ferrand, Aubiere, France
Received 19 February 2016; accepted 25 June 2016; published 28 June 2016 Copyright © 2016 by authors and Scientific Research Publishing Inc.
This work is licensed under the Creative Commons Attribution International License (CC BY). http://creativecommons.org/licenses/by/4.0/
Abstract
In this work, we study the influence of the annealing treatment on the behaviour of titanium dio-xide nanotube layers. The heat treatment protocol is actually the key parameter to induce stable oxide layers and needs to be better understood. Nanotube layers were prepared by electrochemi-cal anodization of Ti foil in 0.4 wt% hydrofluoric acid solution during 20 minutes and then an-nealed in air atmosphere. In-situ X-ray diffraction analysis, coupled with thermogravimetry, gives us an inside on the oxidation behaviour of titanium dioxide nanotube layers compared to bulk reference samples. Structural studies were performed at 700˚C for 12 h in order to follow the time consequences on the oxidation of the material, in sufficient stability conditions. In-situ XRD brought to light that the amorphous oxide layer induced by anodization is responsible for the si-multaneous growths of anatase and rutile phase during the first 30 minutes of annealing while the bulk sample oxidation leads to the nucleation of a small amount of anatase TiO2. The initial amorphous oxide layer created by anodization is also responsible for the delay in crystallization compared to the bulk sample. Thermogravimetric analysis exhibits parabolic shape of the mass gain for both anodized and bulk sample; this kinetics is caused by the formation of a rutile exter-nal protective layer, as depicted by the associated in-situ XRD diffractograms. We recorded that titanium dioxide nanotube layers exhibit a lower mean mass gain than the bulk, because of the presence of an initial amorphous oxide layer on anodized samples. In-situ XRD results also pro-vide accurate information concerning the sub-layers behavior during the annealing treatment for the bulk and nanostructured layer. Anatase crystallites are mainly localized at the interface oxide layer-metal and the rutile is at the external interface. Sample surface topography was
rized using scanning electron microscopy (SEM). As a probe of the photoactivity of the annealed TiO2 nanotube layers, degradation of an acid orange 7 (AO7) dye solution and 4-chlorophenol un-der UV irradiation (at 365 nm) were performed. Such titanium dioxide nanotube layers show an efficient photocatalytic activity and the analytical results confirm the degradation mechanism of the 4-chlorophenol reported elsewhere.
Keywords
Titanium Dioxide Nanotubes, In-Situ X-Ray Diffraction, Annealing Treatment, Photo-Degradation
1. Introduction
Researches on the synthesis and characterization of nanomaterial are in booming development nowadays since the initial definition of Richard P. Feynman in 1959 [1]. The characteristic size of these materials, in the nano-meter range, induces novel electronic, optical and mechanical properties and opens the way to the development of a wide variety of applications from the medical field [2] to electric batteries [3]. Among all the classes of na-nomaterials, the nanostructured transitional metal oxides such as nanowires, nanorods, and nanotubes have gained considerable interest considering the advantages of self-ordered metal oxide nanotube arrays on metal substrates [4]. Especially, titanium dioxide nanotube layers are very interesting platforms in order to develop research and applications in nanotechnology [5][6]. Numerous studies are dedicated to the understanding of the nanotube layers’ formation [7]-[9]. After electrochemical anodization of Ti foils, amorphous titanium dioxide nanotube layers are obtained [10]. Generally, this amorphous structure is too disordered, induces a lack of elec-tronic properties and is not convenient for the applications. Thermal treatments are performed in a variety of atmosphere. In air, a mixture of anatase and rutile is primarily obtained [11]. In order to develop photovoltaic applications, anatasetitania phase is researched [12]. Under annealing treatment, anatase and rutile are the pri-mary crystal structures obtained but a formation of brookite crystallites is reported between 470˚C and 500˚C in air [13]. In order to better understand the crystallization behaviour of titanium oxide nanotube arrays under an-nealing, in-situ X-ray diffraction is an efficient analytical tool [14]. In our work, we use in-situ X-ray diffraction analysis, coupled with thermogravimetry, to study the oxidation behaviours of titanium dioxide nanotube layers compared to bulk reference samples. These investigations are in extension of our already published work [15], concerning the evaluation of the photocatalytic activity versus the annealing temperature. In this previous work, we found that the annealing treatment at 400˚C was the most efficient, relative to a photodegradation kinetics. The novelty of the present study is that we take into account the stability of the annealed samples. Especially, the kinetics of the crystallographic phase’s transformation is of primary importance. Precisely, we focused on the annealing time in isothermal condition in order to investigate the layers evolution. A comparison has been done between nanostructured and bulk samples taken as reference. Photocatalytic tests were performed as a probe to assess the crystallinity of the annealed material. The mineralization of organic compounds using pho-to-induced reactions is a major issue for the decontamination of groundwater and wastewater submitted to or-ganic pollutants. Titania photooxidation of oror-ganic species involves reactive oxygen species (ROS) [16]. We investigated the photocatalytic activity of our TiO2 nanotube layers by monitoring the degradation of an acid
orange 7 (AO7) dye solution and 4-chlorophenol under UV irradiation. Experimental results showed an efficient photoactivity of the nanostructured surfaces. Analytical monitoring of the by-products of 4-chlorophenol degra-dation confirms the degradegra-dation mechanism reported previously [17].
2. Experimental Section
2.1. Chemical
4-Chlorophenol (4-CP) was purchased from Sigma. Acid Orange 7 (AO7) was purchased from Acros Organic. Benzoquinone and hydroquinone were purchased from Fluka. They were all used without further purifications. Methanol (HPLC grade), formic acid (≥95%), acetone and trichloroethylene were purchased from Sigma Al-drich. Stock solutions containing the desired concentrations of 4-chlorophenol (4-CP), hydroquinone (HQ) and
benzoquinone (BQ) were prepared in Milli-Q water.
2.2. Synthesis of Nanotube Layer
To fabricate anodic TiO2 nanotube layers, we used Ti foil (Goodfellow, 99.6% purity) with a thickness of 25 µm.
The Ti foil was degreased by successive sonification in trichloroethylene, acetone, and methanol, followed by rinsing with de-ionized water and blown dry with nitrogen. Anodization was carried out at room temperature (20˚C) in 0.4 wt% HF aqueous solution with the anodizing voltage maintained at 20 V [18]. The surface area of the anodized samples was approximatively 1.05 cm2.
2.3. Surface Characterization
The surface topography characterization of the anodized Ti foil was performed using a Zeiss Supra 55 VP scan-ning electron microscope (SEM) with secondary emission and in lens detectors. The accelerating voltage and the working distance were 3 kV and 5 mm, respectively.
2.4. Heat Treatment Protocol
High temperature studies were performed for 12 h at 700˚C in air using a Setaram TGDTA 92-1600 micro thermobalance for mass gain and a high temperature Anton PAAR HTK 1200 chamber with integrated sample spinner in a Philips X’pert MPD diffractometer for X-ray diffraction studies. The annealing condition (12 h at 700˚C) was chosen to promote the complete formation of rutile crystalline phase which is considered to be the most thermodynamically stable bulk phase in comparison with other possible TiO2 crystalline phases which are
respectively anatase and brookite (obtained at lower annealing temperatures) as underlined by several authors
[19][20].
2.5. Irradiation System
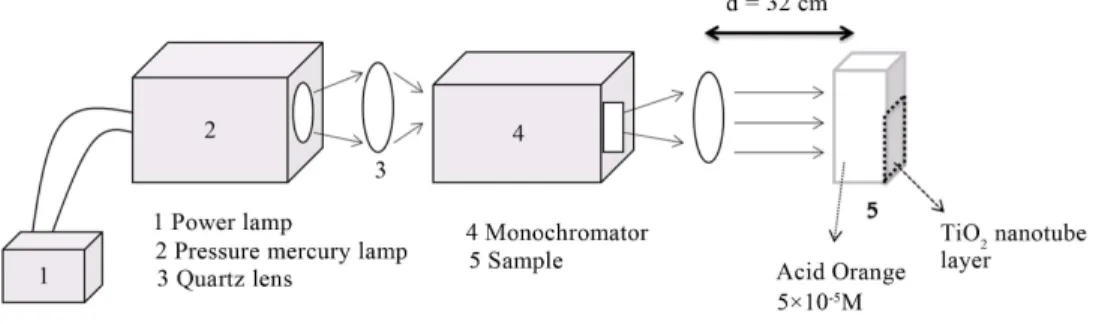
For the photocatalysis studies, the irradiations were carried out in monochromatic parallel beam in 1 cm (path length) quartz cell. The light source was a mercury lamp (200 W) equipped with an Oriel monochromator. The monochromatic irradiation was set at wavelength 365 nm (Figure 1). The light intensity was measured by fer-rioxalate actinometry [21]. The photon flux of the monochromatic irradiation was measured at 4.10 × 10¹⁵ pho-ton·s−1·cm−2 (23.8 W/m2).
2.6. Analytical Study
The photo-catalytic decomposition of 4-CP solution was monitored by the decrease of the solution’s absorbance at 280 nm (maximum absorption band of the 4-CP solution), using a Waters HPLC system. The HPLC system was equipped with a diode array (type 996) UV-Vis detector, an automatic injector (type 717), two pumps (type 600). To investigate the degradation of 4-CP under UV irradiation (365 nm), experiments were performed using a reverse phase Agilent column (Eclipse XDB C8, 250 mm × 4.6 mm, 5 µm). For analyses using HPLC, the
elu-tion was accomplished by water with formic acid (0.3%) and methanol (65/25, v/v) with flow rate of 1.0 mL/min and the injection volume was 30 µL.
Photodegradation of AO7 was also used as a probe to assess the photo-activity of the TiO2 layers. AO7 con-
taining azo bond is a model molecule commonly used to perform photocatalytic tests to simulate azo dyes wastewater pollutants coming from industries. Photo-catalytic experiments were conducted in aqueous solution of AO7 (from Acros Organics, also called Orange II) with a concentration of 5.0 × 10⁻⁵ mol·L−1, placed in a cy-lindrical glass reactor equipped with a magnetic stirrer. The glass reactor was irradiated with polychromatic flu-orescent UV lamps (Philips TDL 8 W) (total optical power, 1.3 W), in a configuration providing about 0.35 mW/cm2 at the sample surface. The photodegradation kinetics was recorded by assaying the AO7 solution sub-mitted to different UV irradiation time using a Perkin Elmer lambda 35 UV spectrophotometer. Quartz glass cells with an optical pathway of 1 cm were used. De-ionized water was taken as reference. The photodegrada-tion of the dye was followed by monitoring the decrease of the soluphotodegrada-tion’s absorbance at 483 nm (strong absorp-tion band of the Acid Orange 7).
3. Results and Discussion
3.1. TiO2 Nanotube Layer Characteristics
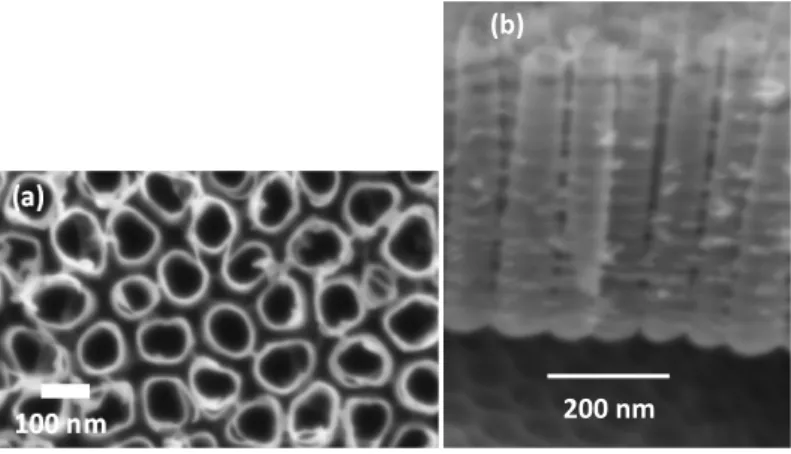
Figure 2 shows SEM images of the TiO2 nanotubes obtained by anodizing a Ti foil. We observe ordered
nano-tube arrays grown on top of the Ti foil with an oxide barrier layer separating the nanonano-tubes from the titanium foil. Figure 2(a) shows the top down image of the ordered array of TiO2 nanotube layers with a mean diameter
of approximately 100 nm. Figure 2(b) shows an oblique view of the TiO2 nanotubes. The tube length
deter-mined by accounting for foreshortening from this image was found to be approximately 430 nm.
3.2. Thermogravimetric Study
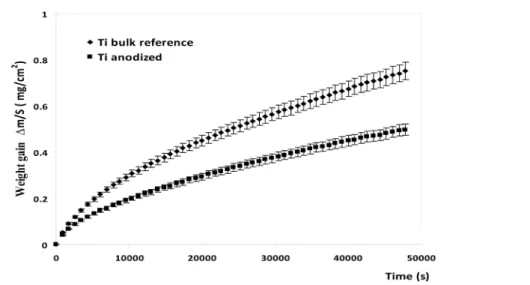
Three anodized and three bulk samples (total surface areas 3 cm2: and thicknesses: 25 µm) were tested by ther-mogravimetry to clearly observe the anodization effect on oxidation behaviour at 700˚C for 12 h. Figure 3
shows the mean mass gain versus time curves, for anodized and bulk reference titanium oxidized for 12 h at 700˚C under air.
This figure shows that both anodized and bulk samples exhibit parabolic oxidation rates due to the formation of a protective oxide layer near the surface (theses oxidation curves are characteristic of a diffusion of species limited by the growing oxide layer). Figure 3 also suggests that titanium anodization process promotes the for-mation of an initial protective TiO2 nanotubes layer because anodized samples exhibit a lower mean mass gain
versus time curve than those of bulk reference samples during the same annealing process. These results are in good agreement with several works showing the presence of TiO2 nanotubes after anodization if the titanium
foil is exposed to a sufficiently anodic voltage, in a particular electrochemical configuration, with an appropriate electrolyte composition, promoting the metal dissolution by oxidation reaction (M → Mn+
+ ne−) [22]. It is im-portant to note that high oxidation rates were mainly observed during the first 5 h or 6 h of the annealing process (formation of a continuous protective TiO2 layer) for both anodized and bulk reference samples. These results
have prompted us to carry out in-situ high temperature X-ray diffraction studies in order to understand the
Figure 2. SEM images of the TiO2 nanotubes obtained by anodizing a Ti foil. (a) Top down image of the ordered array of TiO2 nanotube layers with a mean diameter of approximately 100 nm; (b) An oblique view of the TiO2 nanotubes. The tube length determined from this image was found to be approximately 430 nm.
200 nm (b)
Figure 3. Mean mass gain vs. time curves of anodized and bulk reference tita-nium samples (T = 700˚C, 12 h in air).
different mass gain curve evolutions obtained by thermogravimetry in the case of anodized and bulk references samples.
3.3. In-Situ High Temperature X-Ray Diffraction Characterization of Bulk Reference Samples
In-situ high temperature X-ray diffraction analyses (T = 700˚C in air) were performed, using the CuKα1 = 1.5406
Å radiation, every 30 minutes for 12 hours on both anodized and bulk titanium samples to observe the initial nucleation stage of new compounds induced by the heat treatment.
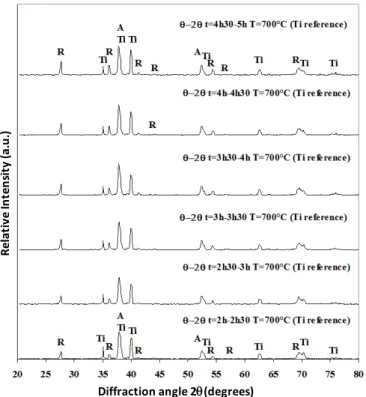
Figure 4 allows to determine that the initial bulk reference sample (before heat treatment) match with the hexagonal compact structure namely Tiα structure (JCPDS 44-1294). The initial samples were laminated (by Goodfellow) with the (002) preferential crystallographic orientation (2θ = 38.421˚) because the main peak (Rel-ative intensity: 100%) of Tiα powder is in fact at 2θ = 40.170˚ with the (101) preferential orientation. All peaks detected (2θ diffraction angles) on initial reference samples correspond to the main diffraction peaks (relative intensities higher than 10%) observed in the case of the Tiα hexagonal compact structure. This figure shows the initial nucleation stage of small amounts of anatase TiO2 (JCPDS 21-1272) during the first 30 min of heat
treat-ment with the (004) preferential orientation (2θ = 37.800˚) induced by the (002) preferential orientation of the titanium bulk sample. After the first 30 min the rutile TiO2 (JCPDS 21-1276) is also detected with (110)
prefe-rential orientation (corresponding to the main rutile characteristic peak (2θ = 27.446˚; relative intensity: 100%)) which is independent of the orientation of the titanium bulk sample. Moreover, after the first hour of heat treat-ment the evolution of the asymmetric peak near 2θ = 38˚ which corresponds in fact to the overlapping of anatase
(2θ = 37.800˚) and titanium (2θ = 38.421˚) peaks clearly indicates the growth of anatase phase (increasing peak)
on titanium bulk sample (decreasing peak). This figure also underlines the continuous growth of the rutile phase during the first 2 h 30 of the heat treatment by the increase of the number of characteristic peaks and the increase in their intensities.
In-situ high temperature X-ray diffraction analyses performed between 2 h and 5 h (Figure 5) show increases
in intensity only for the rutile characteristic peaks. These results suggest that anatase crystallites are mainly lo-calized at the interface oxide layer-metal and the rutile layer is at the external interface.
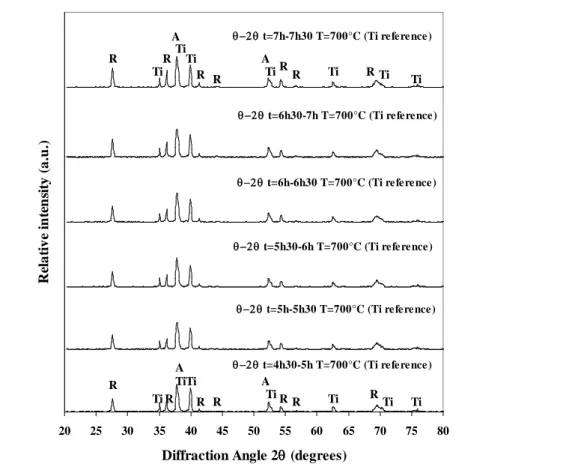
X-ray diffraction analyses performed between 4 h 30 and 7 h 30 (Figure 6) suggest the formation of a protec-tive rutile layer because rutile characteristic peak intensities increase slowly and consequently no significant peak intensity evolutions were observed for the sublayers (i.e.: anatase and titanium). Same conclusions could be done concerning X-ray diffraction analyses performed between 7 h and 12 h. In-situ X-ray diffraction results are in good agreement with thermogravimetric analyses performed on titanium bulk samples (Figure 3), show-ing a decrease of the oxidation rate after 5 h of annealshow-ing (suggestshow-ing the formation of a continuous protective oxide layer).
Figure 4. Initial sample and in-situ high temperature first 2 h 30 min XRD experimental diffractograms performed on titanium bulk reference sample at T = 700˚C in air (Ti: titanium, A: anatase, R: rutile).
Diffraction angle 2θ(degrees)
Re la tiv e In te ns ity (a .u .)
Figure 5. In-situ high-temperature XRD experimental diffractograms performed on titanium bulk ref-erence sample annealed at T = 700˚C in air (Ti: titanium, A: anatase, R: rutile) from 2 h to 5 h.
Figure 6. In-situ high-temperature XRD experimental diffractograms performed on titanium bulk ref-erence sample annealed at T = 700˚C in air (Ti: titanium, A: anatase, R: rutile) from 4 h 30 to 7 h 30. 3.4. In-Situ High Temperature X-Ray Diffraction Characterization of Anodized Samples In-situ high temperature X-ray diffraction analyses performed on titanium anodized sample during the first 2 h 30 of annealing are given in Figure 7.
X-ray diffraction analyses obtained before heat treatment and thermogravimetric results suggest that anodiza-tion process promotes in fact the formaanodiza-tion of an amorphous oxide layer on nanotube surface as underlined by several works on anodized titanium [23][24]. This amorphous oxide layer induces two phenomena during the first 30 minutes of annealing (in comparison with bulk reference sample (Figure 4)): firstly the simultaneous growths of anatase and rutile phases and secondly the rutile and anatase initial nucleation stage with their normal crystallographic growth orientations (anatase (101) at 2θ = 25.281˚ and rutile (110) at 2θ = 27.446˚) are inde-pendent of laminated titanium bulk (002) preferential orientation. After the first 30 min of annealing, X-ray analyses show an important increase in intensity of the main rutile (110) characteristic peak which seems to suggest a delay to crystallise the initial amorphous oxide layer.
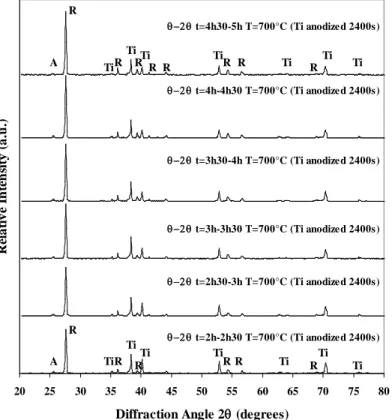
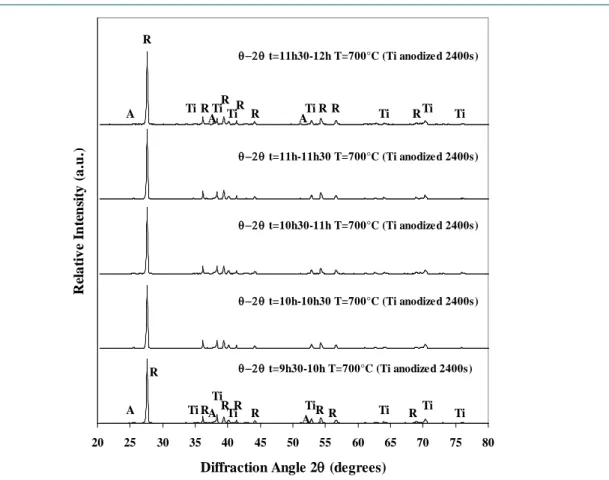
It is important to note that the high intensity of the rutile X-ray diffraction peak is due to the crystallisation of the amorphous layer all along nanotube surfaces (anodization promoting a highest surface area compared to bulk sample) rather than the growth of a thicker oxide layer than those of bulk sample. After one hour of annealing, rutile diffraction peak becomes the highest peak observed on X-ray diffractogram whereas no intensity evolution is observed for the main anatase diffraction peak. These results also suggest that anatase crystallites are mainly localized at the oxide layer-metal interface under the rutile external layer. In-situ high temperature X-ray dif-fraction analyses show the continuous increase of the main rutile characteristic peak for the first 5 h of annealing (Figure 7 and Figure 8) as in the case of bulk sample. After the first 5 h of annealing, no significant evolution of the main rutile characteristic peak is observed (Figure 9). These results are in good agreement with thermo-gravimetric analyses suggesting the formation of a continuous protective oxide layer. It is important to note that similar anatase main diffraction peak intensities are observed during the 12 h of annealing which seems to indi-cate a continuous transformation at the internal interface metal → anatase → rutile (most stable titanium oxide)
20 25 30 35 40 45 50 55 60 65 70 75 80
Diffraction Angle 2θ (degrees)
R el a ti v e i n te n si ty (a .u .) θ−2θ t=5h-5h30 T=700°C (Ti reference) θ−2θ t=5h30-6h T=700°C (Ti reference) θ−2θ t=6h-6h30 T=700°C (Ti reference) θ−2θ t=6h30-7h T=700°C (Ti reference) θ−2θ t=7h-7h30 T=700°C (Ti reference) R R A Ti Ti R R R R R R R R R R Ti Ti Ti Ti Ti Ti Ti Ti Ti Ti Ti θ−2θ t=4h30-5h T=700°C (Ti reference) Ti R R A A A
Figure 7. In-situ high-temperature XRD experimental diffractograms performed on titanium anodized sample annealed at T = 700˚C in air (Ti: titanium, A: anatase, R: rutile) from 0 h to 2 h 30.
Figure 8. In-situ high-temperature XRD experimental diffractograms performed on titanium anodized sample annealed at T = 700˚C in air (Ti: titanium, A: anatase, R: rutile) from 2 h to 5 h.
20 25 30 35 40 45 50 55 60 65 70 75 80
Diffraction Angle 2θ (degrees)
R el a ti v e I n te n si ty (a .u .)
θ-2θ before heat treatment (Ti anodized 2400s) θ−2θ t=0h-0h30 T=700°C (Ti anodized 2400s) θ−2θ t=0h30-1h T=700°C (Ti anodized 2400s) θ−2θ t=1h-1h30 T=700°C (Ti anodized 2400s) θ−2θ t=1h30-2h T=700°C (Ti anodized 2400s) θ−2θ t=2h-2h30 T=700°C (Ti anodized 2400s) R R A A Ti Ti Ti R R R R R R R R R R R R Ti Ti Ti Ti Ti Ti Ti Ti Ti Ti Ti A A Ti Ti R R Ti R R A A 20 25 30 35 40 45 50 55 60 65 70 75 80
Diffraction Angle 2θ (degrees)
R el a ti v e I n te n si ty (a .u .) θ−2θ t=2h30-3h T=700°C (Ti anodized 2400s) θ−2θ t=3h-3h30 T=700°C (Ti anodized 2400s) θ−2θ t=3h30-4h T=700°C (Ti anodized 2400s) θ−2θ t=4h-4h30 T=700°C (Ti anodized 2400s) θ−2θ t=4h30-5h T=700°C (Ti anodized 2400s) R R A A Ti Ti R R R R R R R R R R R R Ti Ti Ti Ti Ti Ti Ti Ti Ti Ti Ti θ−2θ t=2h-2h30 T=700°C (Ti anodized 2400s) Ti
Figure 9. In-situ high-temperature XRD experimental diffractograms performed on titanium anodized
sample annealed at T = 700˚C in air (Ti: titanium, A: anatase, R: rutile) from 9 h 30 to 12 h.
all along the heat treatment process.
3.5. Photodegradation Studies of Acid Orange (AO7)
The photo-degradation experiments of AO7 in the presence of TiO2 nanotubes under different conditions are
summarized in Figure 10. The initial concentration of the AO7 is 5.0 × 10⁻⁵ mol/L, at constant pH = 7. On Fig-ure 10, curve (c) shows the photo-degradation of AO7 under UV light without TiO2. This result shows that the
AO7 is not degraded by UV radiation alone. The curve (a) shows that the amount of AO7 in the presence of TiO2 nanotube for 24 h without UV was 5% lower. Thus, the effect of the adsorption of the dye on the TiO2
sur-face is small. The same is also observed for the curve (b) in presence of UV light. The curve (d) illustrates the photodegradation of AO7 after that sample has been anodized during 20 minutes and annealed at 700˚C. We observed a complete disappearance of the AO7 dye after 24 h. This optical result confirms the degradation of the organic molecule under UV irradiations in presence of the annealed nanotubes of TiO2. In this case, the kinetic
of degradation of AO7 follows a pseudo-first order and the rate constant is determined at 0.22 h−1.
The Figure 11 shows typical UV-visible spectra obtained during UV irradiation (365 nm) of AO7 in the presence of TiO2 nanotube annealed at 700˚C and anodized during 20 minutes. These spectra clearly show that
the absorbance of the characteristic band of AO7 at 485 nm decreases as function of irradiation time. After 22 h of irradiation, the solution of the AO7 becomes colourless.
3.6. Photodegradation of 4-Chlorophenol: An Analytical Study
Upon irradiation of 4-CP with nanotube layer of TiO2, the organic compound disappearance was observed
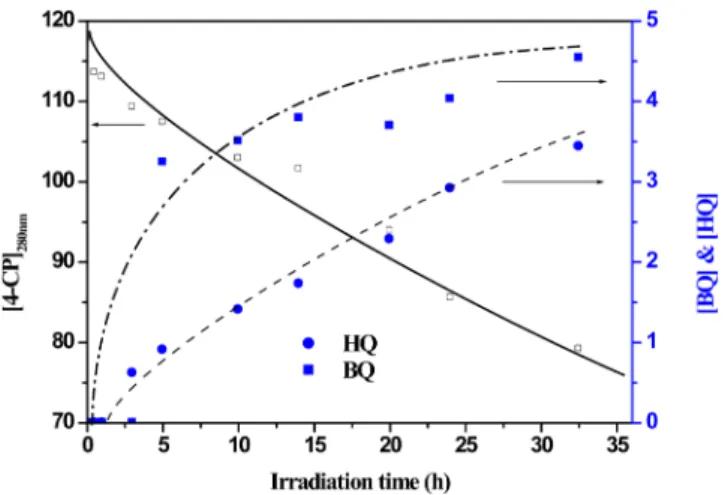
to-gether with the formation of 2 by-products: P1 and P2. The two of them have been formally identified by in-jecting commercial compounds. The first of them (P1) was identified as hydroxyquinone, and the second (P2) as benzoquinone. The Figure 12 shows the evolution of the 4-chlorophenol, the hydroxyquinone (HQ) and the
20 25 30 35 40 45 50 55 60 65 70 75 80
Diffraction Angle 2θ (degrees)
R el a ti v e I n te n si ty (a .u .) θ−2θ t=10h-10h30 T=700°C (Ti anodized 2400s) θ−2θ t=10h30-11h T=700°C (Ti anodized 2400s) θ−2θ t=11h-11h30 T=700°C (Ti anodized 2400s) θ−2θ t=11h30-12h T=700°C (Ti anodized 2400s) R R A A Ti Ti R R R R R R R R R R R R Ti Ti Ti Ti Ti Ti Ti Ti Ti Ti Ti Ti θ−2θ t=9h30-10h T=700°C (Ti anodized 2400s) A A R R A A
Figure 10. Kinetics of photodegradation of acid orange 7 (AO7) dye under UV lamp irradia-tion at 365 nm in the presence of TiO2 nanotube layer, as measured by absorbance of the irra-diated dye at 485 nm. (a) AO7 with TiO2 nanotube layer without UV; (b) Unannealed TiO2 nanotube layer; (c) AO7 only with UV; (d) TiO2 nanotube layer annealed at 700˚C.
Figure 11. Absorption versus irradiation time for the acid orange (AO7) under irradiation at 365 nm, in the presence of TiO2nanotube layers annealed at 700˚C anodized during 20 mi-nutes, with range of exposure time between 0 min and 1280 min.
Figure 12. Concentration kinetic of 4-CP (□), benzoquinone (■) and hydroxyquinone (●) as function of irradiation time. [4-CP] = 120 µM, TiO2 nanotube, annealed at 700˚C, under UV light irradiation (365 nm). 200 250 300 350 400 450 500 550 600 0.0 0.3 0.6 0.9 1.2 1.5 1280 min 0 min 254 nm 485 nm A bs or ba nc e ( u. a) λ (nm) 0 min 15 min 30 min 45 min 60 min 90 min 120 min 240 min 420 min 1280min
OH Cl OH OH Cl H H OH OH O O (TiO2) +HO -Cl +2h+/-2H+ 4-CP HQ BQ (a) (b) (c)
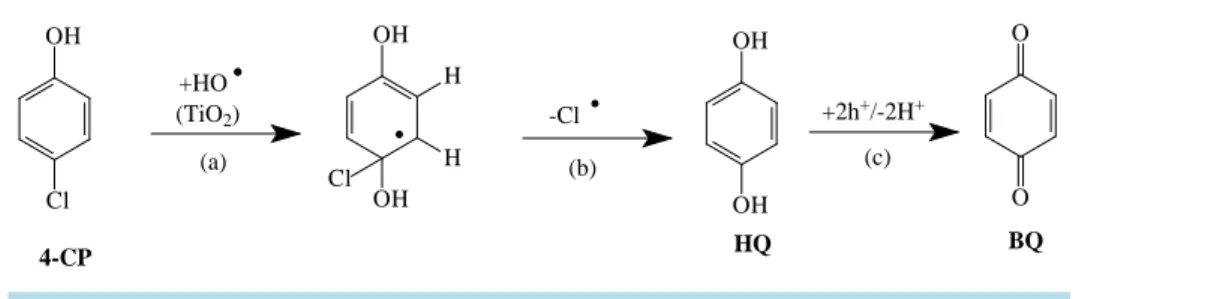
Figure 13. Degradation scheme of the photocatalytic degradation of 4-CP.
benzoquinone (BQ) versus irradiation time. The both photoproduct are apparently formed with a period of in-duction (after 2.5 h of irradiation) and accumulated with irradiation time up to a maximum of 4.5 µM for BQ and 3.5 µM for HQ after 35 h. Its concentrations account for over 34% of 4-chlorophenol degradation.
At the same time, another byproduct is also detected but no possible to quantify. This product is expected to be the hydroxybenzoquinone (HQB) as described in literature [25]. This compound appears at the same time of irradiation as hydroxyquinone (HQ) with the same induction period (after 2.5 h).
Taking into account the identification of the byproducts the envisaged pathway of photocatalytic decomposi-tion of 4-chlorophenol is illustrated in Figure 13, in agreement with other work [17]. The first oxidation product of 4-CP is the hydroquinone (HQ) and then the benzoquinone (BQ). The HQ is formed when a hydroxyl radical takes places in para-position (reaction a). Then a chloride ion is released (reaction b). Furthermore, the HQ can be either oxidized to BQ (reaction c).
4. Conclusions
This study allows us to follow successfully the oxidation behaviour of titanium dioxide nanotube layers under the annealing treatment. In-situ high temperature X-ray diffraction first reveals, on anodized samples, the build-ing of a substantial amorphous oxide layer, and then the simultaneous growths of anatase and rutile phases occur. Ultimately, initial nucleation stage of rutile and anatase takes place, for the anodized samples, with their normal crystallographic growth orientations, contrary to the heating of the bulk reference sample where nucleation fol-lows the preferential orientation of laminated titanium bulk (002). The initial amorphous oxide layer is responsi-ble for the lower mass gain recorded on the anodized samples compared to bulk material. The external rutile layer, detected after a longer annealing time, induces the parabolic shapes of the mass gain curves.
The photodegradation study of acid orange 7 using annealed nanotubes layer attests the photocatalytic activity of the annealed samples. A complete disappearance of the organic dye after 25 h of irradiation is recorded. Concerning the photodegradation of 4-chlorophenol, two by-products hydroxyquinone (HQ) and benzoquinone (BQ) are identified by HPLC analysis after a 2.5 h period of induction. Taking into account the chemical struc-tures of these compounds, this analytical result seems to confirm the reaction pathway often found without ex-perimental evidence in the literature. These results are a contribution to a better understanding of the different crystallization steps of titanium dioxide nanotube layers submitted to the annealing treatment. This work opens the way to the optimization of annealing parameters in order to obtain stable nanostructured layers required to counter corrosion in the field of titanium nanostructured prostheses.
References
[1] Feynman, R. (1960) There’s Plenty of Room at the Bottom. Engineering and Science, 23, 22-36.
http://resolver.caltech.edu/CaltechES:23.5.1960Bottom
[2] Dong, L., Craig, M., Khang, K. and Chen, C. (2012) Applications of Nanomaterials in Biology and Medicine. Journal of Nanotechnology, 2012, Article ID: 816184, 2 p.
[3] Vinayan, B.P., Schwarzburger, N. and Fichtner, M. (2014) Synthesis of a Nitrogen Rich (2D-1D) Hybrid Carbon Na-nomaterial Using a MnO2 Nanorod Template for High Performance Li-Ion Battery Applications. Journal of Materials Chemistry A, 3, 6810-6818. http://dx.doi.org/10.1039/C4TA05642F
[4] Galstyan, V., Comini, E., Fagliaa, G. and Sberveglieria, G. (2014) Synthesis of Self-Ordered and Well-Aligned Nb2O5 Nanotubes. CrystEngComm, 6, 10273-10279. http://dx.doi.org/10.1039/C4CE01540A
[5] Pervez, S., Kim, D., et al. (2014) High Areal Capacity for Battery Anode Using Rapidly Growing Self-Ordered TiO2 Nanotubes with a High Aspect Ratio. Materials Letters, 137, 347-350. http://dx.doi.org/10.1016/j.matlet.2014.09.032
[6] Birjandinejad, A., Peivandi, M.T., Kachooei, A.R., Razi, A., Amelfarzad, S. and Omidi, K.F. (2014) The Necessity of MRI in Acute and Mild Knee Trauma. Journal of American Science, 10, 1-4.
[7] Roman, I., DoinaTrusca, R., et al. (2014) Titanium Dioxide Nanotube Films: Preparation, Characterization and Elec-trochemical Biosensitivity towards Alkaline Phosphatase. Materials Science and Engineering: C, 37, 374-382.
http://dx.doi.org/10.1016/j.msec.2014.01.036
[8] Kapusta-Kołodziej, J., Tynkevych, O., et al. (2014) Electrochemical Growth of Porous Titanium Dioxide in a Glyce-rol-Based Electrolyte at Different Temperatures. Electrochimica Acta, 144, 127-135.
http://dx.doi.org/10.1016/j.electacta.2014.08.055
[9] Jarosz, M., Pawlik, A., et al. (2014) Effect of the Previous Usage of Electrolyte on Growth of Anodic Titanium Dio-xide (ATO) in a Glycerol-Based Electrolyte. Electrochimica Acta, 136, 412-421.
http://dx.doi.org/10.1016/j.electacta.2014.05.077
[10] Smith, Y.R., Ray, R., et al. (2013) Self-Ordered Titanium Dioxide Nanotube Arrays: Anodic Synthesis and Their Pho-to/ Electro-Catalytic Applications. Materials, 6, 2892-2957. http://dx.doi.org/10.3390/ma6072892
[11] Mahajan, V.K., Misra, M., et al. (2008) Self-Organized TiO2 Nanotubular Arrays for Photo Electrochemical Hydrogen Generation: Effect of Crystallization and Defect Structures. Journal of Physics D: Applied Physics, 41, Article ID: 125307. http://dx.doi.org/10.1088/0022-3727/41/12/125307
[12] Oh, H.J., Hock, R., et al. (2013) Phase Transformation and Photocatalytic Characteristics of Anodic TiO2 Nanotubular Film. Journal of Physics and Chemistry of Solids, 74, 708-715. http://dx.doi.org/10.1016/j.jpcs.2013.01.008
[13] Kang, X. and Chen, S. (2010) Photocatalytic Reduction of Methylene Blue by TiO2 Nanotube Arrays: Effects of TiO2 Crystalline Phase. Journal of Materials Science, 45, 2696-2702. http://dx.doi.org/10.1007/s10853-010-4254-5
[14] Verissimo, N.C. and Cremasco, A. (2014) In Situ Characterization of the Effects of Nb and Sn on the Anatase-Rutile Transition in TiO2 Nanotubes Using High-Temperature X-Ray Diffraction. Applied Surface Science, 307, 372-381.
http://dx.doi.org/10.1016/j.apsusc.2014.04.040
[15] Awitor, K.O., Rafqah, S., et al. (2008) Catalysis Using Titanium Dioxide Nanotube Layers. Journal of Photo-chemistry and Photobiology A: Chemistry, 2-3, 250-254. http://dx.doi.org/10.1016/j.jphotochem.2008.05.023
[16] Hashimoto, K. and Irie, H. (2005) TiO2 Photocatalysis: A Historical Overview and Future Prospects. Journal of Ap-plied Physics, 44, 8269-8285. http://dx.doi.org/10.1143/JJAP.44.8269
[17] Theurich, J., Lindner, M. and Bahnemann, D.W. (1996) Photocatalytic Degradation of 4-Chlorophenol in Aerated Aqueous Titanium Dioxide Suspensions: A Kinetic and Mechanistic Study. Langmuir, 12, 6368-6376.
http://dx.doi.org/10.1021/la960228t
[18] Macak, J., Tsuchiya, H., et al. (2007) TiO2 Nanotubes: Self-Organized Electrochemical Formation, Properties and Ap-plications. Current Opinion in Solid Solid State and Materials Science, 11, 3-18.
http://dx.doi.org/10.1016/j.cossms.2007.08.004
[19] Gemelli, E. and Camargo, N.H.A. (2007) Oxidation Kinetics of Commercially Pure Titanium. Revista Material, 12, 525-531. http://dx.doi.org/10.1590/s1517-70762007000300014
[20] Tsuchiya, H. and Macak, J.M. (2005) Self-Organized Porous TiO2 and ZrO2 Produced by Anodization. Corrosion Science, 47, 3324-3330. http://dx.doi.org/10.1016/j.corsci.2005.05.041
[21] Calvert, J.G. and Pitts, J.N. (1966) Photochemistry. Journal of the Franklin Institute, 284, 147-148.
[22] Prakasam, H.E., Shankar, K., et al. (2007) A New Benchmark for TiO2 Nanotube Array Growth by Anodization. The Journal of Physical Chemistry C, 111, 7235-7241. http://dx.doi.org/10.1021/jp070273h
[23] Berger, S., Ghicov, A., et al. (2009) Transparent TiO2 Nanotube Electrodes via Thin Layer Anodization: Fabrication and Use in Electrochromic Devices. Langmuir, 25, 4841-4844. http://dx.doi.org/10.1021/la9004399
[24] Macak, J.M., Zlamal, M., et al. (2007) Self-Organized TiO2 Nanotube Layers as Highly Efficient Photocatalysts. Small,
2, 300-304. http://dx.doi.org/10.1002/smll.200600426
[25] Oudjehani, K. and Boule, P. (1992) Photoreactivity of 4-Chlorophenol in Aqueous Solution. Journal of Photochemistry and Photobiology A: Chemistry, 68, 363-373. http://dx.doi.org/10.1016/1010-6030(92)85245-P