[16:53 30/6/2010 Bioinformatics-btq307.tex] Page: 1922 1922–1923
BIOINFORMATICS
APPLICATIONS NOTE
Vol. 26 no. 15 2010, pages 1922–1923doi:10.1093/bioinformatics/btq307Data and text mining
Advance Access publication June 10, 2010Large-scale benchmark of Endeavour using MetaCore maps
Sven Schuierer
1,∗, Léon-Charles Tranchevent
2,3,∗, Uwe Dengler
1and Yves Moreau
2,3 1Novartis Pharma AG, Postfach, CH-4002 Basel, Switzerland,2Department of Electrical Engineering ESAT-SCD and 3SymBioSys Center for Computational Systems Biology, Katholieke Universiteit Leuven, Leuven, BelgiumAssociate Editor: Jonathan Wren
ABSTRACT
Summary: Endeavour is a tool that detects the most promising
genes within large lists of candidates with respect to a biological process of interest and by combining several genomic data sources. We have benchmarked Endeavour using 450 pathway maps and 826 disease marker sets from MetaCoreTM of GeneGo, Inc. containing a total of 9911 and 12 432 genes, respectively. We obtained an area under the receiver operating characteristic curves of 0.97 for pathway and of 0.91 for disease gene sets. These results indicate that Endeavour can be used to efficiently prioritize candidate genes for pathways and diseases.
Availability: Endeavour is available at http://www.esat.kuleuven.be/
endeavour
Contact: sven.schuierer@novartis.com; leon-charles.tranchevent @esat.kuleuven.be
Supplementary information: Supplementary data are available at
Bioinformatics online.
Received on December 1, 2009; revised on May 14, 2010; accepted on June 4, 2010
1 INTRODUCTION
Identifying disease causing genes is a key challenge in human genetics. In the process of identifying such disease genes, researchers are often confronted with large lists of candidate genes among which only one or a few are actually causal. The validation of each candidate is often too costly and time consuming, so that only a few candidates are further experimentally validated. A related problem arises when trying to identify new members of a biological pathway. The selection of a small subset of optimal candidates for validation is called gene prioritization. Since going manually through all possible sources of information is a slow and tedious process, several bioinformatics methods have been developed to tackle this problem (Oti and Brunner, 2007; Zhu and Zhao, 2007). We previously developed Endeavour (Aerts et al., 2006; Tranchevent
et al., 2008) whose key feature is that it uses multiple genomic
data sources (e.g. sequence, expression, literature and annotation) to estimate how promising a candidate gene is by measuring its similarity with a set of training genes. The training genes are genes which are already known to play a role in the biological process under study. The underlying assumption is that the most promising candidate genes are the ones that exhibit many similarities with the training genes. A schematic view of the algorithm is shown in Figure 1. Originally, Endeavour was benchmarked by leave-one-out cross-validations on 32 gene sets corresponding to
∗To whom correspondence should be addressed.
Fig. 1. The Endeavour algorithm. (A) The inputs are, on the one hand, the
training genes (on top, in red), known to be involved in the process of interest, and, on the other hand, the candidate genes to prioritize (at the bottom, in grey and orange). (B) Data are collected for these genes: e.g. expression profiles, functional annotations and protein–protein interactions. (C) Candidate genes are prioritized, i.e. ranked according to their similarities to the training genes. For example, the gene in orange is the most promising candidate (i.e. it ranks in first position) because (i) its expression profile is similar to the red ones, (ii) it also shares several functional annotations and (iii) it is interacting with several training proteins.
3 bio-molecular pathways and 29 genetic diseases, representing around 700 prioritizations in total (Aerts et al., 2006). In the current study, we briefly report on the largest benchmark to date for a gene prioritization method using 1276 pathways and diseases from MetaCore and prioritizing a total of 22 343 genes.
2 METHODS
We used the MetaCoreTM Pathway Maps and Disease Marker Sets as provided by GeneGo, Inc. in October 2008. This resulted in 450 pathway maps containing a total of 9911 genes, and 826 disease marker sets containing a total of 12 432 genes (see Supplementary Material). In addition, the OMIM and Gene Ontology based benchmarks were built as described in Aerts et al. (2006), see also Supplementary Material. The Endeavour prioritization platform was accessed remotely using a secured connection from a command line interface allowing the automatic processing of thousands of prioritizations.
3 RESULTS
The cross-validation procedure measures the ability of the program to capture the information of the known genes and to correctly use this information to prioritize the left-out gene. To assess the ability
[16:53 30/6/2010 Bioinformatics-btq307.tex] Page: 1923 1922–1923 Endeavour using MetaCore maps
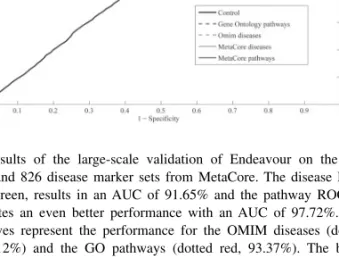
Fig. 2. Results of the large-scale validation of Endeavour on the 450
pathways and 826 disease marker sets from MetaCore. The disease ROC curve, in green, results in an AUC of 91.65% and the pathway ROC, in red, indicates an even better performance with an AUC of 97.72%. The dotted curves represent the performance for the OMIM diseases (dotted green, 94.12%) and the GO pathways (dotted red, 93.37%). The black curve serves as a control (49.86%). The optimal control experiment would consist of shuffled gene sets but randomly selected gene sets were used as an approximation. AUCs for diseases and pathways are significantly larger than the control AUC (Wilcoxon rank sum<1e-6).
of Endeavour to capture the information of known pathway and disease-related gene sets, we used the pathways maps and disease marker sets of MetaCoreTMfrom GeneGo, Inc. Since the gene sets in MetaCore are manually curated, we consider them as a reliable representation of the current knowledge of the functional contexts in which the genes are active. We have benchmarked Endeavour using 450 pathway maps and 826 disease marker sets containing a total of 9911 pathway members and 12 432 disease genes, respectively. In addition, we have also benchmarked 29 OMIM diseases and 37 Gene Ontology pathways that contain 620 and 1216 genes, respectively. For each prioritization run, the position of the left-out gene among 99 randomly chosen candidates is recorded (see also Supplementary Material). We use the area under the receiver operating characteristic (ROC) curves (AUC) as a measure of the performance. We obtained an AUC of 0.97 for the MetaCore pathways. Moreover, 64% of the prioritizations have the left-out gene being ranked in the first position. The AUC value obtained for the MetaCore disease marker sets is 0.91 and 33% of the prioritizations have the left-out gene being ranked in the first position (Fig. 2). The AUC values obtained for the Gene Ontology pathways and OMIM diseases are 0.93 and 0.94, respectively. Altogether, the results indicate that Endeavour efficiently prioritizes candidate genes for both pathways and diseases. As observed and discussed in our previous work (Aerts et al., 2006), the performance of gene prioritization is higher for pathways than for disease marker sets because data sources such as Gene Ontology contain pathway specific information and
because diseases often implicate a complex set of cascades making their profiling more challenging. Furthermore, the performance is higher for OMIM diseases than for MetaCore diseases because the MetaCore sets include markers derived from gene expression studies whereas the OMIM sets only rely on known causative genes. Such markers are indirectly associated to the disease and it is therefore harder to prioritize them. Assessing the performance of a novel type of bioinformatics tool, such as gene prioritization methods, is of crucial importance. Our large-scale benchmark demonstrates the effectiveness of Endeavour. It should be noted that the evaluation was carried out at Novartis by S. Schuierer and U. Dengler independently of the core Endeavour team. In particular, the Endeavour platform was used as is and no parameter fine tuning was performed (i.e. all available data sources were used, see also Supplementary Material). We are aware of the many pitfalls of benchmarking gene prioritization and function prediction methods (Myers et al., 2006), so that the performance observed in cross-validation studies is likely to be higher than that observed in prospective studies. We have recently conducted such a prospective validation in Drosophila (Aerts et al., 2009), which also confirmed further the effectiveness of our strategy.
ACKNOWLEDGEMENTS
We want to thank July Bryant and Yuri Nikolsky of GeneGo, Inc. for many helpful discussions. We also want to thank Stefan Grzybek for his support during the project, and the anonymous reviewers for their thorough review of our article.
Funding: Research Council KUL (GOA AMBioRICS, CoE
EF/05/007 SymBioSys, PROMETA); the Flemish Government (G.0241.04, G.0499.04, G.0232.05, G.0318.05, G.0553.06, G.0302.07, ICCoS, ANMMM, MLDM, G.0733.09, G.082409, GBOU-McKnow-E, GBOU-ANA, TAD-BioScope-IT, Silicos,
SBO-BioFrame, SBO-MoKa, TBM-Endometriosis,
TBM-IOTA3, O&O-Dsquare); the Belgian Federal Science Policy Office (IUAP P6/25); the European Research Network on System Identification (ERNSI; FP6-NoE, FP6-IP, FP6-MC-EST, FP6-STREP, FP7-HEALTH).
Conflict of Interest: none declared.
REFERENCES
Aerts,S. et al. (2006) Gene prioritization through genomic data fusion. Nat. Biotechnol.,
24, 537–544.
Aerts,S. et al. (2009) Integrating computational biology and forward genetics in Drosophila. PLoS Genet., 5, e1000351.
Myers,C.L. et al. (2006) Finding function: evaluation methods for functional genomic data. BMC Genomics, 7, 187.
Oti,M. and Brunner,H.G. (2007) The modular nature of genetic diseases. Clin. Genet.,
71, 1–11.
Tranchevent,L.C. et al. (2008) ENDEAVOUR update: a web resource for gene prioritization in multiple species. Nucleic Acids Res., 36, W377–W384. Zhu,M. and Zhao,S. (2007) Candidate gene identification approach: progress and
challenges. Int. J. Biol. Sci., 3, 420–427.