Advance Access publication 28 October 2008
Introduction
Obstructive sleep apnoea (OSA), a common and frequently undiagnosed medical disorder in adults ( Young et al. , 2002 ), is characterized by recurrent pharyngeal airway obstruction during sleep. Frequent episodes of hypoxia and awakenings disrupt continuous sleep and even mild OSA is associated with signifi cant morbidity ( Young et al. , 2002 ). While OSA, or sleep disordered breathing, has been reported in adolescents and children ( Guilleminault et al. , 1976 ;
Contencin et al. , 2003 ), it is most common in middle-aged adults ( Young et al. , 2002 ). The reasons for the greater incidence of this disorder in later life are due to obesity ( Martin et al. , 1997 ; Finkelstein et al. , 2001 ; Young et al. , 2002 ), family background ( Mathur and Douglas, 1995 ; Schwab et al. , 2006 ), or natural physiological changes. It has been observed that the depth of the oropharyngeal airway decreases with age ( Martin et al. , 1997 ), and that the soft palate becomes longer and thicker ( Johnston and Richardson, 1999 ). Supine posture and physiological decrease of muscular tonus during sleep cause additional signifi cant reductions of pharyngeal airway dimensions ( Pae et al. , 1994 ; Martin et al. , 1997 ; Smith and Battagel, 2004 ).
When the airway and associated structures were examined, both snorers and OSA subjects exhibited reduced anteroposterior dimensions, narrower airways, reduced oropharyngeal areas, and larger tongues ( Lowe et al. , 1986b ; Battagel and L’Estrange, 1996 ; Battagel et al. , 2000 ).
According to cephalometric studies, OSA patients seem to have shorter ( Battagel et al. , 2000 ) and more retrognathic mandibles and also an anteroposterior discrepancy between the maxilla and mandible ( Lowe et al. , 1995 ). Furthermore, it has been shown that there is a correlation between the minimum axial cross-sectional area of the oropharyngeal lumen and oxygen saturation and quantity, as well as the duration of apnoea episodes ( Avrahami and Englender, 1995 ). Previous reports ( Launois et al. , 1993 ; Morrison et al. , 1993 ) have emphasized the signifi cance of the most constricted sites (retropalatal and retroglossal) of the upper airway in airfl ow dynamics. It is at such sites in the upper airway that critical narrowing is likely to occur, and therefore changes in the dimension of these sites are of particular importance ( Ono et al. , 2000 ).
Lateral cephalometry is an established tool in the investigation of the airway in OSA subjects and it has been employed for diagnostic purposes ( Battagel et al. , 2000 ;
Long-term changes in pharyngeal airway dimensions following
activator-headgear and fi xed appliance treatment
Michael P. Hänggi * , Ullrich M. Teuscher * , Malgorzata Roos ** and Timo A. Peltomäki *
* Clinic for Orthodontics and Pediatric Dentistry and ** Institute of Social and Preventive Medicine, Biostatistics Unit, University of Zurich, Switzerland
SUMMARY The aim of this study was to evaluate changes in the pharyngeal airway in growing children and adolescents and to compare these with a group of children who received activator-headgear Class II treatment. The sample consisted of 64 children (32 males and 32 females), 32 had a combined activator-headgear appliance for at least 9 months (study group) followed by fi xed appliance therapy in most patients, while the other half received only minor orthodontic treatment (control group). Lateral cephalograms before treatment (T1, mean age 10.4 years), at the end of active treatment (T2, mean age 14.5 years), and at the long-term follow-up (T3, mean age 22.1 years) were traced and digitized. To reveal the infl uence of somatic growth, body height measurements were also taken into consideration. A two-sample t -test was applied in order to determine differences between the groups.
At T1, the study group had a smaller pharynx length ( P = 0.030) and a greater ANB angle ( P < 0.001) than the controls. The pharyngeal area and the smallest distance between the tongue and the posterior pharyngeal wall also tended to be smaller in the study group. During treatment (T1 – T2), signifi cant growth differences between the two groups were present: the study group had a greater reduction in ANB ( P < 0.001) and showed a greater increase in pharyngeal area ( P = 0.007), pharyngeal length ( P < 0.001) and the smallest distance between the tongue and the posterior pharyngeal wall ( P = 0.038). At T2, the values for the study group were similar to those of the control group and remained stable throughout the post-treatment interval (T2 – T3).
Activator-headgear therapy has the potential to increase pharyngeal airway dimensions, such as the smallest distance between the tongue and the posterior pharyngeal wall or the pharyngeal area. Importantly, this increase seems to be maintained long term, up to 22 years on average in the present study. This benefi t may result in a reduced risk of developing long-term impaired respiratory function.
Kuhnel et al. , 2005 ) and to monitor therapeutic response ( Battagel et al. , 1999 ). Reproducibility of airway dimensions on lateral cephalograms has been studied and found to be highly accurate ( Malkoc et al. , 2005 ). However, a number of limitations of lateral cephalometry have been discussed ( Lowe et al. , 1986a ; Finkelstein et al. , 2001 ), particularly inadequate description of the airway on a two-dimensional radiograph.
Although nasal continuous positive airway pressure remains the non-invasive treatment of choice for severe OSA in adults, various intraoral mandibular advancement devices (MAD) are successfully used for treating mild to moderate OSA and snoring ( Bloch et al. , 2000 ; Marklund et
al. , 2004 ). MAD are thought to prevent upper airway collapse during sleep by holding the mandible in a forward position, thereby increasing genioglossus muscle activity and pharyngeal airway space ( Adachi et al. , 1993 ). It has been shown that the percentage of alterations in airway dimensions matched or exceeded the amount of mandibular advancement and that the minimum distances behind the soft palate and tongue improved while wearing these devices ( Battagel et al. , 1999 ).
In growing children, similar oral appliances such as MAD (for example, activators) have been used for many decades to modify mandibular growth in skeletal Class II patients. In contrast to MAD used in adults, activators are considered to enhance skeletal growth of the mandible. Even though there are numerous studies that have examined skeletal changes with functional orthopaedic treatment in Class II children, there appears to be only one ( Ozbek et al. , 1998 ) that has investigated pharyngeal airway dimension changes caused by these devices. However, that investigation had only a short observation time (1.5 years in the treatment group) and was somewhat biased since only good responders were considered for the treatment group (treated patients who did not achieve a Class I occlusion and suffi cient overjet reduction were excluded) and because two types of activators were combined as one group (with and without headgear).
The aims of this long-term study were to examine physiological changes in the pharyngeal airway size in healthy children and to compare them with a group of children who received activator-headgear treatment to determine possible treatment effects.
Subjects and methods Subjects
The 64 subjects (32 males and 32 females) participating in this study were randomly selected from the archives at the Clinic for Orthodontics and Pediatric Dentistry at the University of Zurich. Preconditions for the selection of patients in both groups were no extractions or space closure of congenitally missing teeth, no skeletal Class III
malocclusion, no extreme skeletal deep or open bite, no orthognathic surgery, no rapid maxillary expansion, remaining growth (determined by means of hand-wrist radiograph), at least three lateral cephalograms of good quality: before treatment (T1), at the end of active treatment (T2), and at the end of the long-term follow-up (T3) with the patient being at least 18 years of age.
Inclusion criterion for subjects in the study group was active treatment with a combined activator-high-pull headgear appliance as described by Teuscher (1978) of at least 9 months duration between 9 and 14 years of age. The study group consisted of 32 subjects: 16 males and 16 females. Mean ages, skeletal, and airway measurements are given in Table 1 . According to the principles of the clinic, only a moderate construction bite (typically 3 – 4 mm) was taken, resulting in some cases in a two-step activation; care was taken to avoid increasing the vertical dimension during treatment. Therefore, a short phase with a fi xed appliance was performed for 12 of the 32 patients prior to the combined activator-headgear treatment, mainly to allow an unhindered forward positioning of the lower jaw. The activator was equipped with torque-control auxiliaries for the upper incisors, and the edges of the lower incisors were embedded in acrylic. The facebow was mounted directly on the activator and the direction of the extraoral force was posterior cranial. The mean treatment time with the activator-high-pull headgear appliance was 17 ± 6.5 months (range 9 – 32 months), followed by fi xed orthodontic treatment in 27 patients. Final treatment outcome, such as achievement of a Class I occlusion was not an inclusion or exclusion criteria.
For ethical reasons, no untreated control group was available. Therefore, individuals were chosen who had only minor treatment carried out between 9 and 16 years of age. In most cases, the treatment was undertaken for aesthetic reasons only and involved partial or full fi xed orthodontic treatment. No Class II mechanics such as headgear, activator, or Class II elastics were allowed. The control group consisted of 32 subjects: 16 males and 16 females. The mean ages, skeletal, and airway measurements are given in Table 1 .
Skeletal differences between the groups were inevitable due to the appliance-dictated subject selection. Patients in the activator-headgear group who received therapy primarily because of a skeletal Class II malocclusion were expected to be initially more Class II than the controls. Since a certain overlapping of the groups was desired, no skeletal parameters were defi ned which would result in a larger separation of the groups. Contrary to the sagittal skeletal relationship, facial divergency was very similar in both groups.
Method
Lateral cephalograms were taken with the Frankfurt horizontal plane parallel to the fl oor. For every patient, the
three cephalograms (T1, T2, T3) were hand-traced and then scanned at 600 dpi (Duoscan HiD, AGFA, Mortsel, Belgium). The resulting 192 digitized tracings were calibrated on a known length and measured with ImageTool 3.00 for Windows (University of Texas Health Science Center, San Antonio, Texas, USA). Correction of the radiographic magnifi cation (7.5 per cent) was also made to facilitate comparison with previous published data. The measured angles, distances, and areas are defi ned and illustrated in Figure 1 . To study somatic growth, body height was measured at the same time as the lateral cephalograms were taken. Since one or more body height readings were missing in eight individuals, only 29 patients and 27 controls could be considered in the analysis involving body height.
Error of method
The measurements of the fi rst cephalogram of all 64 patients were repeated by one author (MPH) after an interval of 6 weeks, and the reproducibility of the measurements (limits of agreement) was assessed using the method of Bland and Altman (1986 , 1999) . Furthermore, the fi rst and second readings were compared using the concordance correlation coeffi cient ( Lin, 1989 ).
Statistical method
Statistical analyses were performed with the Statistical Package for Social Sciences 15.01 for Windows (SPSS Inc., Chicago, Illinois, USA) and MedCalc 9.3 (MedCalc Software, Mariakerke, Belgium). For descriptive analyses, the means, standard deviations (SDs) and ranges of the measurements at the three time points were computed. Moreover, the differences in measurements between the time points were calculated, and descriptive statistics of the longitudinal changes (means, SDs, and ranges) were
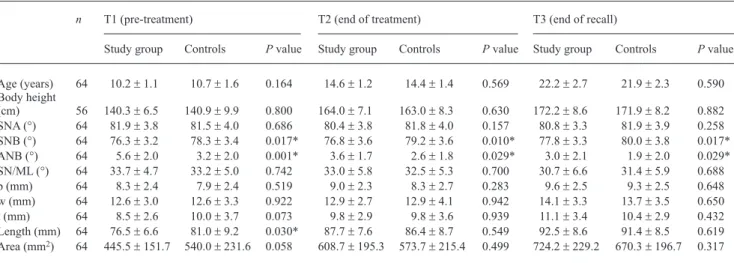
produced. In order to demonstrate differences between the study and control group, a two-sample t -test was applied. When Levene’s test indicated different variances in the Table 1 Means, standard deviations, and P values of two-sample t -test comparing the activator-headgear group and the controls at the three time points.
n T1 (pre-treatment) T2 (end of treatment) T3 (end of recall)
Study group Controls P value Study group Controls P value Study group Controls P value Age (years) 64 10.2 ± 1.1 10.7 ± 1.6 0.164 14.6 ± 1.2 14.4 ± 1.4 0.569 22.2 ± 2.7 21.9 ± 2.3 0.590 Body height (cm) 56 140.3 ± 6.5 140.9 ± 9.9 0.800 164.0 ± 7.1 163.0 ± 8.3 0.630 172.2 ± 8.6 171.9 ± 8.2 0.882 SNA (°) 64 81.9 ± 3.8 81.5 ± 4.0 0.686 80.4 ± 3.8 81.8 ± 4.0 0.157 80.8 ± 3.3 81.9 ± 3.9 0.258 SNB (°) 64 76.3 ± 3.2 78.3 ± 3.4 0.017* 76.8 ± 3.6 79.2 ± 3.6 0.010* 77.8 ± 3.3 80.0 ± 3.8 0.017* ANB (°) 64 5.6 ± 2.0 3.2 ± 2.0 0.001* 3.6 ± 1.7 2.6 ± 1.8 0.029* 3.0 ± 2.1 1.9 ± 2.0 0.029* SN/ML (°) 64 33.7 ± 4.7 33.2 ± 5.0 0.742 33.0 ± 5.8 32.5 ± 5.3 0.700 30.7 ± 6.6 31.4 ± 5.9 0.688 p (mm) 64 8.3 ± 2.4 7.9 ± 2.4 0.519 9.0 ± 2.3 8.3 ± 2.7 0.283 9.6 ± 2.5 9.3 ± 2.5 0.648 w (mm) 64 12.6 ± 3.0 12.6 ± 3.3 0.922 12.9 ± 2.7 12.9 ± 4.1 0.942 14.1 ± 3.3 13.7 ± 3.5 0.650 t (mm) 64 8.5 ± 2.6 10.0 ± 3.7 0.073 9.8 ± 2.9 9.8 ± 3.6 0.939 11.1 ± 3.4 10.4 ± 2.9 0.432 Length (mm) 64 76.5 ± 6.6 81.0 ± 9.2 0.030* 87.7 ± 7.6 86.4 ± 8.7 0.549 92.5 ± 8.6 91.4 ± 8.5 0.619 Area (mm 2 ) 64 445.5 ± 151.7 540.0 ± 231.6 0.058 608.7 ± 195.3 573.7 ± 215.4 0.499 724.2 ± 229.2 670.3 ± 196.7 0.317 * P < 0.05. SN/ML SNA,SNB t w p l B A N S Me Go C4
Figure 1 The cephalometric measurements used in this study to determine skeletal changes were SNA, SNB, ANB, and SN/ML (mandibular line: Menton – Gonion) angles. Pharyngeal airway was assessed with the following measurements: l — pharyngeal length, the longitudinal axis of the pharynx starting at the most cranial point of the pharynx and ending at a line parallel to Frankfort horizontal (FH) through the most anterior inferior point of the fourth vertebral corpus, p — the smallest distance between the soft palate and the posterior pharyngeal wall, w — the largest distance perpendicular to the longitudinal axis of the pharynx, between the lines p and t, t — the smallest distance between the tongue base and the posterior pharyngeal wall, area (marked grey) — the area between line p and a line parallel to FH through the most anterior inferior point of C4. When a gap was present between the tongue and the soft palate, this area was not considered. The area above line p was intentionally not included due to the possibly falsifying infl uence of the adenoids in growing children.
groups, the results from the Welch test were reported. Mean differences and 95 per cent confi dence intervals (CIs) for the differences between groups were computed. Additionally, a paired t -test was used to test for signifi cant longitudinal changes within the groups. To analyse the degree of association between two continuous variables, Pearson’s correlation coeffi cient, with a 95 per cent CI was used. In order to analyse the relationship between one or more predictors and the observed change over time, multiple regression analyses were carried out. A P value of less than 0.05 was chosen to assign statistical signifi cance for all tests. Results with a P value above 0.05 but smaller than 0.10 were interpreted as a tendency.
Results
Lower and upper limits of agreement according to Bland and Altman (1986 , 1999) were as follows: − 7.7 and 6.6 mm 2 for
area measurement, − 0.53 and 0.56 degrees for angular measurements, − 0.46 and 0.37 mm for distance ‘ t ’ , and − 0.63 and 0.61 mm for the longest distance ‘ l ’ . For all measurements, Lin’s (1989) concordance correlation coeffi cient was above 0.99, indicating good repeatability of the measurements.
The only variables that signifi cantly differed between the groups at T1 were SNB (2.02 degrees, P = 0.017), ANB ( − 2.41 degrees, P < 0.001), and the length of the pharynx ‘ l ’ (2.00 mm, P = 0.030), with the study group showing a smaller pharyngeal length and SNB which consequently lead to a greater ANB ( Table 1 ). The pharyngeal area and distance ‘ t ’ also tended to be smaller in the study group. At T2 and T3, differences between the groups were generally smaller, however, SNB (2.17 degrees, P = 0.017) and ANB ( − 1.14 degrees, P = 0.029) still remained signifi cantly different.
The study group had a longer treatment period (T1 – T2) and showed more body height growth during that time, but neither of these factors reached statistical signifi cance ( Table 2 ). The annual growth rate was slightly greater in the control group. To compare the groups longitudinally, discrepancies in the growth differences of the groups were measured. During the treatment period, the study group had a signifi cantly greater reduction of SNA ( − 1.81 degrees, P < 0.001) and ANB ( − 1.43 degrees, P < 0.001), while there was no statistically signifi cant effect for SNB. At the same time, the study group showed statistically signifi cant increases (compared with the controls) in the following pharyngeal parameters: area (129.50 mm 2 , P = 0.007),
length (5.69 mm, P < 0.001) and the smallest distance between the tongue and the posterior pharyngeal wall ‘ t ’ (1.51 mm, P = 0.038). The changes in these parameters were also longitudinally signifi cant in the study group. From T2 to T3, there were no statistically signifi cant differences between the groups; instead, both groups underwent essentially the same changes, implying no reduction but rather a minor increase in the established changes during this period.
Using multiple linear regressions, the relationship between the observed changes in the pharyngeal area and distance ‘ t ’ as the dependent variables and several predictor variables, was determined ( Table 3 ). For the area change during T1 to T2, the only signifi cant predictor variable was the inclusion to the study or the control group; for the distance ‘ t ’ a similar tendency was found. During T2 to T3, group association (patient versus control) was no longer of relevance and the only signifi cant predictor variable was body height growth. For the distance ‘ t ’ , a tendency could also be found when the change in SNB was taken into account as a predictor factor.
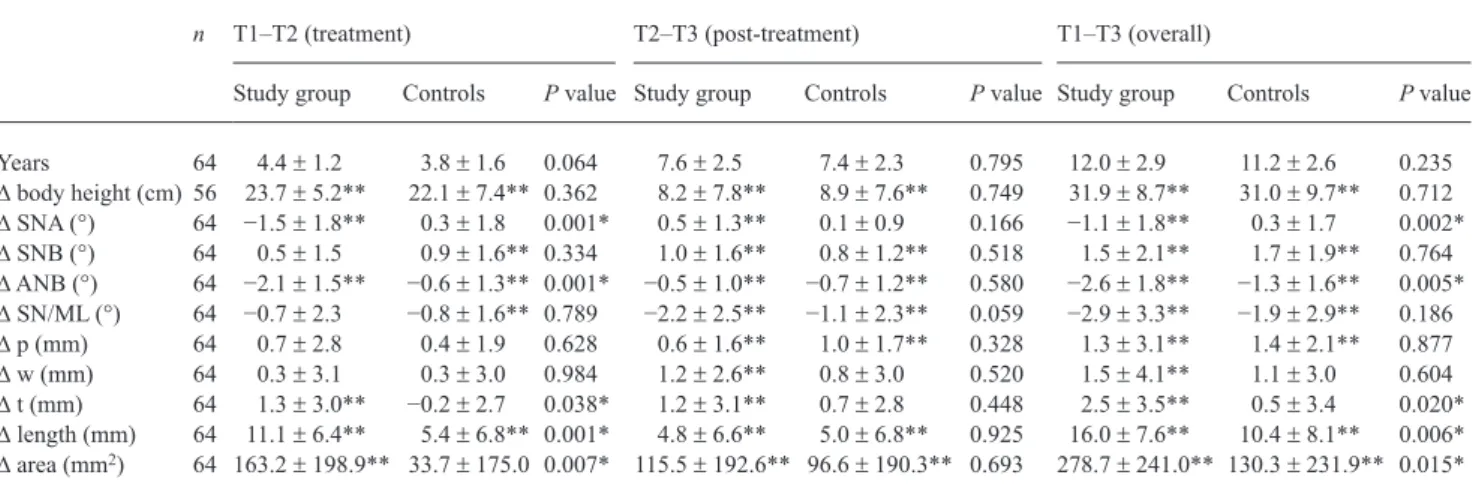
Table 2 Longitudinal mean changes, standard deviations, and P values for the activator-headgear group and the controls. Two-sample t -test was used for intergroup comparison and paired t -test for longitudinal changes within the group.
n T1 – T2 (treatment) T2 – T3 (post-treatment) T1 – T3 (overall)
Study group Controls P value Study group Controls P value Study group Controls P value Years 64 4.4 ± 1.2 3.8 ± 1.6 0.064 7.6 ± 2.5 7.4 ± 2.3 0.795 12.0 ± 2.9 11.2 ± 2.6 0.235 ∆ body height (cm) 56 23.7 ± 5.2** 22.1 ± 7.4** 0.362 8.2 ± 7.8** 8.9 ± 7.6** 0.749 31.9 ± 8.7** 31.0 ± 9.7** 0.712 ∆ SNA (°) 64 − 1.5 ± 1.8** 0.3 ± 1.8 0.001* 0.5 ± 1.3** 0.1 ± 0.9 0.166 − 1.1 ± 1.8** 0.3 ± 1.7 0.002* ∆ SNB (°) 64 0.5 ± 1.5 0.9 ± 1.6** 0.334 1.0 ± 1.6** 0.8 ± 1.2** 0.518 1.5 ± 2.1** 1.7 ± 1.9** 0.764 ∆ ANB (°) 64 − 2.1 ± 1.5** − 0.6 ± 1.3** 0.001* − 0.5 ± 1.0** − 0.7 ± 1.2** 0.580 − 2.6 ± 1.8** − 1.3 ± 1.6** 0.005* ∆ SN/ML (°) 64 − 0.7 ± 2.3 − 0.8 ± 1.6** 0.789 − 2.2 ± 2.5** − 1.1 ± 2.3** 0.059 − 2.9 ± 3.3** − 1.9 ± 2.9** 0.186 ∆ p (mm) 64 0.7 ± 2.8 0.4 ± 1.9 0.628 0.6 ± 1.6** 1.0 ± 1.7** 0.328 1.3 ± 3.1** 1.4 ± 2.1** 0.877 ∆ w (mm) 64 0.3 ± 3.1 0.3 ± 3.0 0.984 1.2 ± 2.6** 0.8 ± 3.0 0.520 1.5 ± 4.1** 1.1 ± 3.0 0.604 ∆ t (mm) 64 1.3 ± 3.0** − 0.2 ± 2.7 0.038* 1.2 ± 3.1** 0.7 ± 2.8 0.448 2.5 ± 3.5** 0.5 ± 3.4 0.020* ∆ length (mm) 64 11.1 ± 6.4** 5.4 ± 6.8** 0.001* 4.8 ± 6.6** 5.0 ± 6.8** 0.925 16.0 ± 7.6** 10.4 ± 8.1** 0.006* ∆ area (mm 2 ) 64 163.2 ± 198.9** 33.7 ± 175.0 0.007* 115.5 ± 192.6** 96.6 ± 190.3** 0.693 278.7 ± 241.0** 130.3 ± 231.9** 0.015*
* P < 0.05 (signifi cant differences between the groups). ** P < 0.05 (signifi cant longitudinal changes within the group).
Considering only the changes in the control group, normal growth of the pharyngeal airway during T1 to T3 can be studied. The length (10.44 mm, P < 0.001), distance ‘ p ’ (1.41 mm, P < 0.001) and the area (130.26 mm 2 , P = 0.003)
demonstrated a signifi cant increase from T1 to T3, while distances ‘ w ’ and ‘ t ’ showed no signifi cant increase and only minimal enlargement. During this period, ANB ( − 1.33 degrees, P < 0.001) and SN/ML ( − 1.87 degrees, P < 0.001) showed a signifi cant angle reduction and were positively associated with each other ( r = 0.53, P = 0.002). Again taking only the control group into account, Pearson’s correlation coeffi cient revealed that body height growth had a signifi cant positive association with the change in pharyngeal length ( r = 0.61, P < 0.001), and area ( r = 0.41, P = 0.032) and a negative association with the change in ANB ( r = − 0.43, P = 0.027). However, an expected correlation between the change in the pharyngeal area and that for SNB ( r = 0.20, P = 0.262) or the change in SN/ML ( r = − 0.22, P = 0.22) was only weak.
Comparing the changes between genders longitudinally, there were no signifi cant differences in the skeletal or airway parameters in either group during the period T1 – T2. For T2 to T3, however, males showed signifi cantly greater body height growth, pharyngeal length, and a tendency for an increase in SNB in both groups. At the long-term follow-up, the absolute values for females were similar to those of the males. Equal distribution of genders in the groups allowed pooling of data for males and females.
Discussion
It is evident that measurements on a two-dimensional cephalometric radiograph cannot reveal the transverse dimension of the airway. For this reason, three-dimensional imaging such as cone beam technology would be the preferred method. Since this technology was only introduced in recent years and has until now a relatively high radiation
dose for regular treatment monitoring, no long-term data will be available for some time. Therefore, the conventional lateral cephalogram remains a valuable and reliable diagnostic tool which has been used in numerous airway studies.
The longitudinal changes in the control group in this study revealed that not all pharyngeal dimensions increased during adolescence. While the length of the pharynx ‘ l ’ steadily increased, the smallest distance between the tongue base and the posterior pharyngeal wall ‘ t ’ did not signifi cantly increase. The present fi ndings for distance ‘ t ’ are in agreement with an earlier study ( McNamara, 1984 ), which found no appreciable changes with age and showed the average value of this measurement to be between 10 and 12 mm (9 – 11 mm without magnifi cation). The present results for pharyngeal length are also consistent with other fi ndings later in life, between 20 and 50 years of age, which show continued vertical growth in pharyngeal length and a reduction in pharyngeal depth ( Johnston and Richardson, 1999 ). Growth differences in pharyngeal dimensions between males and females were generally small, and at T3 both genders had reached similar absolute values, which is in line with a previous study ( Abu Allhaija and Al-Khateeb, 2005 ).
At T1, the study group, which was, on average, skeletally more Class II than the controls, showed a tendency for a smaller pharyngeal area and distance between the tongue base and the posterior pharyngeal wall ‘ t ’ . These fi ndings agree with other studies that showed a weak but signifi cant correlation between the skeletal confi guration (ANB) and inferior pharyngeal airway space ( Ceylan and Oktay, 1995 ; Abu Allhaija and Al-Khateeb, 2005 ). Clinical relevance was established by a study of 121 patients demonstrating an increasing severity of OSA with increasing overjet ( Bates and McDonald, 2005 ), measured on lateral cephalograms.
During T1 to T2, the study group showed signifi cantly greater increases compared with the controls in the distance Table 3 Multiple linear regressions on 56 observations for longitudinal changes in distance ‘ t ’ and area during T1 – T2 and T2 – T3. Explanatory variables were group (study or control), gender, body height growth, SNB, and SN/ML change.
∆ distance ‘ t ’ ∆ area
T1 – T2 ( r 2 adjusted = 0.01) T2 – T3 ( r 2 adjusted = 0.12) T1 – T2 ( r 2 adjusted = 0.09) T2 – T3 ( r 2 adjusted = 0.29)
Coeffi cient SE P value Coeffi cient SE P value Coeffi cient SE P value Coeffi cient SE P value Group (study = 1, control = 0) 1.47 0.82 0.079 0.39 0.74 0.595 111.71 52.03 0.036* − 9.99 43.29 0.818 Gender (male = 0, female = 1) − 0.35 0.82 0.668 0.97 0.90 0.283 2.46 51.55 0.962 43.99 52.58 0.407 ∆ body height 0.01 0.07 0.774 0.17 0.07 0.016* 5.65 4.11 0.176 15.19 3.88 0.001* ∆ SNB − 0.19 0.34 0.582 0.59 0.35 0.097 − 22.16 21.59 0.310 14.23 20.30 0.487 ∆ SN/ML 0.11 0.26 0.674 0.24 0.21 0.247 − 1.29 16.60 0.938 4.17 12.51 0.741 * P < 0.05.
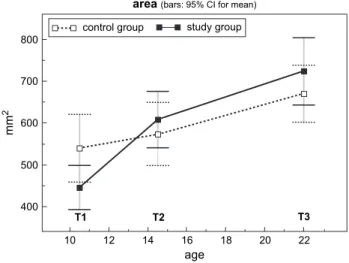
‘ t ’ , pharyngeal length, and pharyngeal area. During T2 to T3, these established changes remained and the groups showed similar growth. Taking into account the norm for the distance ‘ t ’ , which is 10 – 12 mm ( McNamara, 1984 ), it becomes clear that the activator-headgear group was initially below the average and could reach normal values during treatment in an airway measurement that normally does not demonstrate any signifi cant growth. This is illustrated in Figures 2 and 3 , where the study group, which started with lower values, surpassed the controls during treatment and showed no decrease in the changes during the follow-up period. The body height measurements helped to verify that both groups had similar growth rates and that there was no bias in the selection of patients and controls.
Even though determining skeletal changes was not the primary goal of this study, it is evident that the combined activator-high-pull headgear appliance had a signifi cant impact on the maxilla. While SNA remained constant in the controls, there was a reduction in the study group. However, this did not reduce the smallest distance between the soft palate and the posterior pharyngeal wall ‘ p ’ . In another study ( Kirjavainen and Kirjavainen, 2007 ), retropalatal airway space was even increased during cervical headgear treatment in Class II children, whereas the oro- and hypopharynx remained unchanged. SNB demonstrated similar increases in both groups but the potential effect of the activator-headgear appliance on lower jaw growth could not be verifi ed from the present data. Nevertheless, since the study group had a more retrognathic mandible at T1, perhaps resulting in diminished future lower jaw growth if left untreated ( Lux et
al. , 2005 ; Franchi et al. , 2007 ), the similar growth rate alone
could be a positive effect of the appliance. To support this hypothesis, an untreated Class II group would be needed.
The positive impact of activator-headgear therapy on the airway dimensions cannot be explained just by the established skeletal changes. The present data suggest that the underlying mechanism is more complex, also having an effect on the soft tissues. Different posture of the tongue caused by increased genioglossal muscle tonus or other soft tissues changes may play an important role and are probably induced by forward positioning of the mandible during activator-headgear treatment. This effect seems to be similar to the way MAD work in adults. A study on the effect of MAD in subjects with OSA showed that the minimal distance behind the tongue improved by 0.8 mm while wearing these devices ( Battagel et al. , 1999 ). In the present study, the minimal distance behind the tongue ‘ t ’ improved by 2.5 mm on average in the activator-headgear group during the observation period. Even though this seems to be a small increase, it is nevertheless clinically signifi cant, considering that a 0.8 mm increase with a MAD has a positive effect on OSA.
Another possible explanation for the improvement in the activator-headgear group could be a ‘ catch-up growth ’ concept, where children with small oropharyngeal dimensions would have a greater intrinsic stimulus to increase their capacity for respiratory function ( Ozbek et
al. , 1998 ). Nonetheless, it is noteworthy that individual
differences in normal growth and in the response to treatment are considerable. Even a small diameter change can result in a substantial volumetric change and can have a great effect on airfl ow because the resistance decreases to the fourth power as the radius increases.
OSA children with large adenoids and tonsils have been found to have somatic growth impairment due to abnormal nocturnal growth hormone (GH) secretion. After adenotonsillectomy, which is the fi rst treatment of choice in
12 11 10 9 8 T1 T2 T3 10 12 14 16 18 20 22 age
distance"t" (bars: 95%CI for mean)
control group study group
mm
Figure 2 Longitudinal development of the smallest distance between the tongue base and the posterior pharyngeal wall ‘ t ’ at the different time points. The growth rate was signifi cantly different between the groups during the treatment phase (T1 – T2), but not during the follow-up period (T2 – T3). 800 700 600 500 400 mm 2 T1 T2 T3 10 12 14 16 18 20 22 age study group control group
area(bars: 95% CI for mean)
Figure 3 Longitudinal development of the pharyngeal area defi ned in
Figure 1 at the different time points. The growth rate was signifi cantly different between the groups during the treatment phase (T1 – T2), but not during the follow-up period (T2 – T3).
OSA children, a signifi cant increase in serum levels of GH mediators and a normalization of somatic growth can be observed ( Bar et al. , 1999 ; Nieminen et al. , 2002 ). Most likely, the explanation for this improvement is the demonstrated link between insuffi cient sleep patterns or stages and nocturnal release of GH ( Spath-Schwalbe et al. , 1995 ; Steiger, 2002 ). The same occurrence seems also plausible in OSA children who have severe mandibular retrognathism as their primary cause of airway obstruction. In these children, activator-headgear therapy could also stimulate GH secretion by normalization of nocturnal breathing and thereby have a positive effect on mandibular growth. It has been demonstrated that GH increases endochondral bone formation in the condylar cartilage and enhances ramus height by augmented bone apposition in the lower border of the mandible (through the anabolic effects of GH on masticatory muscles; Vogl et al. , 1993 ). Of course, such a positive sequence achieved by activator-headgear treatment is currently hypothetical and must be confi rmed.
Snoring and OSA are described as two aspects of the same basic disorder, namely sleep-related narrowing of the upper airways which differ only in severity ( Lugaresi and Plazzi, 1997 ). The patency of the upper airway depends on the balance between the negative intrapharyngeal pressure developed during inspiration and its counteraction by dilating muscles ( Friberg, 1999 ). It is clear that upper airway collapse most often results from a combination of anatomical factors that predispose the airway to collapse during inspiration, plus neuromuscular compensation that is insuffi cient during sleep to maintain airway patency ( Young et al. , 2002 ). Therefore, it is possible that small pharyngeal dimensions established early in life may predispose to OSA and snoring later when subsequent soft tissue changes ( Martin et al. , 1997 ) caused by age, obesity, or genetic background further reduce the available oropharyngeal airway. Consequently, it can only be regarded as benefi cial if functional orthopaedic treatment in children ( Ozbek et al. , 1998 ) or surgical mandibular advancement ( Achilleos et al. , 2000 ) results in a permanent increase in pharyngeal airway dimensions.
Conclusions
The present fi ndings indicate that activator-headgear therapy (followed by fi xed appliance treatment) has the potential to increase pharyngeal airway dimensions, such as the smallest distance between the tongue base and the posterior pharyngeal wall or the pharyngeal area. Importantly, this achieved increase seems to be maintained in the long term, up to 22 years on average according to the fi ndings of the present research. However, as in all orthodontic studies involving growing children, individual differences in normal growth and in the response to treatment were substantial. The evident increase in the airway dimension
obtained by functional orthopaedic treatment may reduce the risk of developing OSA in later life. This treatment can therefore be considered benefi cial not only from the dental point of view but also from a general medical perspective. Address for correspondence
T. Peltomäki
Clinic for Orthodontics and Pediatric Dentistry University of Zürich Plattenstrasse 11 8032 Zürich Switzerland E-mail: [email protected] References
Abu Allhaija E S , Al-Khateeb S N 2005 Uvulo-glosso-pharyngeal dimensions in different anteroposterior skeletal patterns . Angle Orthodontist 75 : 1012 – 1018
Achilleos S , Krogstad O , Lyberg T 2000 Surgical mandibular advancement and changes in uvuloglossopharyngeal morphology and head posture: a short- and long-term cephalometric study in males . European Journal of Orthodontics 22 : 367 – 381
Adachi S , Lowe A A , Tsuchiya M , Ryan C F , Fleetham J A 1993 Genioglossus muscle activity and inspiratory timing in obstructive sleep apnea . American Journal of Orthodontics and Dentofacial Orthopedics 104 : 138 – 145
Avrahami E , Englender M 1995 Relation between CT axial cross-sectional area of the oropharynx and obstructive sleep apnea syndrome in adults . American Journal of Neuroradiology 16 : 135 – 140
Bar A , Tarasiuk A , Segev Y , Phillip M , Tal A 1999 The effect of adenotonsillectomy on serum insulin-like growth factor-I and growth in children with obstructive sleep apnea syndrome . The Journal of Pediatrics 135 : 76 – 80
Bates C J , McDonald J P 2005 The relationship between severity of obstructive sleep apnoea/hypopnoea syndrome (OSAHS) and lateral cephalometric radiograph values: a clinical diagnostic tool . The Surgeon 3 : 338 – 346
Battagel J M , L’Estrange P R 1996 The cephalometric morphology of patients with obstructive sleep apnoea (OSA) . European Journal of Orthodontics 18 : 557 – 569
Battagel J M , Johal A , Kotecha B 2000 A cephalometric comparison of subjects with snoring and obstructive sleep apnoea . European Journal of Orthodontics 22 : 353 – 365
Battagel J M , Johal A , L’Estrange P R , Croft C B , Kotecha B 1999 Changes in airway and hyoid position in response to mandibular protrusion in subjects with obstructive sleep apnoea (OSA) . European Journal of Orthodontics 21 : 363 – 376
Bland J M , Altman D G 1986 Statistical methods for assessing agreement between two methods of clinical measurement . Lancet 1 : 307 – 310 Bland J M , Altman D G 1999 Measuring agreement in method comparison
studies . Statistical Methods in Medical Research 8 : 135 – 160
Bloch K E et al. 2000 A randomized, controlled crossover trial of two oral appliances for sleep apnea treatment . American Journal of Respiratory and Critical Care Medicine 162 : 246 – 251
Ceylan I , Oktay H 1995 A study on the pharyngeal size in different skeletal patterns . American Journal of Orthodontics and Dentofacial Orthopedics 108 : 69 – 75
Contencin P , Guilleminault C , Manach Y 2003 Long-term follow-up and mechanisms of obstructive sleep apnea (OSA) and related syndromes through infancy and childhood . International Journal of Pediatric Otorhinolaryngology 67 : Supplement 1 : S119 – S123
Finkelstein Y, et al. 2001 Frontal and lateral cephalometry in patients with sleep-disordered breathing . The Laryngoscope 111 : 634 – 641
Franchi L , Baccetti T , Stahl F , McNamara Jr J A 2007 Thin-plate spline analysis of craniofacial growth in Class I and Class II subjects . Angle Orthodontist 77 : 595 – 601
Friberg D 1999 Heavy snorer’s disease: a progressive local neuropathy . Acta Oto-Laryngologica 119 : 925 – 933
Guilleminault C , Eldridge F L , Simmons F B , Dement W C 1976 Sleep apnea in eight children . Pediatrics 58 : 23 – 30
Johnston C D , Richardson A 1999 Cephalometric changes in adult pharyngeal morphology . European Journal of Orthodontics 21 : 357 – 362
Kirjavainen M , Kirjavainen T 2007 Upper airway dimensions in Class II malocclusion — effects of headgear treatment . Angle Orthodontist 77 : 1046 – 1053
Kuhnel T S , Schurr C , Wagner B , Geisler P 2005 Morphological changes of the posterior airway space after tongue base suspension . The Laryngoscope 115 : 475 – 480
Launois S H et al. 1993 Site of pharyngeal narrowing predicts outcome of surgery for obstructive sleep apnea . The American Review of Respiratory Disease 147 : 182 – 189
Lin L I 1989 A concordance correlation coeffi cient to evaluate reproducibility . Biometrics 45 : 255 – 268
Lowe A A , Fleetham J A , Adachi S , Ryan C F 1995 Cephalometric and computed tomographic predictors of obstructive sleep apnea severity . American Journal of Orthodontics and Dentofacial Orthopedics 107 : 589 – 595
Lowe A A , Gionhaku N , Takeuchi K , Fleetham J A 1986a Three-dimensional CT reconstructions of tongue and airway in adult subjects with obstructive sleep apnea . American Journal of Orthodontics and Dentofacial Orthopedics 90 : 364 – 374
Lowe A A , Santamaria J D , Fleetham J A , Price C 1986b Facial morphology and obstructive sleep apnea . American Journal of Orthodontics and Dentofacial Orthopedics 90 : 484 – 491
Lugaresi E , Plazzi G 1997 Heavy snorer disease: from snoring to the sleep apnea syndrome – an overview . Respiration; International Review of Thoracic Diseases 64 : Supplement 1 : 11 – 14
Lux C J , Burden D , Conradt C , Komposch G 2005 Age-related changes in sagittal relationship between the maxilla and mandible . European Journal of Orthodontics 27 : 568 – 578
Malkoc S , Usumez S , Nur M , Donaghy C E 2005 Reproducibility of airway dimensions and tongue and hyoid positions on lateral cephalograms . American Journal of Orthodontics and Dentofacial Orthopedics 128 : 513 – 516
Marklund M , Stenlund H , Franklin K A 2004 Mandibular advancement devices in 630 men and women with obstructive sleep apnea and
snoring: tolerability and predictors of treatment success . Chest 125 : 1270 – 1278
Martin S E , Mathur R , Marshall I , Douglas N J 1997 The effect of age, sex, obesity and posture on upper airway size . European Respiratory Journal 10 : 2087 – 2090
Mathur R , Douglas N J 1995 Family studies in patients with the sleep apnea-hypopnea syndrome . Annals of Internal Medicine 122 : 174 – 178 McNamara J A 1984 A method of cephalometric evaluation . American
Journal of Orthodontics 86 : 449 – 469
Morrison D L , Launois S H , Isono S , Feroah T R , Whitelaw W A , Remmers J E 1993 Pharyngeal narrowing and closing pressures in patients with obstructive sleep apnea . The American Review of Respiratory Disease 148 : 606 – 611
Nieminen P , Löppönen T , Tolonen U , Lanning P , Knip M , Löppönen H 2002 Growth and biochemical markers of growth in children with snoring and obstructive sleep apnea . Pediatrics 109 : e55
Ono T , Otsuka R , Kuroda T , Honda E , Sasaki T 2000 Effects of head and body position on two- and three-dimensional confi gurations of the upper airway . Journal of Dental Research 79 : 1879 – 1884
Ozbek M M , Memikoglu T U , Gogen H , Lowe A A , Baspinar E 1998 Oropharyngeal airway dimensions and functional-orthopedic treatment in skeletal Class II cases . Angle Orthodontist 68 : 327 – 336
Pae E K , Lowe A A , Sasaki K , Price C , Tsuchiya M , Fleetham J A 1994 A cephalometric and electromyographic study of upper airway structures in the upright and supine positions . American Journal of Orthodontics and Dentofacial Orthopedics 106 : 52 – 59
Schwab R J et al. 2006 Family aggregation of upper airway soft tissue structures in normal subjects and patients with sleep apnea . American Journal of Respiratory and Critical Care Medicine 173 : 453 – 463 Smith A M , Battagel J M 2004 Non-apneic snoring and the orthodontist:
radiographic pharyngeal dimension changes with supine posture and mandibular protrusion . Journal of Orthodontics 31 : 124 – 131
Spath-Schwalbe E , Hundenborn C , Kern W , Fehm H L , Born J 1995 Nocturnal wakefulness inhibits growth hormone (GH)-releasing hormone-induced GH secretion . The Journal of Clinical Endocrinology and Metabolism 80 : 214 – 219
Steiger A 2002 Sleep and the hypothalamo-pituitary-adrenocortical system . Sleep Medicine Reviews 6 : 125 – 138
Teuscher U 1978 A growth-related concept for skeletal Class II treatment . American Journal of Orthodontics 74 : 258 – 275
Vogl C , Atchley W R , Cowley D E , Crenshaw P , Murray J D , Pomp D 1993 The epigenetic infl uence of growth hormone on skeletal development . Growth Development & Aging 57 : 163 – 182
Young T , Peppard P E , Gottlieb D J 2002 Epidemiology of obstructive sleep apnea: a population health perspective . American Journal of Respiratory and Critical Care Medicine 165 : 1217 – 1239