HAL Id: cea-02355776
https://hal-cea.archives-ouvertes.fr/cea-02355776
Submitted on 2 Dec 2019HAL is a multi-disciplinary open access
archive for the deposit and dissemination of sci-entific research documents, whether they are pub-lished or not. The documents may come from teaching and research institutions in France or abroad, or from public or private research centers.
L’archive ouverte pluridisciplinaire HAL, est destinée au dépôt et à la diffusion de documents scientifiques de niveau recherche, publiés ou non, émanant des établissements d’enseignement et de recherche français ou étrangers, des laboratoires publics ou privés.
International Standard Problem on containment
thermal-hydraulics ISP47 - STEP1 - Results from the
MISTRA exercise
E. Studer, J.P. Magnaud, F. Dabbene, I. Tkatschenko
To cite this version:
E. Studer, J.P. Magnaud, F. Dabbene, I. Tkatschenko. International Standard Problem on contain-ment thermal-hydraulics ISP47 - STEP1 - Results from the MISTRA exercise. Nuclear Engineering and Design, Elsevier, 2006, 237 (5), pp.536-551. �10.1016/j.nucengdes.2006.08.008�. �cea-02355776�
International Standard Problem on containment
thermal-hydraulics ISP47 - STEP1 - Results from the
MISTRA exercise
E. Studer, J.P. Magnaud, F. Dabbene, I. Tkatschenko CEA/DEN/DM2S/SFME/LTMF,
CEA Saclay, Gif-sur-Yvette, 91191, France
ABSTRACT
The understanding of hydrogen distribution during severe accidents in a nuclear reactor containment is still an open issue. Several containment thermal-hydraulics international standard problems (ISP) have been conducted to address this topic. However the predictions made by the available Lumped Parameter or CFD com-puter codes were generally not satisfactory. Therefore a new exercise was launched in 1999 using new state-of-the-art experimental facilities TOSQAN, MISTRA and ThAI that included sophisticated 3D instrumentation and well controled boundary conditions. Predictive capabilities of important and still uncertain phenomena such as wall condensation, natural circulation and gas stratification are assessed. In ad-dition, comparison between LP and CFD codes and assessment of the capability of CFD codes to deal with scaling effects are performed. This article reports on the part of the exercise which concerns the MISTRA facility including experimental results and blind benchmark exercises.
KEYWORDS
CONTAINMENT THERMAL-HYDRAULICS, MISTRA, ISP47, BENCHMARK EXERCISE
1 INTRODUCTION
During the course of a severe accident in a Pressurised Water Reactor (PWR), large amounts of hydrogen can be released into the containment (Haste et al., 1995). As a consequence, the integrity of this third barrier can be compromised by severe com-bustion events. As these hydrogen comcom-bustion processes involving slow and fast de-flagrations for example depend on narrow gas concentration range, accurate gas dis-tribution calculations are needed. An international consensus (OECD/NEA, 1999) related to previous international standard problems (ISP) (Karwat, 1989, 1993, NUPEC, 1994) concluded that detailed knowledge of the containment thermal-hydraulics is necessary for reliable predictions of pressure, temperature and gas concentration fields. The main objective of the present OECD International Stan-dard Problem (ISP47) is to contribute to assess the capability of Lumped Parameter (LP) and CFD computer codes to predict the hydrogen distribution under severe accident conditions in a Light Water Reactor. The objectives of this new exercise are:
• to cover phenomena important and still uncertain for containment thermal-hydraulics such as wall condensation, natural circulation, atmosphere stratification, turbu-lent diffusion as well as interaction between them,
• to bring together users of LP and CFD codes and
• to assess the capability of CFD codes to deal with scaling effects.
This ISP has been mainly conducted in two steps using newly available facilities, each with sophisticated instrumentation:
• Step 1 is dedicated to the validation of refined models and scaling effect studies using TOSQAN and MISTRA facilities. Wall condensation and buoyancy are ad-dressed in a rather simple geometry. Simultaneously, the validation of the inter-actions of phenomena, such as condensation/stratification, turbulence/buoyancy, etc., including the effect of scale-up allowed by the larger scale of MISTRA are investigated in a simple flow pattern.
• Step 2 addresses the validation of computer codes in a multi-compartmented geometry with asymmetric injections in the ThAI facility. This configuration is more representative of the real plant complexity.
Step 1 is divided into 2 separate phases: Phase A dealing with Air/Steam steady states in TOSQAN and MISTRA and Phase B looking at the effect of a Helium
sient injection prior to Air/Steam/Helium steady states in TOSQAN and MISTRA facilities. The ISP was organised in an ”open” way for the TOSQAN calculations allowing for model adjustments and in a ”blind” way for the MISTRA calculations. It should be mentioned that some of the participants had already performed calcu-lations of a MISTRA experiment during the MICOCO benchmark organised by CEA (Blumenfeld and Paill`ere, 2003). This may be important for the blind results of Phase A.
This article synthesises the MISTRA exercise involving experimental results and benchmark calculations. In particular, it mainly addresses the achievement of ex-perimental data suitable for LP/CFD code benchmarking, the simulation of flow pattern close to a vertical injection, the distribution of condensation and the be-haviour of saturation along a vertical condensing wall and the effect of helium ad-dition on that condensation process. The results of the whole ISP will be published at the completion of the exercise. In the first section, we describe MISTRA facility and the initial and boundary conditions relevant to the present exercise. The sec-ond section is organised around comparisons between experimental and computed results for global and local variables. Some interesting transient results occurring between the two phases are then described and discussed in the third section. Con-clusions follow.
2 Description of MISTRA facility and initial and boundary conditions re-lated to ISP47
The MISTRA facility is part of the CEA programme related to severe accidents occurring in nuclear reactors and is focused on containment thermal-hydraulics and hydrogen safety. Several papers already provided a description of the MISTRA facility (Studer et al., 2003, Tkatschenko et al., 2005) and in the present article we focus on the geometrical description and the associated initial and boundary conditions related to the ISP47 exercise.
2.1 MISTRA facility and associated instrumentation
The MISTRA facility is a stainless steel vessel of 99.5 m3 (Fig. 1). The internal diameter (4.25 m) and the height (7.3 m) were chosen to scale to a typical French PWR containment with a linear length scale ratio of 0.1. The pressure vessel
com-prises 2 shells, a flat cap and a bottom, which are attached with twin flanges. The external part of the vessel (about 118 m2) itself is not temperature-regulated but thermally insulated with 20 cm of rock wool.
Three independent thermally driven walls, hereafter called condensers are inserted inside the containment close to the external wall: 26.2 m2for the lower condenser and 21.4 m2 for the middle and the upper condenser. A so called “dead volume” behind the condensers exists and spurious condensation may occur during experi-ments (due to heat losses). The condensers are specially designed to ensure well controlled boundary conditions (+/- 1◦C). The external part is insulated with 2 cm of synthetic foam and viewing windows are installed for laser measurements. Condensates are collected in gutters: one per condenser and three circuits for the spurious condensation (containment walls, insulated part of the condensers and sump). The viewing windows installed in the middle condenser are used to provide Laser Doppler Velocimetry measurements along a radial profile. The containment atmosphere is seeded by SiC particles but the presence of fog at least close to the condensers (middle and lower) during the Phase B steady-state did not allow this measurement for the second steady state.
A diffusion cone fitted with a removable cap is designed for gas injection (200 mm of injection diameter). A porous medium is used to ensure flat velocity profiles at the injection nozzle and the injection device is set-up in the bottom along the central axis (Fig. 2). The flow is injected at a given rate controlled and measured using sonic nozzles that ensure a constant value independent of the downstream operating conditions. The injection temperature is usually measured beyond the porous medium, inside the diffusion cone (1285 mm elevation). During the 2003 dismantling phase, leakages inside the diffusion cone were detected due to failure of the main seal of the porous medium. So, extra turbulence was created at the injection level for the first set of experiments performed in 2002. For the 2004 tests series, the porous medium was welded on the injection device preventing leaks for the new trail runs. The instrumentation location is displayed in Fig. 3 for the main vertical half-planes (345◦azimuthal angle). Thermocouples and gas sampling tubes are installed on this grid and the maximum distance between two sensors is less than 1 meter axially and 0.5 m radially. Two others half planes (105◦and 225◦) are lightly instrumented mainly to check the symmetry of the flow.
2.2 Initial and boundary conditions
The simplified test sequence related to the ISP47 exercise is made up of four suc-cessive phases: 1285 2125 1897 0 internal 1130 940 1468 1663 3233 3428 3766 3961 6921 7116 7380 Viewing Window 1988 Viewing Window 4341 Viewing Window 6559 7280.5 5496.5 5410.5 5376
UPPER CONDENSER FLANGE: Thickness 110
Thickness 15 180 < clearance < 200 55 < clearance < 73 MIDDLE CONDENSER LOWER CONDENSER 3472 3506 3592 1208 1285 Gutter Thickness 25
Fig. 1. Schematic view of the MISTRA facility, symmetry half plane (dimensions are given in mm)
Main seal Porous Medium Porous Medium Detected leakage Steam Helium Containment bottom
Fig. 2. Schematic view of the injection device used in the MISTRA facility
(1) Preheating phase: superheated steam injection into the facility initially at room temperature and pressure. This is a process phase mainly used to heat up the steel structures and the results of this phase are not reported and discussed in the present document.
(2) Air/Steam steady-state (Phase A) defined from the balance between the in-jected and condensed mass flows (130 g/s) ensuring the stability of all the parameters: pressure, temperature and gas concentrations.
(3) Air/Steam/Helium transient mass flow of helium (simulating hydrogen) is added to the main steam mass flow at a rate of 10 g/s for half an hour.
(4) Air/Steam/Helium steady-state (Phase B) with the same definition and bound-ary conditions as for Phase A.
The test was run ten times to check for repeatability (6 times in 2002 and 4 times in 2004) and also to allow gas concentration measurements. Initial and boundary conditions are given in terms of mean values and the given uncertainty includes systematic and repeatability errors. Initial conditions are only needed to specify the air density which is constant during the test. A mean value of 1.195 kg/m3with an uncertainty of about 0.02 kg/m3 is obtained for the tests. The superheated steam mass flow is injected at a constant rate during the test: 130.1 g/s with an estimated uncertainty of +/- 3 g/s. The helium mass flow is injected at a rate of 10.16 g/s (with an estimated uncertainty of +/- 0.35 g/s) for a duration of 1826 seconds. By supposing any leakage, this leads to about 118.9 kg of air and 18.6 kg of helium
7125: N10 0 internal R0 R1 R2 R3 R4 R5 0 475 950 1425 1814 2000 6425: N9 5625: N8 4625: N7 3625: N6 600: N1 1100: N2 1575: N3 2025: N4 2625: N5
Fig. 3. Main instrumented vertical plane of the MISTRA facility (dimensions in mm)
inside the facility.
The injection temperature at the steady state is about 198.1◦C for Phase A and 201.6◦C for Phase B with an uncertainty of about +/- 2.3◦C. A transient behaviour is measured (Fig.4) during the helium injection phase (HTI). During Phase A steady-state, steam enters the heliun injection pipe (Fig.2) and condenses outside the fa-cility where the pipe is not heated. A water plug is created inside the pipe. Then, hot helium is injected and has to heat up the pipe and to evaporate the water plug.
Improvements during the 2003 upgrading phase (purge of the water plug prior to helium injection and additional electrical heating of the helium injection pipe out-side the facility) have reduced this temperature decrease. Finally, it was shown that these different transients conditions have no impact on the transient behaviour of the condensation described below.
120 130 140 150 160 170 180 190 200 210 -500 0 500 1000 1500 2000 Tgas (Celsius) t(s) Exp.16/04 Exp.29/11 Exp.09/12 Exp.19/02 Exp.25/02 Exp.04/03
Fig. 4. ISP47: injection temperature of the gaseous mixture (Steam and Helium) during the transient addition of helium (2002 tests series: 16/04, 29/11 and 09/12 - 2004 tests series 19/02, 25/02 and 04/03)
For the condensers, the specified temperature is 115◦C for each condenser and the achieved conditions are 115.2◦C for the lower condenser, 114.6◦C for the middle condenser and 115.3◦C for the upper condenser with a thermocouple uncertainty of about +/- 0.8◦C. This demonstrates controlled boundary conditions in the MISTRA experiments.
Spurious condensation along the external steel walls was specified for the bench-mark exercise (12% of the injected mass flow rate ie. 15.6 g/s) and the measured values corresponds to 17.9 g/s for Phase B and between 15.2 to 17.5 g/s for Phase A (distributed as follow: 40% on the containment walls, 40% on the sump and 20% on the insulated material on the external side of the condensers). This spurious con-densation results in heat loss. The major part of these heat losses occurs at the sump due to penetrations and supporting structures. For the walls of the dead volume be-hind the condensers, heat losses of about 14 kW correspond to an estimated heat
120 122 124 126 128 130 -500 0 500 1000 1500 Tgas (Celsius) t(s) N5-R4 N5-R5 N7-R4 N7-R5 N9-R4 N9-R5 0 0.005 0.01 0.015 0.02 0.025 0.03 0.035 0.04 0.045 -500 0 500 1000 1500 Qc (kg/s) t(s) Upper Middle Lower Sump Contain.
Fig. 5. ISP47 - behaviour of the “dead” volume during Helium transient addition - 2002 tests series time zero corresponds to the start of helium addition (Top: gas temperature -Bottom: condensation flow)
conductivity of the insulation material of 0.3 W/m/K. Similar value (0.1 W/m/K) has also been derived for the ThAI facility. For the benchmark different strategies were proposed depending on the code capabilities. One strategy is to remove the spurious condensation mass flow from the injected mass flow. Alternatively, one can compute the thermal behaviour of the steel structure using an external heat ex-change coefficient of 3-4 W/m2/K with a hall at a constant temperature of 20◦C.
This assumes that the heat losses are homogeneously distributed. These initial and boundary conditions are summarized in Fig. 6.
7125: N10 Qsteam = 130.1 g/s 198.1°C (Phase A) 201.6°C (Phase B) Qhelium = 10.16 g/s for 1826 seconds 0 internal R0 R1 R2 R3 R4 R5 0 475 950 1425 1814 2000 6425: N9 5625: N8 4625: N7 3625: N6 600: N1 1100: N2 1575: N3 2025: N4 2625: N5 T=20°C H=3−4 W/m²/K Spurious Condensation 15.6 g/s 40% Containment walls 40% Sump
20% External part of Condensers 115.3°C 114.6°C 115.2°C Initial Conditions Dry Air 100 kPa 20°C 1.195 kg/m3
Fig. 6. ISP47: initial and boundary conditions
Examples of the atmospheric conditions in the dead volume are presented in Fig. 5 (top). First, the decrease of the injection temperature (Fig. 4) is reported in front of the condensers (R4 axis) and behind them (R5 axis). Then, the thermal transient is almost the same in front of and behind the condensers. Finally, the condensation mass flow gradually increases. So, from the available measurements, it seems that the dead volume follow the main gaseous volume.
Improvement of the mass balance (injection/condensation) was performed during the dismantling phase. The 2002 tests series lead to about 1 to 7 % difference and this reduces to less than 1 % for the 2004 tests series.
3 Participants in the benchmark exercise
Most of the institutions and computer codes involved in containment thermal-hydraulics analysis in Nuclear Reactor safety participated in this benchmark exercise (Table 1). 18 contributions used 6 CFD codes (5 in-house and only 1 commercial) and 8 LP codes. Some differences remain in the versions used for the calculations. Scaling-up between the different facilities involved in this ISP benchmark was identified as an important topic and the main characteristics of the nodalisation used are reported in Table 2 (the length scale for CFD codes and the number of nodes for lumped pa-rameter codes). Some participants submitted different contributions: NUPEC with a 2D model and a partial 3D models (1/4 of the MISTRA Facility), CEA with a LP, a 2D and a full 3D model.
The Lumped Parameter models used between 1 and 52 nodes to model the MIS-TRA facility. Radially, 3 to 5 levels were adopted depending on the choices re-garding the volume behind the condensers and the radial discretisation of the main gaseous volume into 3 zones (upward flow due to the jet, stagnant zone in the middle and downward zone near the condensers) or fewer. Axially, two different approaches can be distinguished: a coarse grid involving mainly 4 levels corre-sponding to the 3 condensers and the bottom; a finer grid using between 7 to 14 levels. One important parameter when using lumped parameter codes is the friction or form loss coefficient used to model the atmospheric junctions between compart-ments (approximation of the momentum equation). GRS used the same form loss coefficient in vertical and horizontal directions (Kform =0.3) except for horizontal
paths between the inner room and the dead volume where Kform =1.0 is used. CEA
used different coefficients for the horizontal or vertical junctions (two times higher in the horizontal direction). IRSN adjusted the horizontal coefficients between 1.0 and 10.0 to numerically obtain only one convective loop. For phase B, it used the same approach as for CEA. LEI used constant coefficients in both directions. Rules should be clearly elaborate at the end of the ISP regarding this point and especially guidelines for extrapolation at the reactor scale.
In 2D, some participants used coarse grids (AECL and NAI) but with the objective of being consistent with the real containment analysis. An intermediate number of nodes was used by FZK, NUPEC, NRG and CEA. PSI used a relatively fine grid to model the MISTRA facility. In 3D, the two grids are equivalent because NUPEC only modelled 1/4 of the MISTRA facility. Grid convergence of CFD calculations
Number Organisation Country Computer code Version Category
1 AECL Canada GOTHIC (George et al., 1999) 6.1bp2 CFD
2 UJV Czeck Republic MELCOR (Gaunt et al., 2000) 1.8.5(A)QZ(+Patch002) LP
3 IRSN France TONUS (Studer et al., 2003) V2002.2 LP
ASTEC (H.J. Allelein et al., 1999) V0.4
4 FZK Germany GASFLOW II (Travis et al., 1999) V2.2.4.21 CFD
5 GRS Germany COCOSYS (Klein-Hessling et al., 2000) V2.0 LP
ASTEC (Van Dorsselaere et al., 2005) V1.0
6 VEIKI Hungary ASTEC (Van Dorsselaere et al., 2005) V1.0 LP
7 University of Pisa Italy FUMO (Manfredini et al., 2002) Vdev LP
8 NUPEC Japan DEFINE (Ishida et al., 2001) Vdev CFD
9 NRG Netherlands CFX (CFX4.4, 2001) 4.4 CFD
10 IJS Slovenia CONTAIN (Murata et al., 1997) 2.0 LP
11 STUDVISK Sweden MELCOR (Gaunt et al., 2000) 1.8.5 LP
12 PSI Switzerland CFX (CFX4.3, 1999) 4.3 CFD
13 NAI U.S.A. GOTHIC (George et al., 2003) 7.2dev LP and CFD
14 LEI Lithuania COCOSYS (Klein-Hessling et al., 2000) 2.0 LP
15 IPPE Russia KUPOL-M (Soloviev et al., 2003) 1.10 LP and CFD
16 CEA France TONUS (Studer et al., 2003) Vdev LP and CFD
Table 1 Summary of ISP47 benchmark participants (Vde v: version under de velopment) 12
Identification Number of nodes Radial length in cm Axial length in cm
(Min/Max) (Min/Max)
GOT2D1 228 2.5 / 27.4 12.0 / 45.1
MELLP2 12 3 levels max 4 levels
TONLP3 13 4 levels max 4 levels
ASTLP3 13 4 levels max 4 levels
GAS2D4 3528 5.0 / 10.5 2.75 / 7.0
COCLP5 45 4 levels max 12 levels
ASTLP6 44 4 levels 11 levels
FUMLP7 13 4 levels max 5 levels
DEF2D8 972 8.2 / 8.2 10 / 33
DEF3D8 19950 8.2 / 8.2 10 / 33
CFX2D9 5717 2 / 13 2 / 13
CONLP10 1 -
-MELLP11 18 3 levels max 7 levels
CFX2D12 7116 1.5 / 11.8 1.4 / 6.1
GOT2D13 437 5 / 10 37.7 / 42.8
COCLP14 19 3 levels max 7 levels
KUPLP15 52 5 levels max 14 levels max
KUP2D15 1428 5.5 / 10.6 16 / 21.2
ASTLP5 45 4 levels max 12 levels
TONLP16 31 5 levels max 9 levels
TON2D16 3146 4 / 10 7.5 / 10
TON3D16 85123 (fluid) 34779 (solid) 3.3 / 10 10 / 10 Table 2
Geometrical discretisation of MISTRA facility (max: means the maximum number of nodes in a specific radial or axial axis)
is often mentionned as a necessary condition. Nevertheless, in the present exercise wall condensation in CFD is modelled by using empirical heat and mass transfer correlations. So, characteristic length scales are implicitely introduced in these cor-relations that are not compatible with grid convergence analysis.
Regarding the models used by the different participants, only some characteristics related to the present exercise are detailed:
• Equations of state for steam: most of the participants used real gas equations for steam except for the CFD contributions of NRG, PSI and CEA where a per-fect gas hypothesis was made. Such hypothesis is relevant for superheated state conditions and can lead to supersaturated conditions especially close to the con-densers (see comments below).
• filmwise steam condensation models implemented in most of the codes are based on global correlation (Uchida et al., 1965) or heat and mass transfer (HMT) analogy (Gido and Koestel, 1982, Collier, 1974) except for GASFLOW code where wall functions are implemented. Regarding commercial CFD codes, cor-relations based on HMT analogy were implemented for the present exercise. • fog formation or homogeneous condensation in CFD: only GOTHIC and
GAS-FLOW codes have homogeneous condensation models.
• turbulence models in CFD: so called standard k-ε models are implemented in the different CFD codes except in TONUS code where an algebraic model based on a single and spatially constant mixing length is used.
4 Steady state results
4.1 Pressure and mean temperature
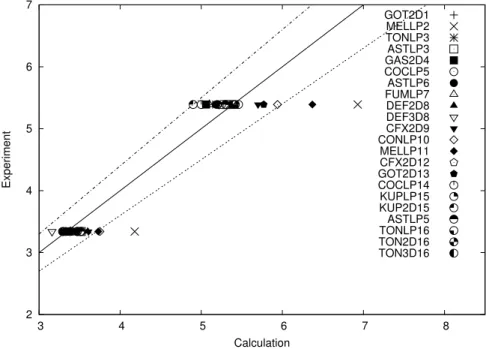
Accurate predictions of the pressure during a severe accident scenario may be the most important requirement for a severe accident computer code. For the two phases A and B, the results are displayed in Fig. 7 (the experimental uncertain-ties are estimated of +/- 0.03 bar). Three participants (MELLP2, MELLP11 and CONLP10) have computed pressure with more than 10% overestimation (Phases A and B). Post-test calculations for the contribution MELLP2 have shown that this overestimation is related to the set of correlation used by MELCOR code to solve heat and mass transfer along walls. Generally, most of the participants tend to
derestimate the pressure (about 0.2 bar) at phase B steady-state and overestimate (0.1 bar) at phase A steady-state and no clear distinction can be made between LP or CFD contributions. Differences are related to the steam mass content and so de-pend on the modelling of steam mass transfer at the wall. If we assume that the steam mass flux at the film interface is expressed by
Φsteam,int =kmρsteam,bulk− ρsteam,int
1 − Xsteam,int , (1)
where X denotes the steam molar fraction, kmis the mass transfer coefficient and ρ
the density, this flux must be the same for Phases A and B (same steam injection conditions). Since the interface conditions (subscript int) are only constrained by the condenser temperature and the presence of helium decreases the mass transfer coefficient, the mass flux may be kept constant only by increasing the steam content in the bulk. To illustrate this point, the differences for example, in the two GOTHIC contributions (pressure of 5.13 bar for GOT2D1 and 5.77 bar for GOT2D13) are related to the above phenomenon. The mean temperature differences can only lead to about only 1% pressure increase and different wall condensation modelling are used: MDML model which is a kind of HMT analogy including the generation of mist in the boundary layer in GOT2D13 contribution and maximum value between Uchida (Uchida et al., 1965) and Gido-Koestel (Gido and Koestel, 1982) correla-tions in GOT2D1 contribution. For the COCOSYS/ASTEC code (5 contribucorrela-tions), the computed pressure for Phase B is between 5.0 and 5.32 bars (+/- 3%). Detailed explanations of the differences in steam mass content would involve a detailed ex-amination of the wall condensation modelling but it is beyond the scope of the present benchmark exercise.
Mean temperature prediction at the steady-state can yield an interesting information but evaluation of such a temperature is difficult experimentally (intensive variable based on a limited number of thermocouples). Mean temperatures are derived by using the thermocouples along the R2 vertical axis and by weighting their mea-surements by the thermocouple distance. The experimental results give 124.4◦C for Phase A and 128.2◦C for Phase B. By using global correlations such as Uchida for example, this gas temperature increase is related to the decrease of the total heat transfer coefficient (condensation and convection). As for the simulations, the mean gas temperature ranges between 121◦C and 135◦C for Phase B and the same deviations are obtained for Phase A. Gas temperatures are mainly controlled by the convective part of the heat transfer along the condensers (see appendix) and within the present benchmark exercise, correlations between these two variables were not
2 3 4 5 6 7 3 4 5 6 7 8 Experiment Calculation GOT2D1 MELLP2 TONLP3 ASTLP3 GAS2D4 COCLP5 ASTLP6 FUMLP7 DEF2D8 DEF3D8 CFX2D9 CONLP10 MELLP11 CFX2D12 GOT2D13 COCLP14 KUPLP15 KUP2D15 ASTLP5 TONLP16 TON2D16 TON3D16
Fig. 7. Pressure (in bar) for the two steady-states A and B (dotted lines correspond to 10% deviation)
seen.
4.2 Condensation distribution along condensers
Condensation distribution along the condensers is experimentally influenced by the injection conditions (Table 3). The improvements regarding the injection device (described in 2.1) have introduced some differences in the condensation distribution mainly regarding Phase A steady-state. The steam condensation flux increases on the upper condenser and a reduction of this condensation flux is measured between the upper and the lower condensers (decrease of the steam mass fraction in the downward flow). Phase B results clearly show the increase of the contribution on the upper condenser compared to the middle condenser. Compared to the Phase A results, the differences regarding the two tests series (2002 and 2004) are not so important. For the Phase B, the condensation distribution along the condensers is mainly controlled by the condenser themselves rather than the mixing process in the upward flow.
Comparisons between experiments and calculation require an additional variable. Spurious condensation has been introduced by the participants in different ways. Some participants subtracted this variable from the injection mass flow rate, others
Identification Phase A 2002 Phase A 2004 Phase B 2002 Phase B 2004
Upper condenser 1.949 2.233 2.355 2.645
Middle condenser 1.491 1.836 1.093 1.266
Lower condenser 1.401 1.095 1.225 1.134
Table 3
Steam condensation fluxes (g/s/m2) along the three condensers (upper condenser 21.4m2,
middle condenser 21.4m2 and lower condenser 26.2m2 and the difference up to the mass balance is part of the spurious condensation)
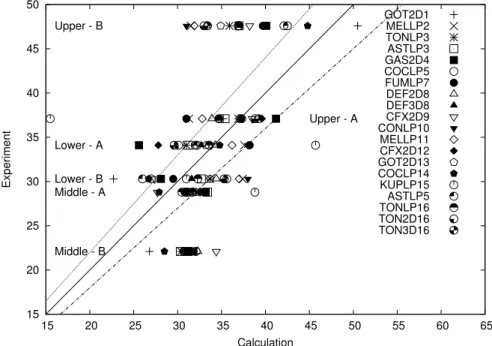
do not take it into account or model it using the thermal behaviour of the external vessel. Now, we consider the part represented by each condenser (Fig. 8 and 9) in the total condensed mass flow along the three condensers (about 88% of the injected mass flow rate). ASTLP6 contributions (not reported in Fig. 8 and 9) have shown a special behaviour with condensation occurring only on the lower condenser. Post-test calculations have shown that this specific flow pattern is due to a absence of specific nodalisation close to the injection. In a LP code, orientation of the injection (vertical in the MISTRA facility) is obtained by driving the injected flow upwards (enough detailed nodalisation, pressure drop coefficient or absence of horizontal atmospheric junction). 15 20 25 30 35 40 45 50 15 20 25 30 35 40 45 50 55 60 65 Experiment Calculation Upper - A Middle - A Lower - A Upper - B Middle - B Lower - B GOT2D1 MELLP2 TONLP3 ASTLP3 GAS2D4 COCLP5 FUMLP7 DEF2D8 DEF3D8 CFX2D9 CONLP10 MELLP11 CFX2D12 GOT2D13 COCLP14 KUPLP15 ASTLP5 TONLP16 TON2D16 TON3D16
Fig. 8. Condensation distribution (percentage) for the two steady-states A and B - 2002 tests series (dotted lines correspond to 10% deviation)
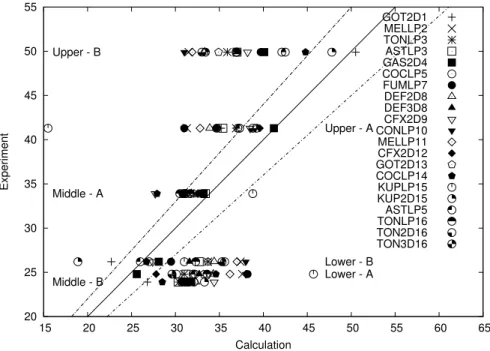
20 25 30 35 40 45 50 55 15 20 25 30 35 40 45 50 55 60 65 Experiment Calculation Upper - A Middle - A Lower - A Upper - B Middle - B Lower - B GOT2D1 MELLP2 TONLP3 ASTLP3 GAS2D4 COCLP5 FUMLP7 DEF2D8 DEF3D8 CFX2D9 CONLP10 MELLP11 CFX2D12 GOT2D13 COCLP14 KUPLP15 KUP2D15 ASTLP5 TONLP16 TON2D16 TON3D16
Fig. 9. Condensation distribution (percentage) for the two steady-states A and B - 2004 tests series (dotted lines correspond to 10% deviation)
Looking at the other contributions, the range of the computed values is the widest for the upper condenser. Several reasons may be pointed out: the flow has to turn before the development of the boundary layers, higher steam content in the upper part of the facility and condensation in the dead volume. Condensation models are probably not adequate for such situations because these correlations address diffu-sion of steam through non-condensible gases in a fully developed boundary layer. This mainly leads to an underestimation of the condensation mass flow rate. For phase A, the LP and CFD codes run on coarse grids or which use mixing length turbulence models lead to results close to the 2002 test series (enhanced mixing at the injection) and CFD codes run on fine grid and k-ε turbulence model are close to the 2004 tests series (injection conditions free of turbulence). For the lat-ter, large differences are obtained between, for example, the two CFX contributions perhaps due to implementation of wall condensation models. Results of GAS2D4 and CFX2D12 match the condensation distribution along the 3 condensers (Phase A - Fig.9) with gas temperature along R4 about 4-5◦C above the experimental val-ues and steam concentration relatively close to the experimental results. For Phase B, the contribution of the upper condenser is only matched by GOT2D1, COCLP14 and KUP2D15. The middle condenser part is always overestimated (consequence of the upper condenser contribution and effect of saturation state). Some multi-compartment LP contributions (MELLP2, FUMLP7 and MELLP11) compute
tribution close to the surface ratio between each condenser and the total condensing area (no spatial effect). Apart from ASTLP6, the different ASTEC/COCOSYS con-tributions lead to almost the same results with different nodalisations.
4.3 Mass and energy balances
The mass balance is derived from the steady-states, when the injected mass flow is equal to the condensed mass flow. Regarding the energy balance, the extracted power is divided into three components: condensation (latent heat), convection and liquid drain out. Experimentally, about 79% of the power correspond to the latent heat transfered to the wall and 17% is removed by the liquid drain out. The remain-ing 4% represents the convective part of the heat transfer. Similar distributions were recovered by some participants but it is not possible to correlate the variations with the over or under-estimations of the gas temperature.
4.4 Profiles
Vertical and radial gas temperature and gas concentration profiles are recovered from the experimental measurements. The first active zone in this simple flow pat-tern is the rising buoyant jet (injection Richardson number Ri = g(ρ−ρinj)Dinj/ρUinj2
is 0.09). An example of gas temperature profiles is plotted in Fig. 10. The differ-ence in the two tests series corresponds to the presdiffer-ence of the potential zone above the injection device (5 diameters distance) and the main effect is that hotter gaseous mixture reaches the top of the facility when the potential zone is present (about 5◦C difference). Effect of the injection conditions on the jet spreading and the maxi-mum velocity is plotted in Fig. 11. Unfortunately, the quantitative comparison is not possible for the ISP47 Phase A. Instead we use the MICOCO experimental results: 120 g/s of steam injection and 120◦C on the three condensers (Blumen-feld and Paill`ere, 2003). Nevertheless, the 2002 results of the ISP47 have shown quite similar behaviour, ie. the off-centered maximum of the vertical velocity due to misalignement of the laser beams or presence of leakage in the injection device. Regarding simulation, the LP codes are not designed to simulate this potential zone and the CFD codes with fine grids and k-ε turbulence models reproduce this poten-tial zone. The use of coarse grids or algebraic turbulence models lead to enhanced mixing close to the injection with a faster decrease of the gaseous temperature.
Accurate simulation of this zone may be important for the condensation along the upper condenser (see appendix and Table 3) especially for Phase A steady-state.
110 120 130 140 150 160 170 180 190 200 210 0 1000 2000 3000 4000 5000 6000 7000 8000 T (Celsius) z(mm) Exp.2002 Exp.2004 GOT2D1 GAS2D4 DEF2D8 DEF3D8 CFX2D9 GOT2D13 KUP2D15 TON2D16 TON3D16
Fig. 10. ISP47 - Phase B - Gas temperature along R0 axis
-0.5 0 0.5 1 1.5 2 2.5 3 3.5 0 500 1000 1500 2000 UZ (m/s) Radius (mm) ISP47_PhaseA MICOCO-2004 MICOCO-2002
Fig. 11. MISTRA - L.D.V. measurements of the vertical velocity at elevation 4341 mm (MICOCO Air/Steam steady states: 2004 and 2002 tests series compared to ISP47 Phase A 2002 tests series)
The second active zone inside the MISTRA facility is the downward flow close 20
to the condensers. In this region, due to steam condensation, the gaseous mixture becomes colder and heavier and the non condensible gas fraction increases from the top to the bottom (Fig. 12). Differences are computed in terms of average con-centration and gradients. First of all, average values can vary by about 15-20% in relative concentration and this can be correlated with the pressure deviations. Then, gradients vary from less than 1 vol% (MELLP11) up to 6 vol% (KUP2D15) along the height of the three condensers with also opposite sign (KUPLP15 computes an increase in helium content from the bottom to the top). Some computed curves have a constant slope while the others are composed of a two straight lines with dif-ferent slopes. The experimental measurements show an increase of about 4 vol% in the helium content and due to the measurements uncertainty, it is impossible to determine whever the helium concentration curve has a constant slope or not. During Phase A steady state (Fig. 13), conditions close to steam saturation are mea-sured and computed along the lower condenser. Fig. 13 shows that superheating increases with height (about 5-7◦C superheating at the top of the upper condenser). Some codes predict well the saturation and the superheating, while most codes don’t predict saturation but too much superheating. Large differences are computed leading to about 10◦C overestimation. Effect of the convective heat transfer coef-ficient along the condenser has been identified as a key parameter (see appendix) and deeper investigations are needed in this field.
During phase B steady-state (Fig. 14 and 19), conditions close to the steam satura-tion are reached at the two lower condensers and superheating is limited to the up-per condenser. This result is corroborated by the exup-perimental observation through the lower viewing windows (appearance of fog) and the problems related to the LDV measurements. This behaviour is computed by a limited number of codes and it can be clearly seen that LP codes incorporate fog models that constrain satura-tion as a bounding state and some CFD codes compute supersaturated condisatura-tions. Implementation of fog models is a necessary step to deal with such thermodynamic conditions.
The last question regarding gas concentrations concerns the presence or absence of gas stratification in the zero velocity zone around the R2 vertical axis and the achieved mixing between air and helium. The measurements along the R2 axis have shown that the helium concentration difference is in the order of 2 vol% from the top to the bottom of the MISTRA facility (close to homogeneous conditions accord-ing to the accuracy of the gas concentration measurement technique). So, we cannot
24 26 28 30 32 34 36 0 1000 2000 3000 4000 5000 6000 7000 8000 [He] (vol%) z(mm) Exp. 2004 COCLP5 ASTLP6 FUMLP7 MELLP11 KUPLP15 ASTLP5 TONLP16 24 26 28 30 32 34 36 0 1000 2000 3000 4000 5000 6000 7000 8000 [He] (vol%) z(mm) Exp. 2004 GOT2D1 GAS2D4 DEF2D8 DEF3D8 GOT2D13 KUP2D15 TON2D16 TON3D16
Fig. 12. ISP47 - Phase B - Helium concentration along R4 axis (measurements available only for 2004 tests series)
conclude that there exists any stable gas stratification along the R2 axis or whether the small extent of this zero velocity zone associated to the injection/condensation boundary conditions is not sufficient to provide favourable conditions for a strati-fication to develop. Using the gas concentration measurements for Phase B steady state, we can conclude that helium is well mixed with the air initially present in-side the facility (55.8 vol% of helium in the Air/Helium mixture with a standard deviation of 0.3 vol%). This result is valid in the main gaseous volume (not close
-5 0 5 10 15 0 1000 2000 3000 4000 5000 6000 7000 8000
Tgas - Tsat (Celsius)
z(mm) Exp. MELLP2 TONLP3 ASTLP3 COCLP5 ASTLP6 FUMLP7 CONLP10 MELLP11 COCLP14 ASTLP5 TONLP16 -5 0 5 10 15 0 1000 2000 3000 4000 5000 6000 7000 8000
Tgas - Tsat (Celsius)
z(mm) Exp. GOT2D1 GAS2D4 DEF2D8 DEF3D8 CFX2D9 CFX2D12 GOT2D13 TON2D16 TON3D16
Fig. 13. ISP47 - Phase A - Saturation profile along R4 axis (Experiment: estimations using 2002 experiment 16/04 and confirmed by 2004 tests series - Top: LP codes - Bottom: CFD codes)
to the injection device N5 and N6 levels on R0 axis). Simulations provide the same result.
Finally, typical axial velocity (mean and root mean square value) profiles along the L.D.V. radius (z=4341 mm) are plotted in Fig. 15. The radial grid used by LP codes is too coarse to capture the radial profiles. Nevertheless, the maximum value
-5 0 5 10 15 0 1000 2000 3000 4000 5000 6000 7000 8000
Tgas - Tsat (Celsius)
z(mm) Exp 2004 COCLP5 ASTLP6 FUMLP7 MELLP11 ASTLP5 TONLP16 -5 0 5 10 15 0 1000 2000 3000 4000 5000 6000 7000 8000
Tgas - Tsat (Celsius)
z(mm) Exp 2004 GOT2D1 GAS2D4 DEF2D8 DEF3D8 CFX2D9 GOT2D13 KUP2D15 TON2D16 TON3D16
Fig. 14. ISP47 - Phase B - Saturation profile along R4 axis (Top: LP codes - Bottom: CFD codes)
of the axial velocity computed by COCLP5 is comparable to those obtained by the CFD contributions and the “mean” value computed by FUMLP7 or TONLP16 is also in agreement with the CFD ones (between 0 and 1000 mm). For CFD codes, the spread of the maximum value of Uz is important (between 1 and 2 m/s) and the
highest values are related to the contributions that have predicted the potential zone. Then, the jet zone is connected to a zero velocity zone at about 800 mm and the presence of the condensing wall appears after 1400 mm. The computed downwards
-1 -0.5 0 0.5 1 1.5 2 2.5 3 3.5 4 0 500 1000 1500 2000 Uz (m/s) Radius (mm) Exp. GOT2D1 GAS2D4 COCLP5 FUMLP7 DEF2D8 DEF3D8 CFX2D9 CFX2D12 GOT2D13 COCLP14 KUPLP15 TONLP16 TON2D16 TON3D16 0 0.05 0.1 0.15 0.2 0.25 0.3 0.35 0.4 0.45 0.5 0 500 1000 1500 2000 Uz r.m.s. (m/s) Radius (mm) Exp. GOT2D1 DEF2D8 DEF3D8 CFX2D9 GOT2D13
Fig. 15. ISP47 - Phase A - Axial velocity and r.m.s. velocity along L.D.V. axis (Experiment: 2002 tests series)
velocity along the condenser ranges between 0.2 and 0.5 m/s with an experimental value of 0.2 m/s at about 100 mm of the condenser wall. Closer, beam reflexions and low signal to noise values do not allow good measurements. Axial r.m.s velocity profiles clearly identify where the velocity gradients are located: border of the jet and dynamic boundary layer. Simulations explain differences in the radial profiles especially for the GOTHIC contributions.
5 Some interesting transient results
Transients are not the first objectives of the MISTRA exercise. Nevertheless, some interesting phenomena have been recorded during and after the transient helium addition to the main steam carrier flow. Along the lower condenser (Fig. 16 and 5), a sudden decrease of the condensation mass flow rate is observed at the beginning of helium addition (4 g/s). At the end of Phase A, the gaseous mixture close to the lower condenser is at the saturation state (Fig. 13) and any change of the mixture composition affect the condensation mass flow rate. Then, a linear decrease of 8 g/s is measured during the helium addition. On the middle condenser, the same decrease is measured without the initial jump and on the upper condenser (Fig. 17), the condensation mass flow rate is not affected by the helium addition. It has been confirmed that this result is independent of the injection temperature (Fig. 4) and injection conditions as such, is the consequence of helium addition. None of the participants really match the above transient behaviour for the three condensers and it seems that the better contribution is coming from the GOTHIC code (MDML model for the lower and middle condenser and global correlation for the upper condenser).
In the experiments, the phase B steady-state is reached after 4 hours of transients and this relatively long time scale is related to the mixing process in the lower head of the MISTRA facility (Fig. 18). In this region, out of the main convective loop, the time scale for helium enrichment (by convection/diffusion processes) corresponds to these 4 hours. The accurate behaviour of the lower head of the facility is not simulated by the participants mainly because attention has not been paid to model this region apart from the main gaseous volume. Post-test calculations regarding this specific point may be interesting and helium enrichment in the lower part of a vessel is investigated in the Thai facility using upper injection with low momentum.
6 Discussions and conclusions
First of all, the MISTRA experimental results show it is possible to achieve repeat-able measurements on the following phenomena:
• Interaction between injection and wall condensation: modifications in the in-26
-0.02 -0.015 -0.01 -0.005 0 0.005 0.01 0.015 -500 0 500 1000 1500 2000 Qc - Qca (kg/s) t(s) Exp. MELLP2 TONLP3 ASTLP3 COCLP5 FUMLP7 CONLP10 MELLP11 KUPLP15 ASTLP5 TONLP16 -0.02 -0.015 -0.01 -0.005 0 0.005 0.01 0.015 -500 0 500 1000 1500 2000 Qc - Qca (kg/s) t(s) Exp. GOT2D1 GAS2D4 GOT2D13 KUP2D15 TON2D16 TON3D16
Fig. 16. Transient behaviour of steam condensation along the lower condenser (time zero corresponds to the beginning of helium addition and the results are scaled with Phase A results)
jection (suppression of leakage) change the condensation distribution along the condensers for the two steady-state situations;
• Saturation behavior: helium addition modifies the saturation profile along the three condensers;
-0.02 -0.015 -0.01 -0.005 0 0.005 0.01 0.015 -500 0 500 1000 1500 2000 Qc - Qca (kg/s) t(s) Exp. MELLP2 TONLP3 ASTLP3 COCLP5 FUMLP7 CONLP10 MELLP11 KUPLP15 ASTLP5 TONLP16 -0.02 -0.015 -0.01 -0.005 0 0.005 0.01 0.015 -500 0 500 1000 1500 2000 Qc - Qca (kg/s) t(s) Exp. GOT2D1 GAS2D4 GOT2D13 KUP2D15 TON2D16 TON3D16
Fig. 17. Transient behaviour of steam condensation along the upper condenser (time zero corresponds to the beginning of helium addition and the results are scaled with Phase A results)
Gas concentration stratification occurs in the lower part of the facility where only few measurement points are available. Also less attention has been paid by the benchmark participants (LP and CFD codes) to this region, and it is not possible to conclude on predictive capabilities of codes regarding gas concentration stratifica-tion by using only MISTRA results.
From the blind benchmark exercise, it can be concluded that LP codes give reason-able results if the nodalisation is sufficient to capture the main findings of the flow pattern. Some LP codes are able to simulate the flow pattern when free volumes are subdivided by using adequate nodalisation. Missing user experience can lead to large deviations from experimental values (wrong flow pattern and large pres-sure overestimation). Guidelines and nodalisation rules must be strictly followed. LP codes usually incorporate fog modeling, and this is an important point for the Phase B steady-state situations in order to avoid subcooled conditions.
Regarding CFD contributions, some capabilities have been demonstrated especially regarding computation of transients, modeling of filmwise steam condensation and jet injection. Experienced users of codes such as GOTHIC or GASFLOW for ex-ample provide valuable contributions. Nevertheless some open questions remain such as:
• Simulation of a rising jet with a coarse grid or using an algebraic turbulence model;
• Impact of wall thermal boundary conditions instead of computing the thermal behavior of the steel vessel wall.
0 5 10 15 20 25 30 35 -2000 0 2000 4000 6000 8000 [He] (vol%) t(s) Exp.CG120 Exp.CG520 GOT2D1 GAS2D4 GOT2D13 KUP2D15 TON2D16
Fig. 18. Transient behaviour of helium addition in the lower part of MISTRA vessel ie below the injection level (time zero corresponds to the beginning of helium addition - Ex-periment: 2004 tests series)
Implementation of condensation models in a commercial CFD code has been per-formed by some contributors, but the calculated pressure and temperature data show some notable differences when compared to Phase A results, such that additional development and validation work will be needed. At the time of the MISTRA exer-cise, only few CFD codes had implemented bulk condensation models; additional improvement and also validation work is needed in this field.
The distribution of the condensation flow along the three condensers is matched by none of the participants for the two steady-state situations and also the transient phase. Differences between measured and calculated data increase for the Phase B results as compared to those of Phase A. Experimental data show that this distri-bution is affected by the steady-state steam injection conditions and the transient helium addition. Due to interacting phenomena, analysis and explanation of the condensation distribution are difficult, and post-test calculations or simplified ana-lytical case studies (flow impingement for example) may be interesting to enhance the current knowledge.
As also pointed out during former ISP exercise, the use of a computer code (LP or CFD) for containment thermal-hydraulic must be made according to the respect of suitable code guidelines to guarantee an acceptable level of confidence.
Despite relative simple flow pattern inside the MISTRA facility, large deviations (up to 20%) are obtained for the gas temperature and the gas concentration profiles mainly due to an over prediction of the superheating. This may be not compatible with the narrow gas concentration range related to hydrogen combustion processes.
7 NOMENCLATURE
ai : linear response model coefficients
Cp : heat capacity (J/kg/K)
H : heat exchange coefficient (W/m2/K)
km : mass transfer coefficient (m/s)
Lmix : mixing length (m)
Lv : latent heat (J/kg)
M : mass (kg)
Φ : mass flux (kg/s/m2)
Q : mass flow rate (kg/s) ρ : density (kg/m3) T : temperature (K) U : velocity (m/s) X : molar fraction Xi : parameters Yi : responses
inj : subscript for injection conditions r.m.s. : root mean square
8 ACKNOWLEDGEMENTS
The authors would like to acknowledge the MISTRA experimental team: D. Abdo, J. Brinster, D. Roumier, R. Tomassian and J.L. Widloecher for the quality of the experimental results and M. Krause, Y.S. Chin, Z. Parduba, A. Bentaib, W. Plume-cocq, G. Necker, P. Royl, J. Travis, S. Schwarz, G. Lajtha, S. Paci, N. Ishida, S. No-hubide, M. Houkema, I. Kljenak, Z. Yitbarek, F. Putz, T.L. George, C.L. Wheeler,
E. Urbonavius, A.A. Lukianov and W. Luther involved in the benchmark exercise for their valuable contributions, comments and discussions. The authors would also like to acknowledge the support of OECD in the framework of ISP47 and especially the secretaries J. Royen and Y.H. Ryu as well as IRSN and TECHNICATOME sup-port for the MISTRA programme.
References
Blumenfeld, L., Paill`ere, H., October 2003. CFD simulation of mixed convection and condensation in a reactor containment: the MICOCO benchmark. The 10th International Topical Meeting on Nuclear Reactor Thermal-Hydraulics.
CFX4.3, 1999. Documentation. Tech. rep., CFX International, AEA Technology, Harwell laboratory, Oxfordshire OX11 0RA, United Kingdom.
CFX4.4, 2001. User Guide. Tech. rep., Computational Fluid Dynamics Services, AEA Technology, Harwell laboratory, Oxfordshire OX11 0RA, United King-dom.
Collier, J. G., 1974. Convective boiling and condensation. Oxford Science Publica-tion.
Gaunt, R., Cole, R., Erickson, C., Gido, R., Gasser, R., Rodriguez, S., Young, M., 2000. MELCOR Computer Manual: Version 1.8.5. Tech. rep., NUREG/CR-6119.
George, T. L., Wiles, L. E., Claybrook, S. W., Wheeler, C. L., McElroy, J. D., 1999. GOTHIC Containment Analysis Package, Technical Manual, Version 6.1. Tech. rep., EPRI RP4444-1, NAI 8907-06 Rev 9.
George, T. L., Wiles, L. E., Claybrook, S. W., Wheeler, C. L., McElroy, J. D., Singh, A., 2003. GOTHIC Containment Analysis Package Technical Manual Version 7.1. Tech. rep., NAI-8907-06 Rev.13.
Gido, R. G., Koestel, A., 1982. Containment condensing heat transfer. Tech. rep., LA-UR-82-1759.
Haste, T. J., Adroguer, B., Brockmeier, U., Hofman, P., Mller, K., Pezzili, M., 1995. In-vessel core degradation in LWR severe accidents: a state-of-the-art report. Tech. rep., AEA/CS R1025/W.
H.J. Allelein, H. J., Bestele, J., Neu, K., Jacq, F., Kissane, M., Plumecocq, W., Van Dorsselaere, J. P., 1999. Severe accident code ASTEC development and val-idation. EUROSAFE conference, Paris.
Ishida, N., Nagayoshi, T., Kawabata, O., Kajimoto, M., Tanaka, N., 2001. Analysis 32
of Hydrogen behavior in a PWR Containment vessel under Spray operations. SMIRT 16 Conference, Washington DC.
Karwat, H., 1989. International standard problem ISP-23: Rupture of a large diam-eter pipe within the HDR containment. Tech. rep., OECD,NEA/CSNI/R(89)160. Karwat, H., 1993. International standard problem ISP-29: Distribution of hydro-gen within the HDR containment under severe accidents conditions. Tech. rep., OECD/NEA/CSNI/R(93)4.
Klein-Hessling, W., Arndt, S., Weber, G., 2000. COCOSYS V1.2 User manual, Reference manual and Implementation manual. Tech. rep., GRS.
Lepallec, J. C., Studer, E., Royer, E., September 2003. PWR rod ejection accident: uncertainty analysis on a high burn-up core configuration. SNA2003.
Manfredini, A., Oriolo, F., Paci, S., 2002. FUMO Code Manual Volume 1: System Models. Tech. rep., Dipartimento di Costruzioni Meccaniche e Nucleari, Univer-sit`a degli Studi di Pisa, Report RL 533.
Murata, K. K., Williams, D. C., Tills, J., Griffith, R. O., Gido, R. G., Tadios, E. L., Davis, F. J., Martinez, G. M., 1997. Code Manual for CONTAIN 2.0. Tech. rep., SAND97/1735, NUREG-CR/65.
NUPEC, 1994. Final comparison report on ISP-35: NUPEC hydrogen mixing and distribution test M7-1. Tech. rep., OECD/NEA/CSNI/R(94)29.
OECD/NEA, 1999. State-of-the-art report on containment thermal-hydraulics and hydrogen distribution. Tech. rep., OECD/NEA/CSNI/R(99)16.
Soloviev, S. L., Vasilenko, V. A., Gabaraev, B. A., 2003. Development and valida-tion of safety analysis codes for Russian reactors. EUROSAFE conference. Studer, E., Magnaud, J. P., Dabbene, F., Paill`ere, H., October 2003. On the use of the
MISTRA coupled effect test facility for the validation of containment thermal-hydraulics codes. The 10th International Topical Meeting on Nuclear Reactor Thermal-Hydraulics.
Tkatschenko, I., Studer, E., Magnaud, J. P., Simon, H., Paill`ere, H., October 2005. Status of the MISTRA programme for the validation of containment thermal-hydraulic codes. No. Paper 319. The 11th International Topical Meeting on Nu-clear Reactor Thermal-Hydraulics.
Travis, J. R., Spore, J., Royl, P., Necker, G., 1999. Theoretical and computational models of GASFLOW II code. Vol. 11. SMIRT 15.
Uchida, H., Oyama, A., Togo, Y., vol.13, pp 93-102 1965. Evaluation of post inci-dent cooling system in Light Water Reactors. Third international conference on peaceful uses of atomic energy.
- integrating severe accident research in Europe. ICAPP05 conference, Seoul.
APPENDIX: Parametric study using Design-Of-Experiments techniques around Phase A steady-state using TONUS CFD code
Effect of the user parameters and the experimental uncertainty on the boundary conditions have to be quantified to provide a complete numerical study of this ISP exercise. The first step is to select the parameters and the range of each one. The second step is to define the variables to study. In the following paragraphs, these variables are called responses. Then, a methodology to perform the sensitivity study has to be chosen. In our case, the Design-Of-Experiments techniques have been applied in order to optimise the number of calculations (mainly due to CPU and memory costs with CFD code). Finally, the results have to be analysed.
The parameters may have different origins. The first one comes from the user pa-rameter included in each computer code. Five papa-rameters have been identified in the present TONUS modelling. One is related to the turbulence modelling: the mixing length (Lmix). Two are related to heat transfer coefficient: convective heat transfer
along the condensers (”user” specified) Hconv and the external heat transfer
coeffi-cient Hext(used to simulate the heat losses) and the two last are related to the perfect
gases hypothesis used to model the steam: the steam heat capacity Cpsteam and the
latent heat Lv. The second origin is the uncertainties in the experimental
bound-ary conditions. The six selected parameters are related to the initial conditions in the MISTRA facility (initial mass of air Mair), the injection steam mass flow rate
(Qsteam), injection temperature (Tinj) and the surface temperature of the three
con-densers (Tcup, Tcmed and Tclow). The variations chosen for all these parameters are
summarised in Tab. 4 and they correspond to estimated experimental uncertainty or engineer’s judgement of reasonable variations.
Parameter Name Variation (+/-)
Initial Mass of Air Mair 1,6%
Injection Steam Mass Flow Rate Qsteam 3 g/s
Injection Temperature Tinj 4◦C
Upper Condenser Temperature Tcup 1◦C
Middle Condenser Temperature Tcmed 1◦C
Lower Condenser Temperature Tclow 1◦C
Mixing Length Lmix 50%
External Heat Exchange Coefficient Hext 2W/m2/K
Convective Heat Transfer Coefficient along the condensers Hconv 40%
Steam Heat Capacity Cpsteam 6%
Latent Heat Lv 4%
Table 4
Parameters selected for the sensitivity study
A = −1 −1 −1 −1 −1 −1 −1 −1 −1 −1 −1 −1 −1 −1 −1 −1 1 1 1 1 1 1 −1 −1 1 1 1 −1 −1 −1 1 1 1 −1 1 −1 1 1 −1 1 1 −1 −1 1 −1 1 1 −1 1 1 −1 1 −1 1 −1 −1 1 1 1 −1 1 1 −1 1 −1 −1 1 −1 1 1 −1 −1 1 1 −1 1 −1 1 −1 1 −1 1 1 1 −1 −1 −1 1 1 −1 −1 1 1 1 −1 1 1 −1 −1 1 1 1 −1 −1 −1 −1 1 1 −1 1 1 1 −1 1 −1 1 −1 −1 −1 1 1 1 1 −1 −1 1 −1 1 −1 1 1 −1 (2)
So, eleven parameters have been selected for this sensitivity study. To avoid a very large number of calculations (211 = 2048), it has been decided to apply Design-Of-Experiments techniques (Lepallec et al., 2003). A screening approach has been adopted because at present time, only the first order is of interest and so a linear response model (LRM) without interactions has been selected. If a result is called Y (response) and the parameters Xifor i=1 to 11, 12 coefficients of the linear response
models have to be determined called aifor i= 0 to 11.
Yi=
11 X
i=0
aiXi (3)
This needs 12 calculations using the calculation matrix A (see eq. 2) where each row corresponds to a calculation and each column to a parameter Xi. The value of
the parameters have been normalised in order to allow direct comparison of their value. The accuracy of the Linear Response can be checked at the end by a direct comparison of the model response in the centre of the variation domain compared to a calculation with the parameter at their reference value. The sensitivity study has been performed with the TONUS CFD using the 2D axisymetric model using only the Phase A boundary conditions. Absence of accurate fog modelling in the TONUS code does not allow the same study for the Phase B steady-state. This will be rerun when the model is available.
Several responses (Yi) have been selected including the pressure (Ptot), mean gas
temperature (Tfm), condensation mass flow rate on the three condensers (Qc),
spu-rious condensation (Qc,spurious), the temperature difference between levels N3 and
N10 on R2 axis (∆Th/b), difference between Tgasand Tsat at level N3 and N10 on
R2 axis and finally, the maximum and the minimum vertical velocity at the LDV radius. The results of the sensitivity study are reported in Table 5. The different coefficients in the main table (a1to a11) are expressed in terms of % of the selected response Yi. For example, setting the external heat exchange coefficient (Hext) to
its highest estimated value (+1 or 6W/m2/K) leads to an increase (+ sign) of the spurious condensation mass flow rate of about 50.8%. Before interpreting this re-sult, it is interesting to check the validity of the LRM by comparing the results of the LRM in the centre of the variation domain (a0coefficient) with the correspond-ing 2D calculation (called 2D verification). The errors for the global variables are quite satisfactory (below 5%). The maximum values are related to the condensation mass flow rates on the three condensers and these responses are strongly coupled together so interactions between parameters have to be taken into account if the goal is to obtain more accurate results. This remark is also valid for most of the
Ptot Tfm Qc,low Qc,med Qc,up Qc,spurious ∆Th/b ∆Tsat,h ∆Tsat,b Uz,max Uz,min (bars) (◦C) (g/s) (g/s) (g/s) (g/s) (◦C) (◦C) (◦C) (m/s) (m/s) Mean a0(1) 3.314 124.96 30.95 34.88 42.86 21.28 8.49 3.07 9.25 1.68 -0.26 a1,Mair 1.44 0.03 -0.23 -0.63 -0.05 0.69 -4.39 6.95 -1.73 0.29 -0.57 a2,Qsteam 0.18 0.11 4.16 2.80 2.26 -0.89 3.42 -3.58 1.57 1.14 1.20 a3,Tinj -0.03 0.31 -0.35 0.68 -0.24 0.05 5.76 6.89 7.20 1.80 1.70 a4,Tc,up 0.56 0.23 7.67 8.31 -12.87 0.87 -3.33 7.11 -0.36 -0.66 -0.76 a5,Tc,med 0.45 0.21 9.87 -15.78 5.60 1.03 2.58 -4.51 0.27 -0.88 -0.76 a6,Tc,low 0.56 0.28 -17.75 7.29 6.94 1.02 0.64 0.98 1.17 -0.80 0.51 a7,Lmix -0.40 -0.50 7.72 -0.34 -4.90 -1.34 -30.03 21.66 -12.41 -26.31 7.77 a8,Hext -1.07 -0.28 -10.41 -9.83 -9.41 50.80 2.03 4.45 2.95 0.48 0.25 a9,Hconv 0.00 -1.67 -1.59 0.45 -0.56 1.20 -2.36 -76.22 -27.05 2.00 1.89 a10,Cpsteam 0.03 0.32 0.20 -0.12 0.48 0.01 3.23 8.96 5.75 -0.35 0.69 a11,Lv 0.15 0.02 0.42 0.54 0.90 -3.87 -3.52 4.83 -0.77 1.35 0.82 Ref. (2) 3.303 124.07 32.66 33.69 41.99 21.65 7.57 2.64 8.20 1.49 -0.26 Err. (1-2)/2 0.003 0.007 -0.052 0.035 0.021 -0.017 0.122 0.163 0.128 0.129 0.010 Table 5 Results of the sensiti vity study (bold font is used to highlight the main contrib utors and Ref. corresponds to the 2D verification of the linear response model) cal variables because the errors are greater than 12% except the minimum velocity for which the linear response model is as accurate as for the global variables. In a screening approach, these results are suf ficient for an interesting interpretation of 37
the results.
Pressure mainly depends on the initial mass of air and the accurate simulation of the heat losses. Then, parameters acting on condensation (temperature of the con-denser) are important.
Mean gas temperature is mainly driven by the convective heat exchange along the condensers (energy transfer without mass). Then, the mixing length acting on the mixing process of the rising jet becomes important and finally, injection conditions follow.
Condensation mass flow rate is first controlled by the temperature of the con-densers. Then, the impact of the spurious condensation is evident (controlled by
Hext) and finally, the mixing length becomes an important parameter (decrease of
the mixing length will decrease the mixing process and enhanced the condensation mass flow rate along the upper condenser). This last parameter has different impact on the different condensers.
Gas temperature difference along R2 axis is mainly dependent on the mixing hy-pothesis (choice of the mixing length). Degree of saturation along R2 axis is first controlled by the convective heat transfer coefficient along the condensers (increase of the heat transfer coefficient will lead to conditions closer to the saturation state). Velocities are controlled as expected by the choice of the mixing length. The impact is more important for the jet zone instead of the condensation zone. These results provide some explanations of the experimental and computational results and this may give some guidelines to investigate some post tests calculations. Such studies are a powerful tool for interpretation.
120 125 130 135 140 145 150 0 1000 2000 3000 4000 5000 6000 7000 8000 Tgas (Celsius) z(mm) Exp.2002 Exp.2004 COCLP5 ASTLP6 FUMLP7 MELLP11 COCLP14 KUPLP15 ASTLP5 TONLP16 120 125 130 135 140 145 150 0 1000 2000 3000 4000 5000 6000 7000 8000 Tgas (Celsius) z(mm) Exp.2002 Exp.2004 GOT2D1 GAS2D4 DEF2D8 DEF3D8 CFX2D9 GOT2D13 KUP2D15 TON2D16 TON3D16
Fig. 19. ISP47 - Phase B - Gas temperature profile along R4 axis (Top: LP codes - Bottom: CFD codes)